No Sign of Cooling Inflation in September CPI Report

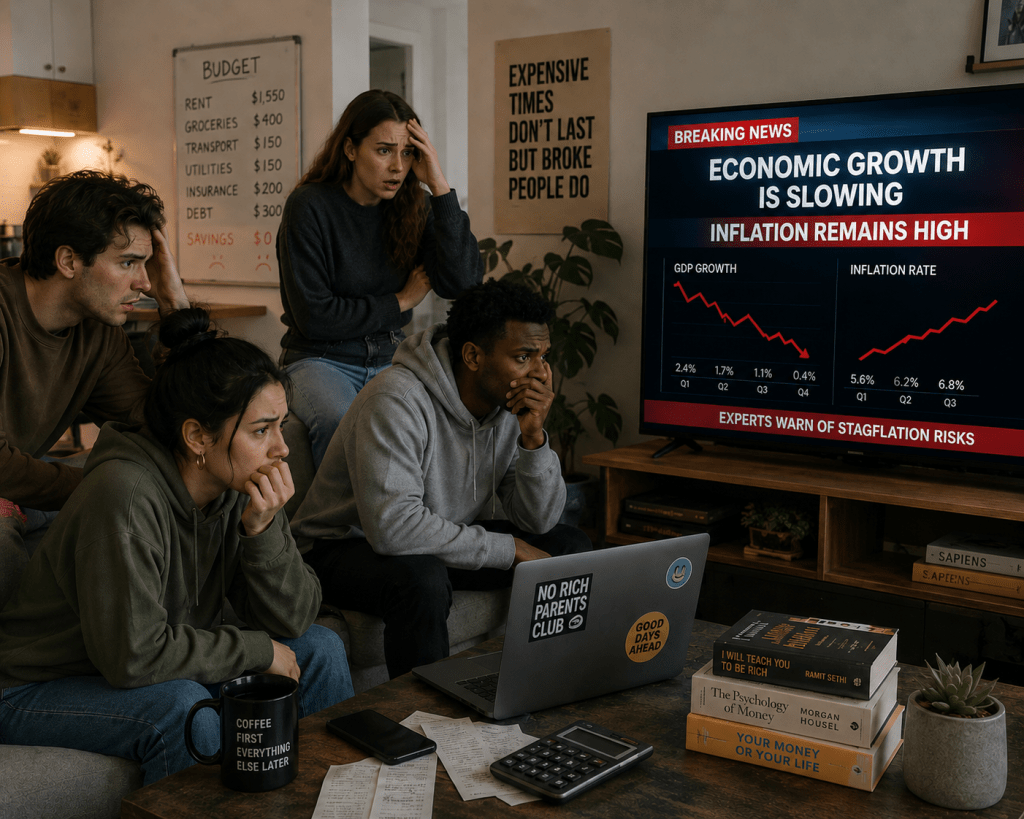
Image created by ChatGPT

Today’s report from the Bureau of Labor Statistics (BLS) on the consumer price index (CPI) for August was eagerly awaited by economists and policy analysts. As we discuss in Macroeconomics, Chapter 15 (Economics, Chapter 25), monetary policy affects the economy with, in the words of Nobel Laureate Milton Friedman, “long and variable lags.” As a result, most economists agree that the Federal Reserve should not attempt to “fine tune” the economy by responding to each government release of macroeconomic data.

There are some instances, however, including the present, when the Fed’s policymaking Federal Open Market Committee (FOMC) appears to be uncertain as to whether a change in policy is needed. As a result, there was a widespread expectation that if today’s report indicated that inflation is slowing, the FOMC would likely leave its target for the federal funds rate unchanged at its meeting on Tuesday and Wednesday of next week. But if the report didn’t indicate that inflation is slowing, the committee would likely raise its target. The report gave few indications that inflation is slowing.

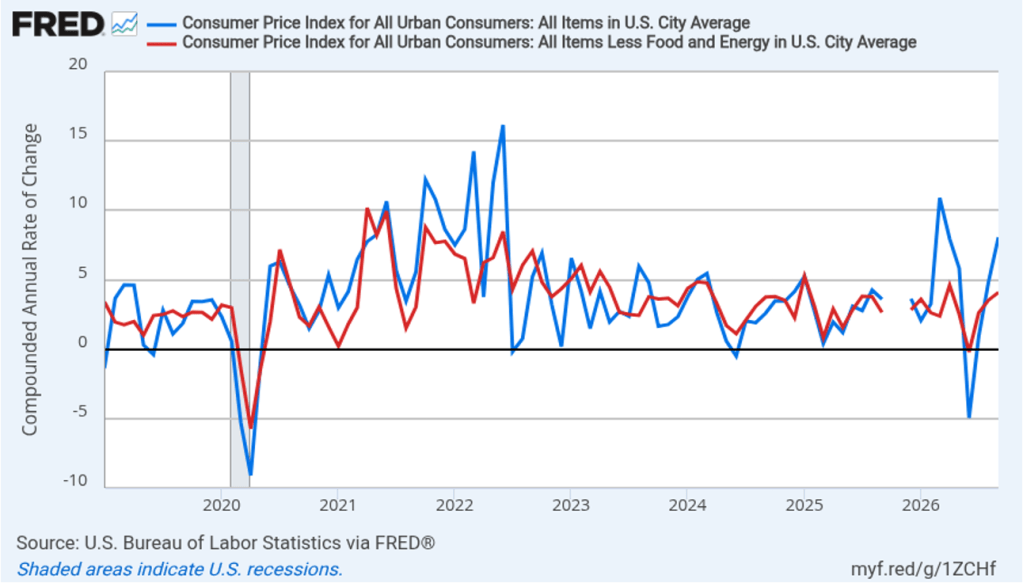
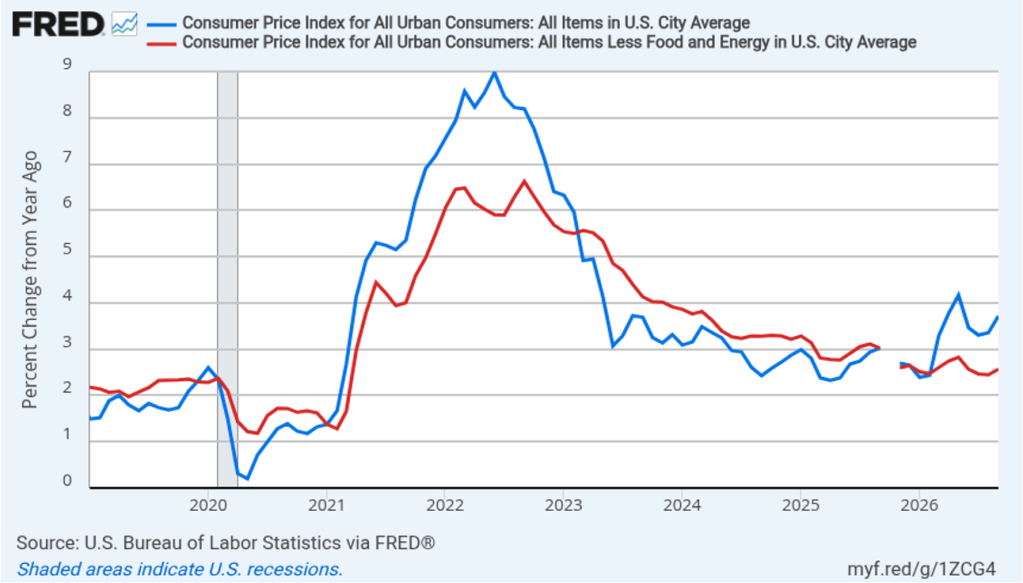
The following figure compares headline CPI inflation (the blue line) and core CPI inflation (the red line).

  • The headline inflation rate, which is measured by the percentage change in the CPI from the same month in the previous year, was 3.4 percent in August, the same as in July. 
  • The core inflation rate, which excludes the prices of food and energy, was 2.4 percent in August, down from 2.5 in July.  

Headline inflation was slightly higher, and core inflation was equal, to the forecasts of economists surveyed by FactSet. (Note that because of last year’s federal government shutdown, inflation data for October 2025 are not available.)
In the following figure, we look at the 1-month inflation rate for headline and core inflation—that is the annual inflation rate calculated by compounding the current month’s rate over an entire year. Calculated as the 1-month inflation rate, headline (the blue line) was 4.6 percent In August, up from 0.9 percent in July. Core inflation (the red line) was 3.5 percent in August, up from 2.6 percent in July.

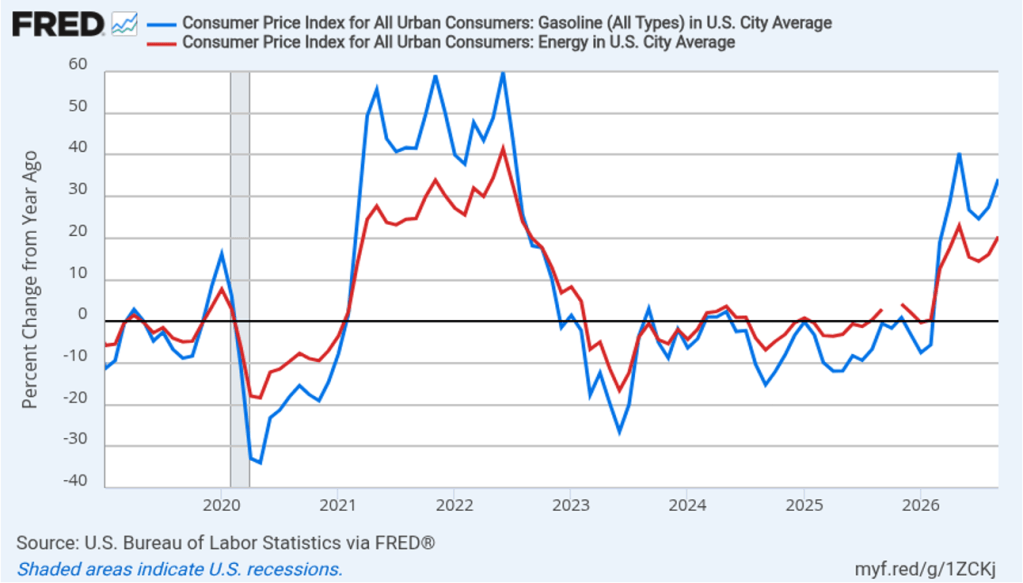
The following figure illustrates the role played by energy prices in contributing to the large swings in the monthly inflation rate since the conflict in Iran began at the end of February. The red line shows the 1-month inflation rate in all energy prices included in the CPI. Inflation in energy prices, which had declined at an annual rate of 16.4 percent in July, increased at an annual rate of 28.3 percent in August. The blue line shows the 1-month inflation rate in gasoline prices, which had declined at an annual rate of 29.4 percent in July, increased at an annual rate of 58.3 percent in August.

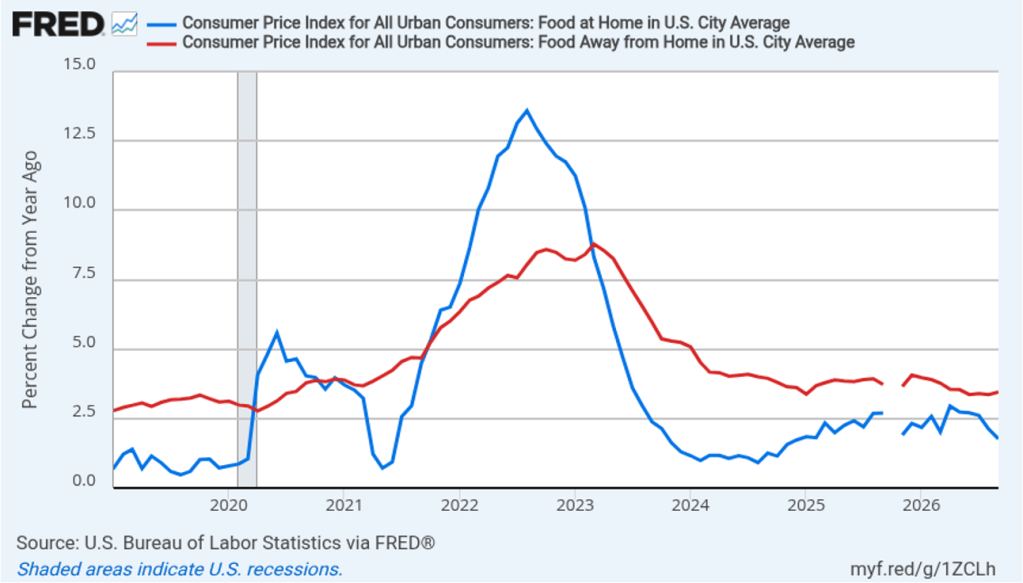
There had been a fear that the rise in energy prices that began in March would pass through to increases in food prices, which are a key concern for many consumers. The following figure shows 1-month inflation in the CPI category “food at home” (the blue bar)—primarily food purchased at grocery stores—and in the category “food away from home” (the red bar)—primarily food purchased at restaurants. Grocery prices, which had declined at annual rate of 0.9 percent in July, increased at an annual rate of 0.4 percent in August. Food prices away from home increased 3.1 percent in August, down from 3.9 percent in July. To this point, increases in energy prices seem to have had some effect on grocery prices and restaurant prices, although the extent of the effect is unclear.
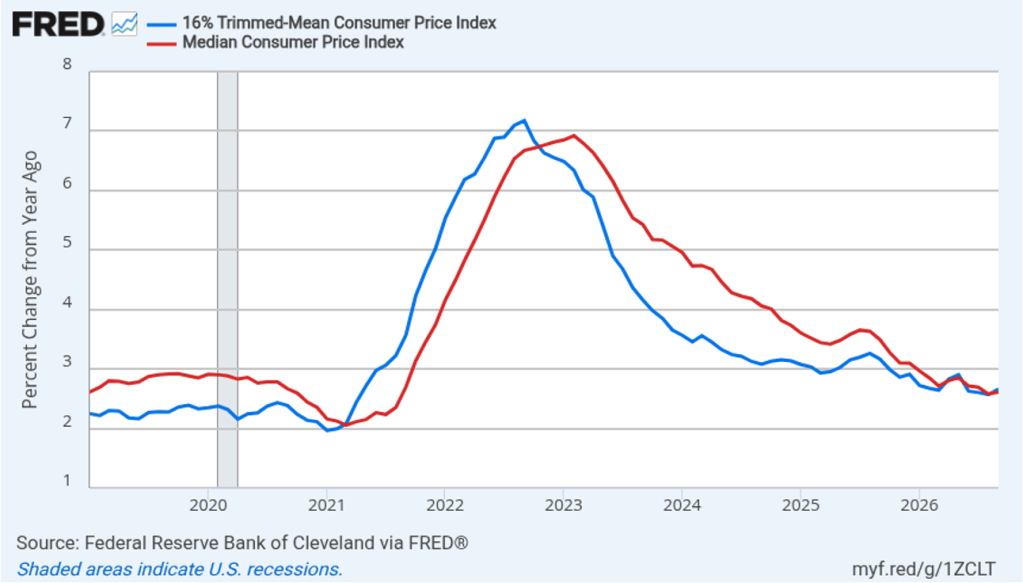
Fed Chair Kevin Warsh has indicated that he favors measures of the inflation rate that exclude particularly small or particularly large changes in the prices of some goods or services—so-called outliers. Median CPI, which is compiled monthly by economists at the Federal Reserve Bank of Cleveland, is calculated by ranking the price changes of every good or service in the index from the largest price change to the smallest price change, and then choosing the price change in the middle. The idea is to eliminate the effect on measured inflation of any short-lived events that cause the prices of some goods and services to be particularly high or particularly low. Economists at the Cleveland Fed have conducted research that shows that, in their words, “the median CPI provides a better signal of the underlying inflation trend than either the all-items CPI or the CPI excluding food and energy. The median CPI is even better at forecasting [personal consumption expenditures] PCE inflation in the near and longer term than the core PCE price index.”

Trimmed-mean inflation, also compiled by economists at the Cleveland Fed, excludes the highest 8 percent of price changes and the lowest 8 percent. The following figure shows 1-month trimmed mean (the blue line) and median (the red line) CPI inflation. Trimmed-mean inflation was 2.7 percent in August, unchanged from July. Median inflation was 2.1 percent in August, down from 3.1 percent in July. So these measures of inflation are both lower than the conventional headline and core CPI inflation measures, although as the figure shows, both measures are volatile.

Note that the Fed uses the 12-month change in the personal consumption expenditures (PCE) price index, not the change in the CPI, when gauging whether it is hitting its 2 percent annual inflation target. Historically, PCE inflation has been about 0.4 percentage points to 0.5 percentage points lower than CPI inflation. The Bureau of Economic Analysis (BEA) won’t release its estimate of August PCE inflation until September 30, after the next FOMC meeting.

Today’s report showing that inflation remains persistently above the Fed’s 2 percent annual target, following last week’s jobs report showing an unexpectedly large increase in employment, has likely raised the chance that Federal Reserve policymakers will increase their target range for the federal funds rate from the current 3.50 percent to 3.75 percent by o.25 percentage points (or 25 basis points) at the next meeting of the FOMC on September 15–16. Trading in the federal funds futures market this afternoon indicates that investors assign a 86.5 percent probability to the FOMC raising its target range at that meeting, which is up from a 72.4 probability yesterday. Trading indicated that investors assign a 74.5 percent probability to the committee increasing its target range by at least 50 basis points by the end of the year, up from 64.6 percent yesterday and from 44.7 percent one week ago.

New BEA Releases Show Steady Inflation and Higher Output Growth

Image created by ChatGPT

The Bureau of Economic Analysis (BEA) released two reports this morning (August 26): “GDP (Second Estimate) and Corporate Profits, 2nd Quarter 2026” and “Personal Income and Outlays, July 2026.” The BEA’s second estimate is that real GDP grew at annual rate of 1.5 percent in second quarter of 2026, which is unchanged from the BEA’s initial estimate released last month and is equal to the forecast of economists surveyed by the Wall Street Journal

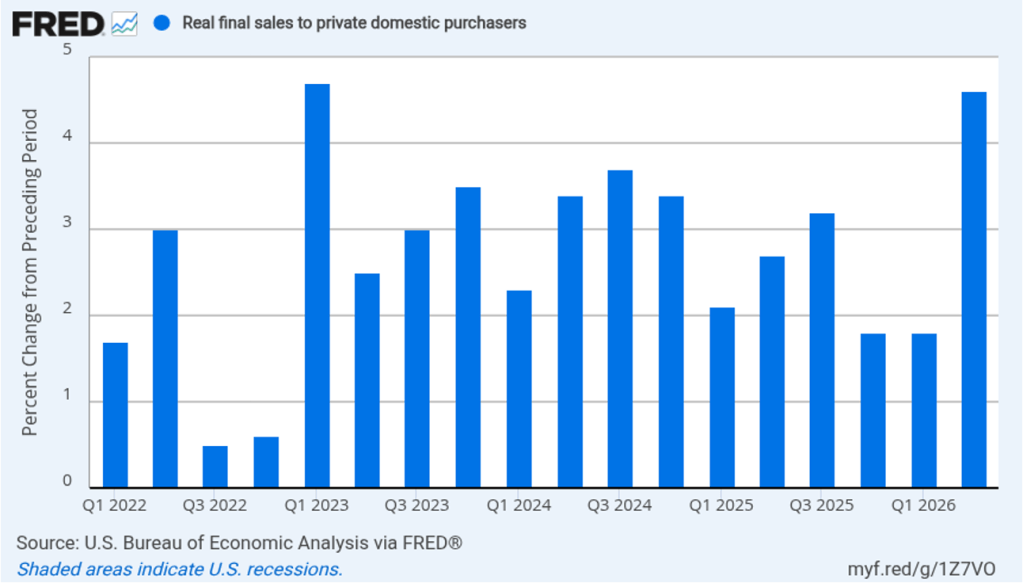
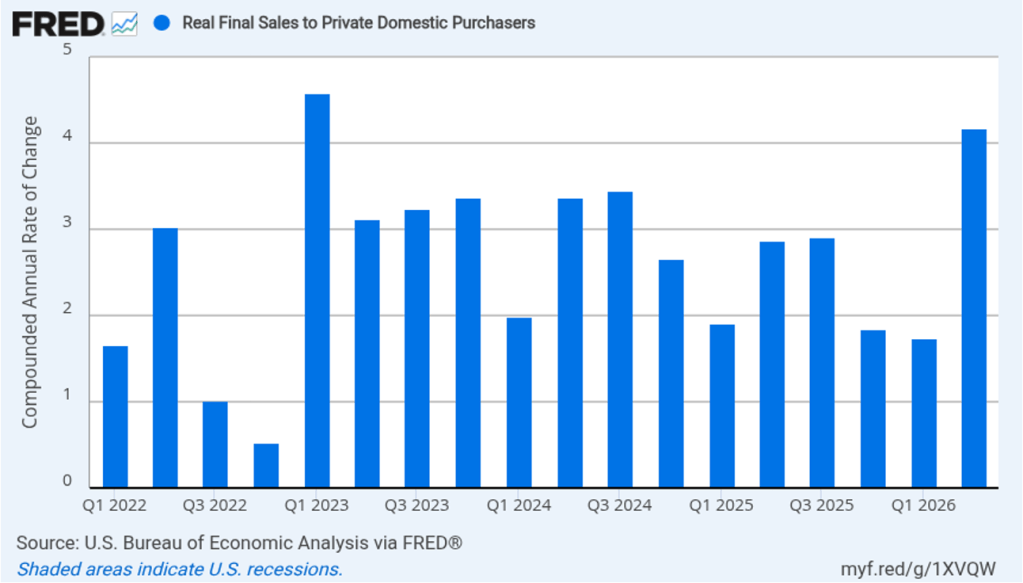
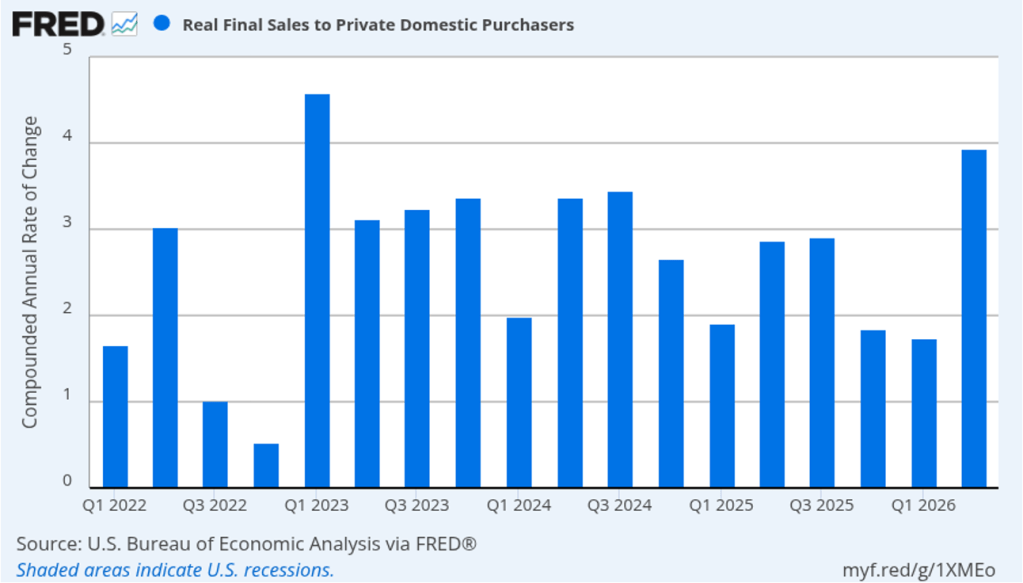
As we’ve discussed in previous blog posts, to better gauge the state of the economy, Federal Reserve policymakers often prefer to strip out the effects of imports, inventory investment, and government expenditures—which can be volatile—by looking at real final sales to private domestic purchasers, which includes only spending by U.S. households and firms on domestic production. As the following figure shows, real final sales to domestic purchasers increased at an annual rate of 4.2 percent in the second quarter, up from 3.9 percent in last month’s initial estimate. The growth rate in real final sales to domestic purchasers was more than twice the rate of growth of real GDP, as well as far above the U.S. economy’s expected long-run annual real growth rate of 1.8 percent. So growth in real final sales to domestic purchasers indicates that the U.S. economy is expanding rapidly, as opposed to the much weaker growth shown by real GDP data. Typically, growth in real final sales to domestic purchasers is steadier than growth in real GDP and is likely a better indicator of the underlying growth rate in the economy.

The BEA’s “Personal Income and Outlays” report this morning included monthly data on the personal consumption expenditures (PCE) price index. The Fed relies on annual changes in the PCE price index to evaluate whether it’s meeting its 2 percent annual inflation target. As we noted in a recent blog post, Fed Chair Kevin Warsh indicated in his press conference following the July meeting of the Federal Open Market Committee (FOMC) that the committee intended to continue using the PCE price index as its gauge of inflation, although that decision would be revisited early next year. Warsh may have intended this statement to reassure financial markets that there would be continuity in the Fed’s measure of inflation. However, some investors appear to have interpreted Warsh’s statement that the decision would be revisited next year as an indication that he favored moving to a measure that would show lower rates of inflation than those shown by the PCE.

In other words, some investors believe that in the future the FOMC might be willing to accept higher levels of PCE inflation. Perhaps in response to this interpretation, the yield on the 30-year U.S. Treasury bond increased in the days following Warsh’s press conference. Higher expected inflation can lead to lower bond prices and higher bond yields. (We discuss this point in MoneyBanking, and the Financial System, Chapter 5, which is now available in a new edition.) Warsh is scheduled to speak on Friday at the Kansas City Fed’s annual Jackson Hole Economic Policy Symposium. His speech will cover his views on the current state of the economy and may give clues as to the future monetary policy actions he may support.

Image created by ChatGPT

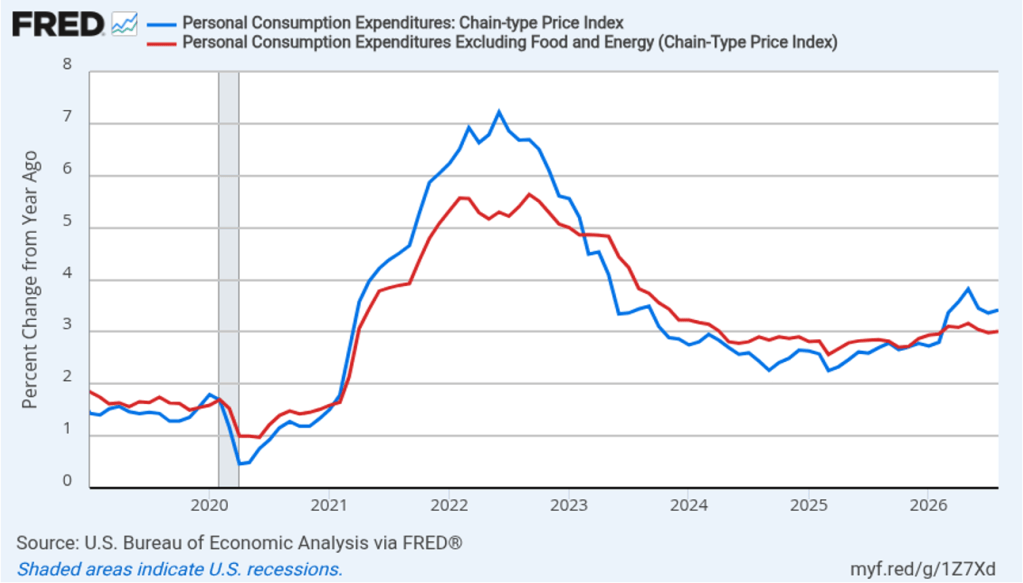
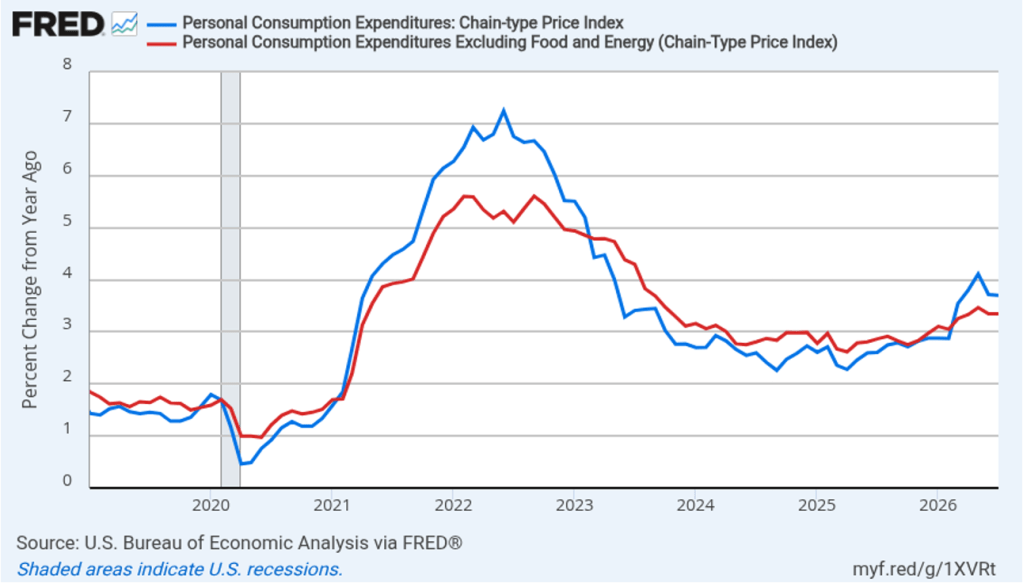
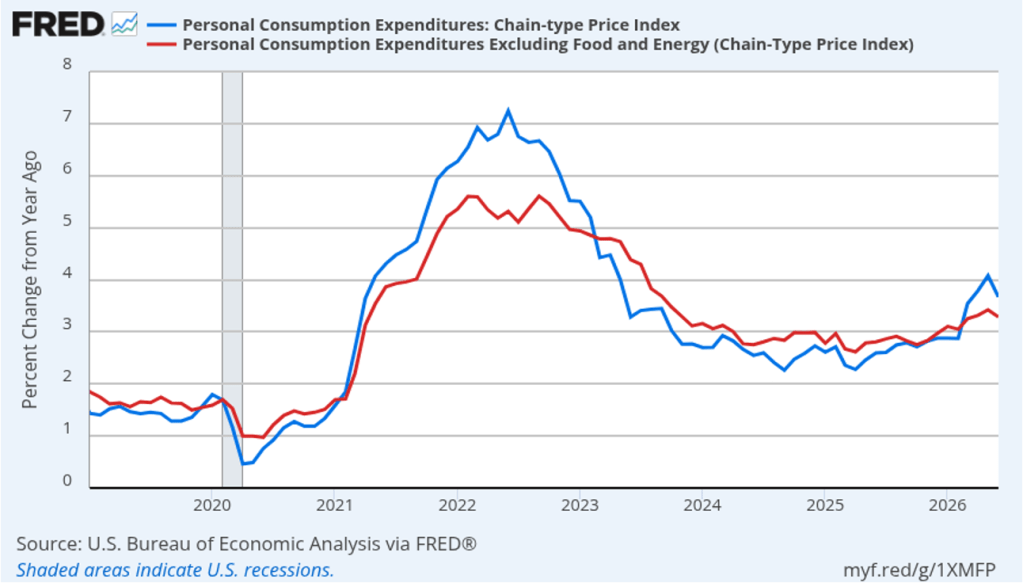
The following figure shows headline PCE inflation (the blue line) and core PCE inflation (the red line)—which excludes energy and food prices—for the period since January 2019, with inflation measured as the percentage change in the PCE from the same month in the previous year. In July, headline PCE inflation was 3.7 percent, unchanged from June. Core PCE inflation in July was 3.3 percent, also unchanged from June. Headline PCE inflation was slightly higher than forecast by economists surveyed by the Wall Street Journal, while core PCE was equal to the forecast. Both headline PCE inflation and core PCE inflation remain well above the Fed’s 2 percent annual inflation target.

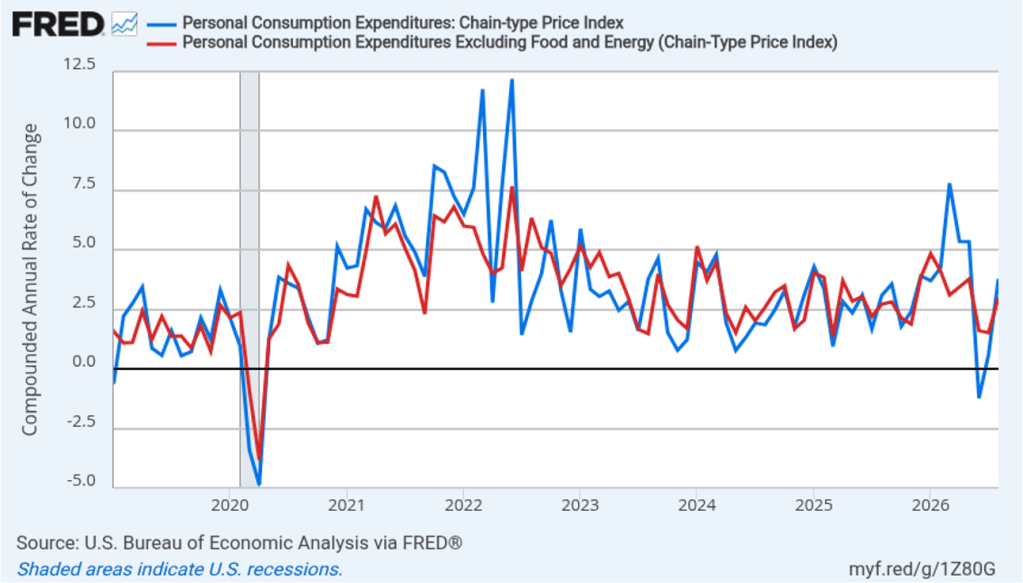
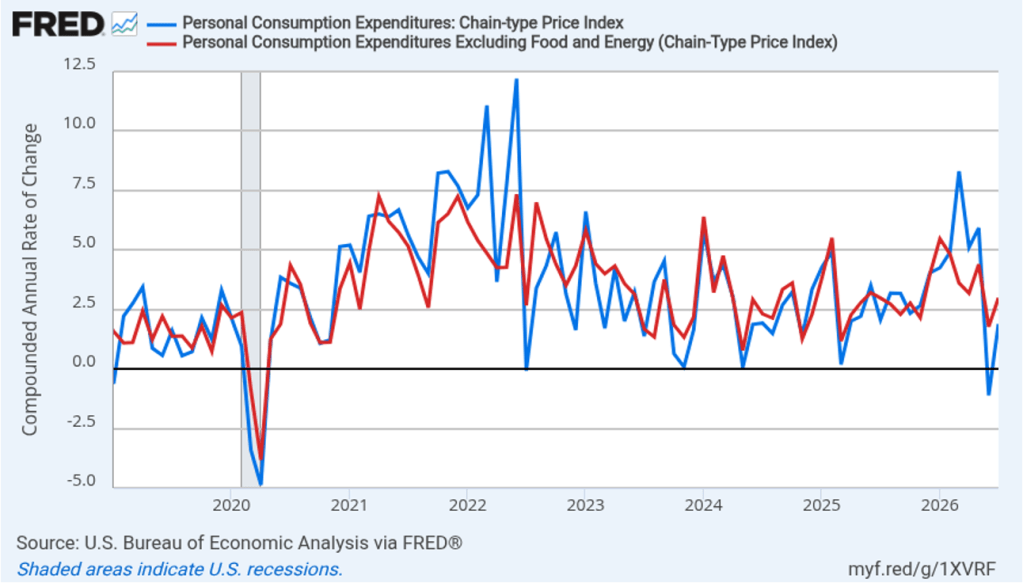
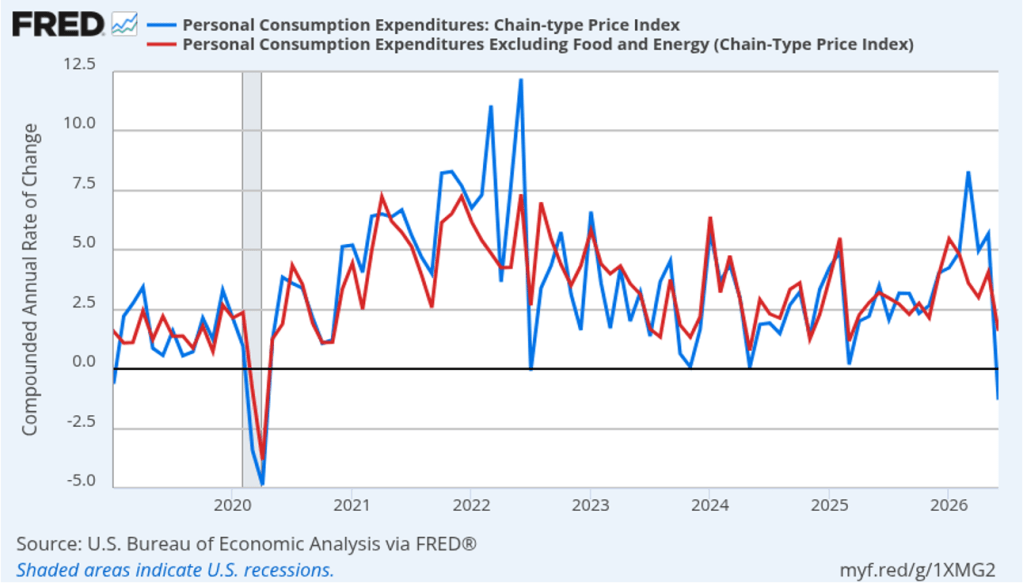
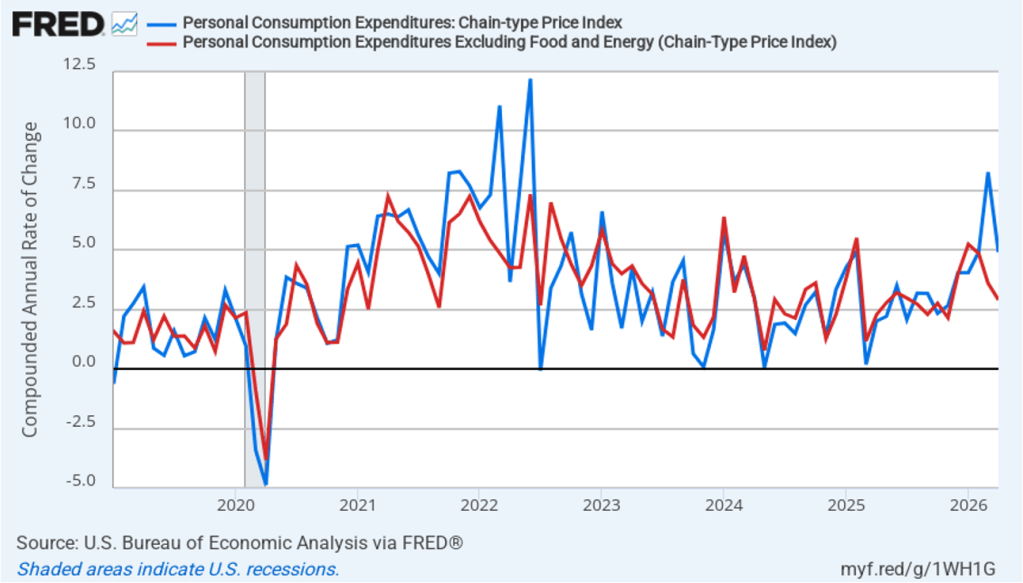
The following figure shows headline PCE inflation and core PCE inflation calculated by compounding the current month’s rate over an entire year. (Often referred to as 1-month inflation.) Measured this way, headline PCE inflation increased from –1.3 in June to 1.9 percent in July. Core PCE inflation increased from 1.8 percent in June to 3.0 percent in July. Headline inflation was very low in June—prices actually fell during the month—largely because of falling gasoline prices. Today’s data show here was a noticeable acceleration in inflation during July. Of course, it’s important not to overinterpret the data from a single month.

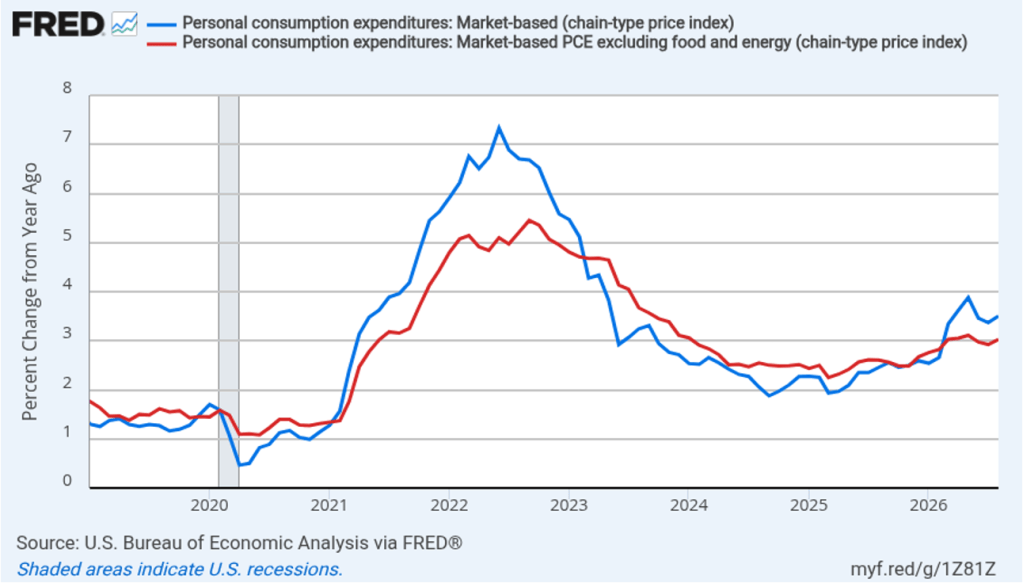
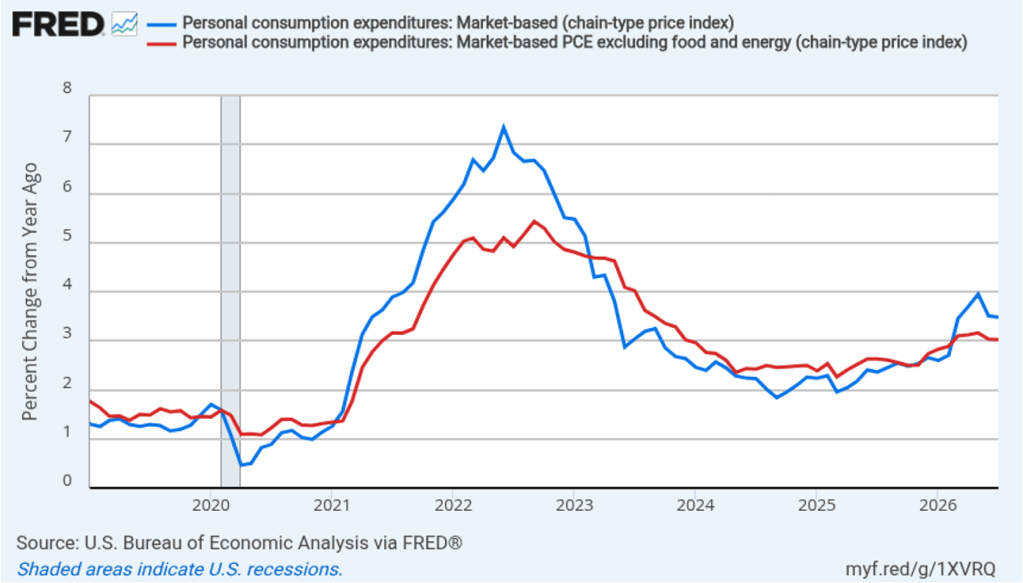
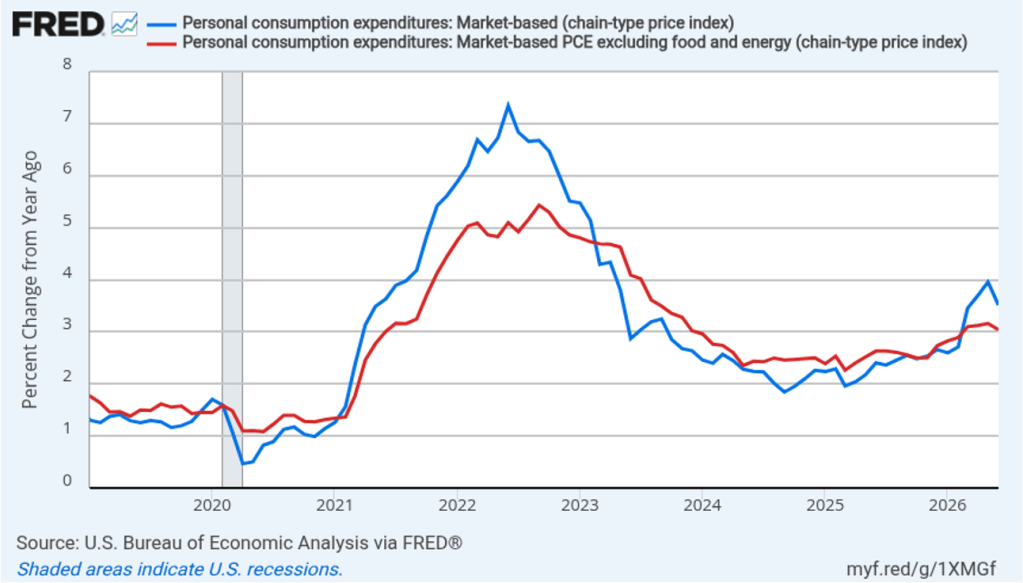
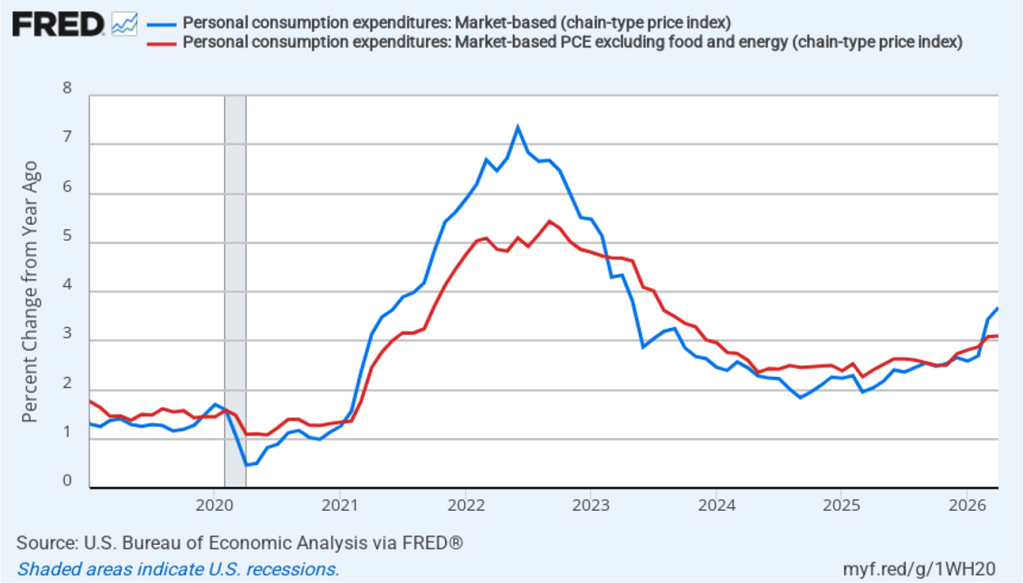
Fed policymakers believe that inflation in non-market services can skew PCE inflation. Non-market services are services whose prices the BEA imputes rather than measures directly. For instance, the BEA assumes that prices of financial services—such as brokerage fees—vary with the prices of financial assets. So that if stock prices rise, the prices of financial services included in the PCE price index also rise. Former Fed Chair Jerome Powell has argued that these imputed prices “don’t really tell us much about … tightness in the economy. They don’t really reflect that.” The following figure shows 12-month headline inflation (the blue line) and 12-month core inflation (the red line) for market-based PCE. (The BEA explains the market-based PCE measure here.)

Headline market-based PCE inflation was 3.5 percent in July, unchanged from June. Core market-based PCE inflation was 3.0 percent in July, also unchanged from June. So, both market-based measures show inflation in July remaining well above the Fed’s 2 percent target.

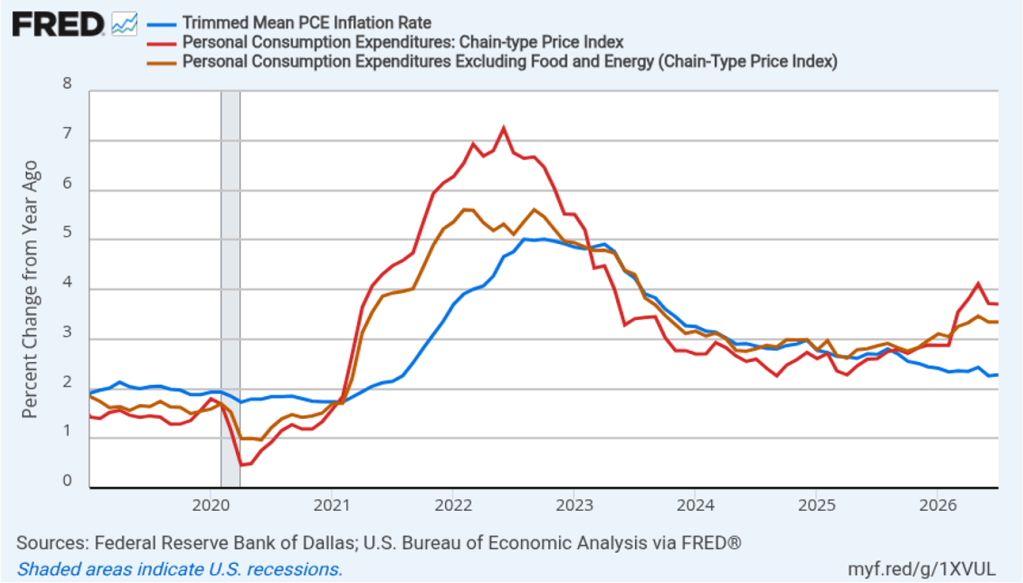
Fed Chair Kevin Warsh argued in testimony at his confirmation hearing before the Senate that the Fed should stop relying on headline PCE inflation: “The measures [of inflation] I prefer are looking at things that are called trimmed averages. We take out all of the tail-risks, all of the one-off items, and we ask ourselves whether the generalized change in prices is having second-order effects on the economy.” 

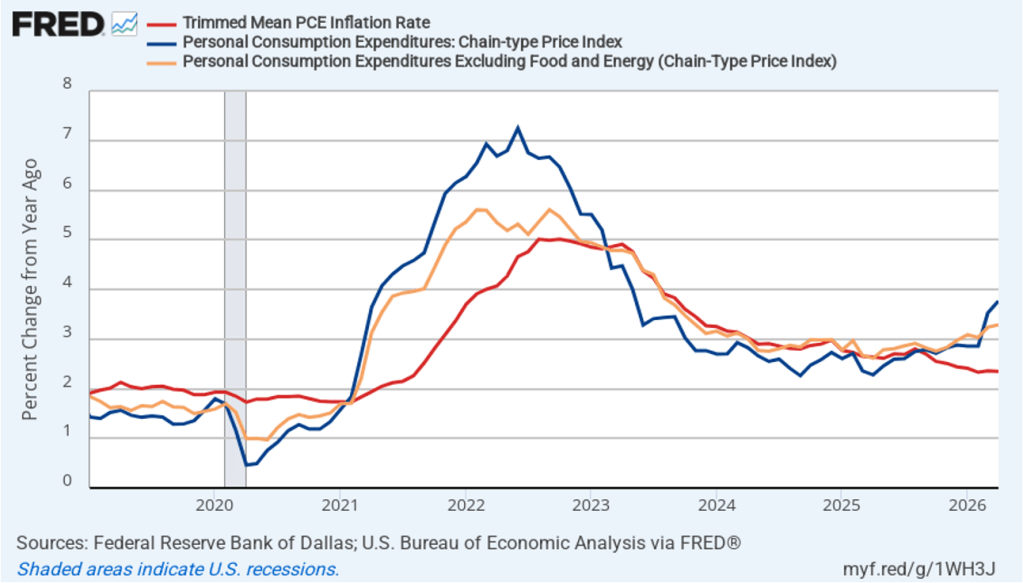
Trimmed-mean PCE inflation drops the 31 percent of goods and services with the highest inflation rates and the 24 percent of goods and services with the lowest inflation rates. A closely related measure, median PCE inflation, is calculated by listing the inflation rate in each individual good or service included in the PCE and identifying the inflation rate of the good or service that is in the middle of the list—that is, the inflation rate in the price of the good or service that has an equal number of higher and lower inflation rates. 

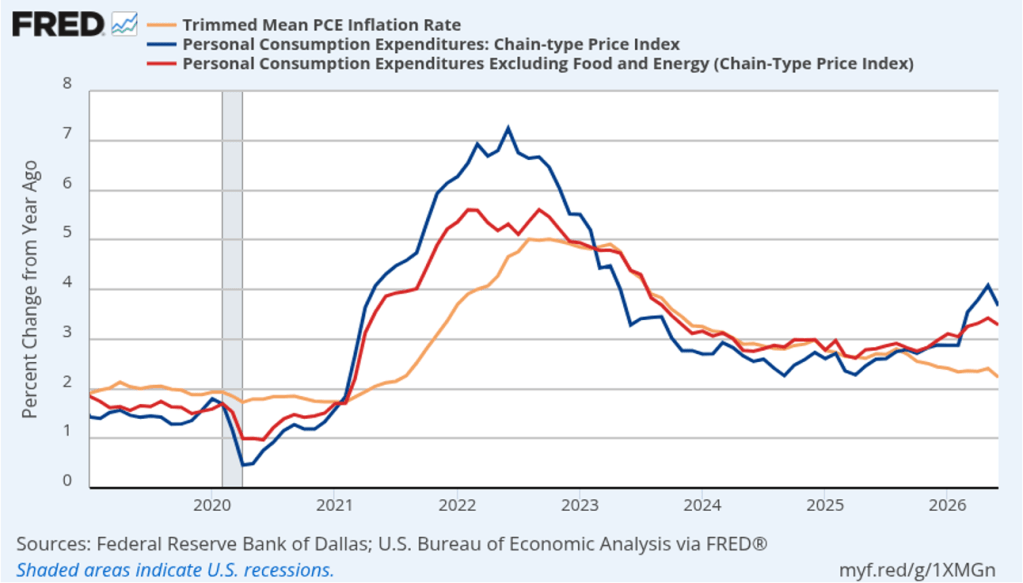
The following figure shows headline PCE inflation the (red line), core PCE inflation (the brown line) and trimmed-mean PCE inflation (the blue line). Trimmed-mean PCE inflation in July was 2.3 percent, well below both headline and core PCE inflation.

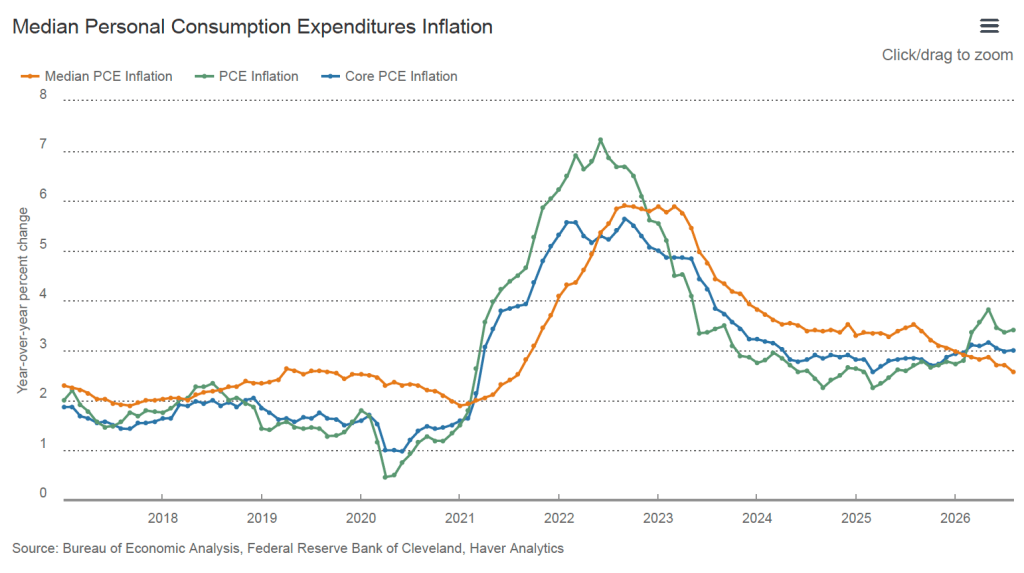
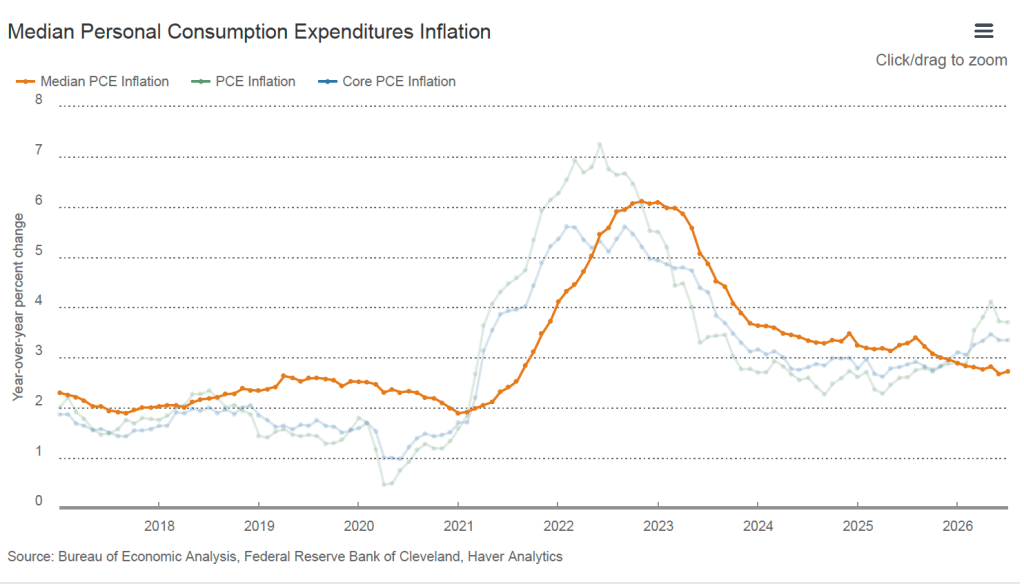
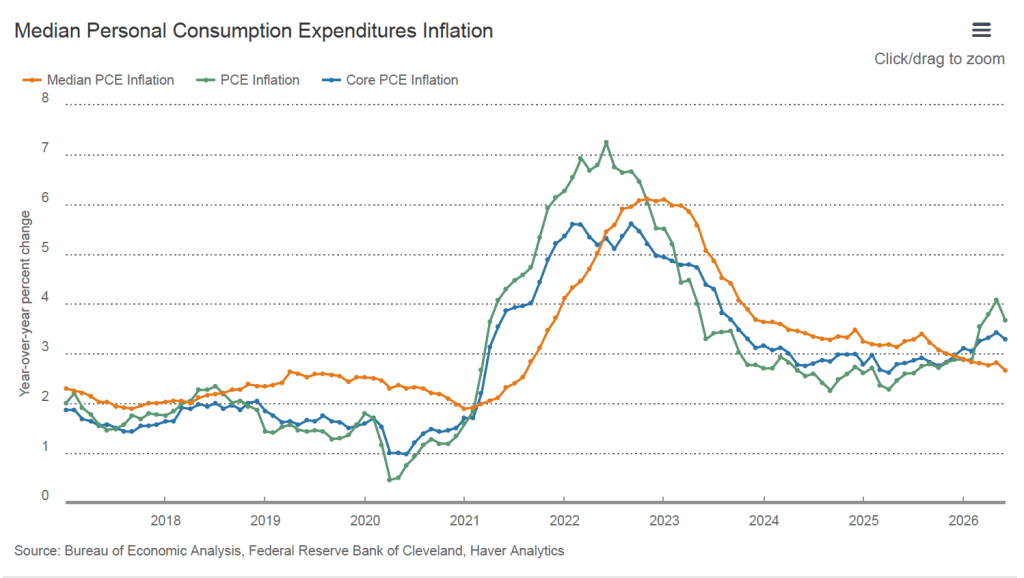
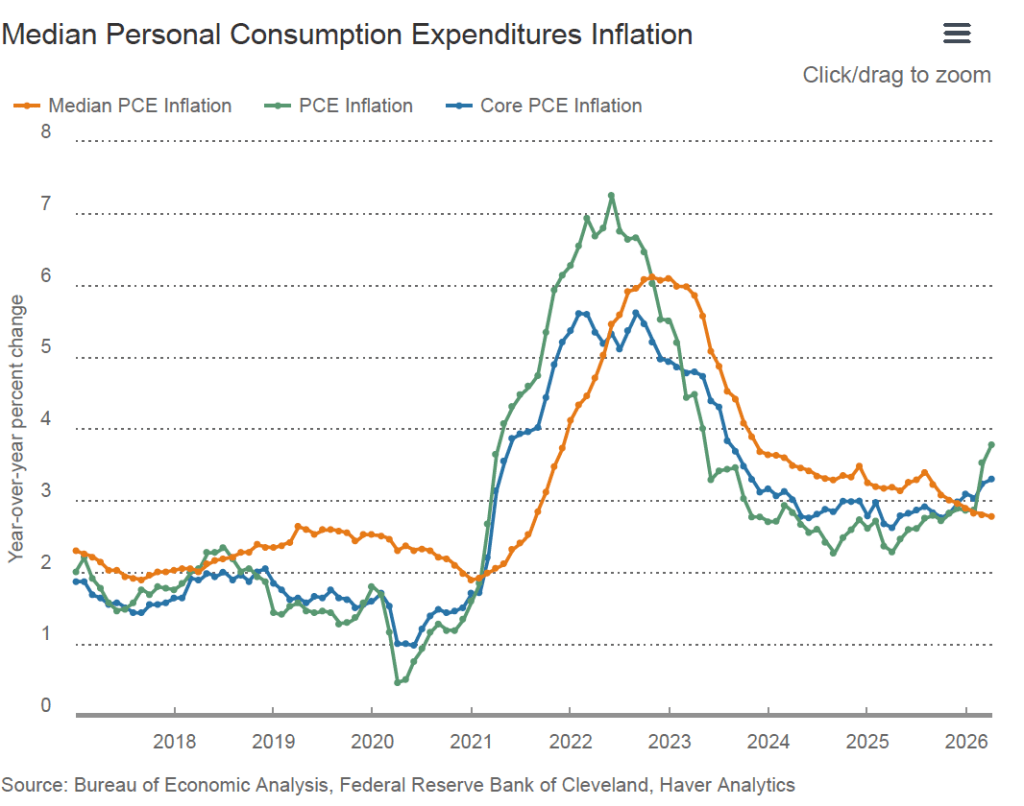
The following figure from the web site of the Federal Reserve Bank of Cleveland shows headline PCE inflation (the green line), core PCE inflation (the blue line), and median PCE inflation (the brown line). In July, median PCE inflation was 2.7 percent, which was unchanged from June. So Warsh has a point that these two measures of inflation, which are less affected by particularly high or low rates of inflation in some goods and services, indicate that inflation has been running below the Fed’s currently preferred measure. But these measures also show inflation still running well above the Fed’s 2 percent annual inflation target.

Today’s macro data releases appear to have had little effect on the views of investors who buy and sell federal funds futures contracts. These investors believe that the FOMC will likely not raise its target for the federal funds rate at its meeting on September 15–16 as some analysts have speculated. The probability that the committee will leave its target range unchanged at 3.50 percent to 3.75 percent declined only slightly from 60.4 percent yesterday to 59.9 percent this afternoon. Investors assign a probability of 54.7 percent to the FOMC raising its target range by o.25 percentage points (25 basis points) at its meeting on October 27–28.

New BEA Releases Show Slower Growth Than Expected and Lower Inflation

Image created by ChatGPT

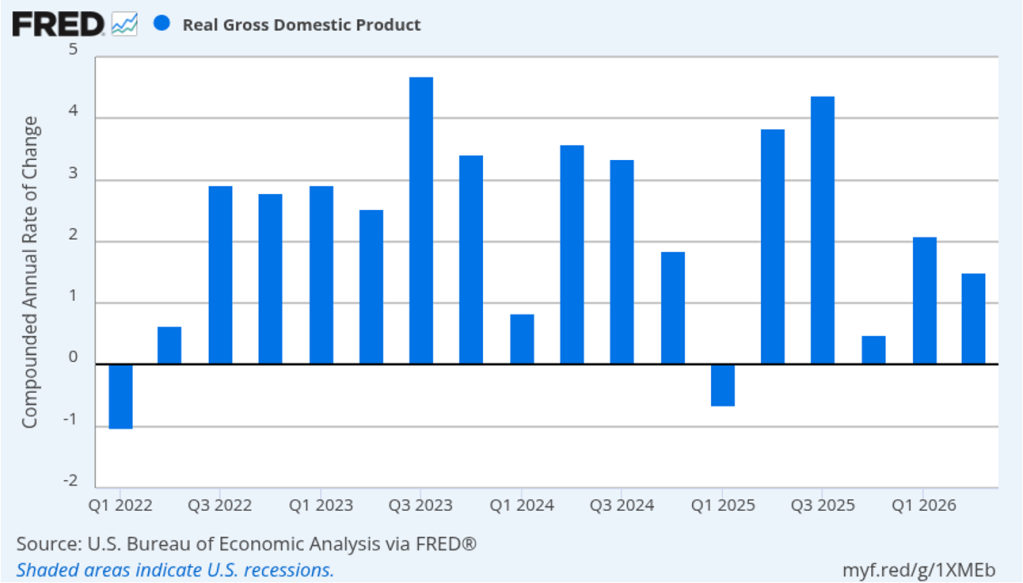
The Bureau of Economic Analysis (BEA) released two reports this morning (July 30): “GDP (Advance Estimate), 2nd Quarter 2026” and “Personal Income and Outlays, June 2026.” The BEA’s initial—or advance—estimate is that real GDP grew in the second quarter of 2026 at annual rate of 1.5 percent, down from an annual rate of 2.1 percent in the first quarter. Economists surveyed by the Wall Street Journal had forecast that real GDP would grow at a rate of 1.8 percent in the second quarter. The following figure shows the BEA’s estimated rates of real GDP growth in each quarter beginning with the first quarter of 2022.

As we’ve discussed in previous blog posts, to better gauge the state of the economy, policymakers—including former Fed Chair Jerome Powell—often prefer to strip out the effects of imports, inventory investment, and government expenditures—which can be volatile—by looking at real final sales to private domestic purchasers, which includes only spending by U.S. households and firms on domestic production. As the following figure shows, real final sales to domestic purchasers increased at an annual rate of 3.9 percent in the second quarter, more than twice the rate of growth of real GDP, as well as far above the U.S. economy’s expected long-run annual real growth rate of 1.8 percent. So growth in real final sales to domestic purchasers indicates that the U.S. economy is expanding rapidly, as opposed to the much weaker growth shown by real GDP data. Typically, growth in real final sales to domestic purchasers is steadier than growth in real GDP and is likely a better indicator of the underlying growth rate in the economy.

There has been much discussion in the media of the surge in spending on new data centers to power artificial intelligence programs. This surge is reflected in following figure, which shows real domestic investment in information processing equipment. This category of investment spending has increased more than 40 percent since the fourth quarter of 2024.

The BEA’s “Personal Income and Outlays” report this morning included monthly data on the personal consumption expenditures (PCE) price index. The Fed relies on annual changes in the PCE price index to evaluate whether it’s meeting its 2 percent annual inflation target. As we noted in a blog post yesterday, Fed Chair Kevin Warsh indicated in his press conference following the meeting of the Federal Open Market Committee (FOMC) that the committee intended to continue using the PCE price index as its gauge of inflation, although that decision would be revisited early next year. Warsh may have intended this statement to reassure financial markets that there would be continuity in the Fed’s measure of inflation. However, some investors appear to have interpreted Warsh’s statement that the decision would be revisited next year as an indication that he favored moving to a measure that would show lower rates of inflation than those shown by the PCE.

In other words, some investors believe that in the future the FOMC might be willing to accept higher levels of PCE inflation. Perhaps in response to this interpretation, the yield on the 30-year U.S. Treasury bond rose to its highest level since 2007. Higher expected inflation can lead to lower bond prices and higher bond yields. (We discuss this point in Money, Banking, and the Financial System, Chapter 5, which is now available in a new edition.)

The following figure shows headline PCE inflation (the blue line) and core PCE inflation (the red line)—which excludes energy and food prices—for the period since January 2019, with inflation measured as the percentage change in the PCE from the same month in the previous year. In June, headline PCE inflation was 3.7 percent, down from 4.1 percent in May. Core PCE inflation in June was 3.3 percent, down slightly from 3.4 percent in May. Headline and core PCE inflation were both equal to the forecasts of economists surveyed by the Wall Street Journal. Both headline PCE inflation and core PCE inflation remain well above the Fed’s 2 percent annual inflation target.

The following figure shows monthly PCE inflation and monthly core PCE inflation calculated by compounding the current month’s rate over an entire year. (Often referred to as 1-month inflation.) Measured this way, headline PCE inflation declined from 5.7 percent in May to –1.3 percent in June; in other words, consumer prices fell in June. Core PCE inflation fell from 4.1 in May to 1.6 percent in June. Even leaving aside the effect of falling gasoline prices on headline PCE, these data show that in June there was a noticeable deceleration in inflation. Of course, it’s important not to overinterpret the data from a single month.

Former Fed Chair Jerome Powell frequently mentioned that inflation in non-market services can skew PCE inflation. Non-market services are services whose prices the BEA imputes rather than measures directly. For instance, the BEA assumes that prices of financial services—such as brokerage fees—vary with the prices of financial assets. So that if stock prices rise, the prices of financial services included in the PCE price index also rise. Powell has argued that these imputed prices “don’t really tell us much about … tightness in the economy. They don’t really reflect that.” The following figure shows 12-month headline inflation (the blue line) and 12-month core inflation (the red line) for market-based PCE. (The BEA explains the market-based PCE measure here.)

Headline market-based PCE inflation was 3.5 percent in May, down from 4.0 percent in May. Core market-based PCE inflation was 3.0 percent in June, down from 3.2 percent in May. So, both market-based measures, although lower than the full PCE measures, show inflation in June remaining well above the Fed’s 2 percent target.

Fed Chair Kevin Warsh argued in testimony at his confirmation hearing before the Senate that the Fed should stop relying on headline PCE inflation: “The measures [of inflation] I prefer are looking at things that are called trimmed averages. We take out all of the tail-risks, all of the one-off items, and we ask ourselves whether the generalized change in prices is having second-order effects on the economy.” 

Trimmed-mean PCE inflation drops the 31 percent of goods and services with the highest inflation rates and the 24 percent of goods and services with the lowest inflation rates. A closely related measure, median PCE inflation, is calculated by listing the inflation rate in each individual good or service included in the PCE and identifying the inflation rate of the good or service that is in the middle of the list—that is, the inflation rate in the price of the good or service that has an equal number of higher and lower inflation rates. 

The following figure shows headline PCE inflation the (blue line), core PCE inflation (the red line) and trimmed-mean PCE inflation (the brown line). Trimmed-mean PCE inflation in June was 2.2 percent, well below both headline and core PCE inflation.

The following figure from the web site of the Federal Reserve Bank of Cleveland shows headline PCE inflation (the green line), core PCE inflation (the blue line), and median PCE inflation (the brown line). In June, median PCE inflation was 2.7 percent, also below both headline and core inflation. So Warsh has a point that these two measures of inflation, which are less affected by particularly high or low rates of inflation in some goods and services, indicate that inflation has been running below the Fed’s currently preferred measure. But these measures also show inflation still running well above the Fed’s 2 percent annual inflation target.

Today’s macro data releases appear to have reinforced the view of investors who buy and sell federal funds futures contracts that the FOMC will raise its target for the federal funds rate by o.25 at its meeting on September 15–16. That probability increased from 58.3 percent yesterday to 65.4 percent this afternoon.

FOMC Holds Target Rate Constant, with Three Dissenting Votes

Fed Chair Kevin Warsh and colleagues discuss policy at the June FOMC meeting (Photo from federalreserve.gov.)

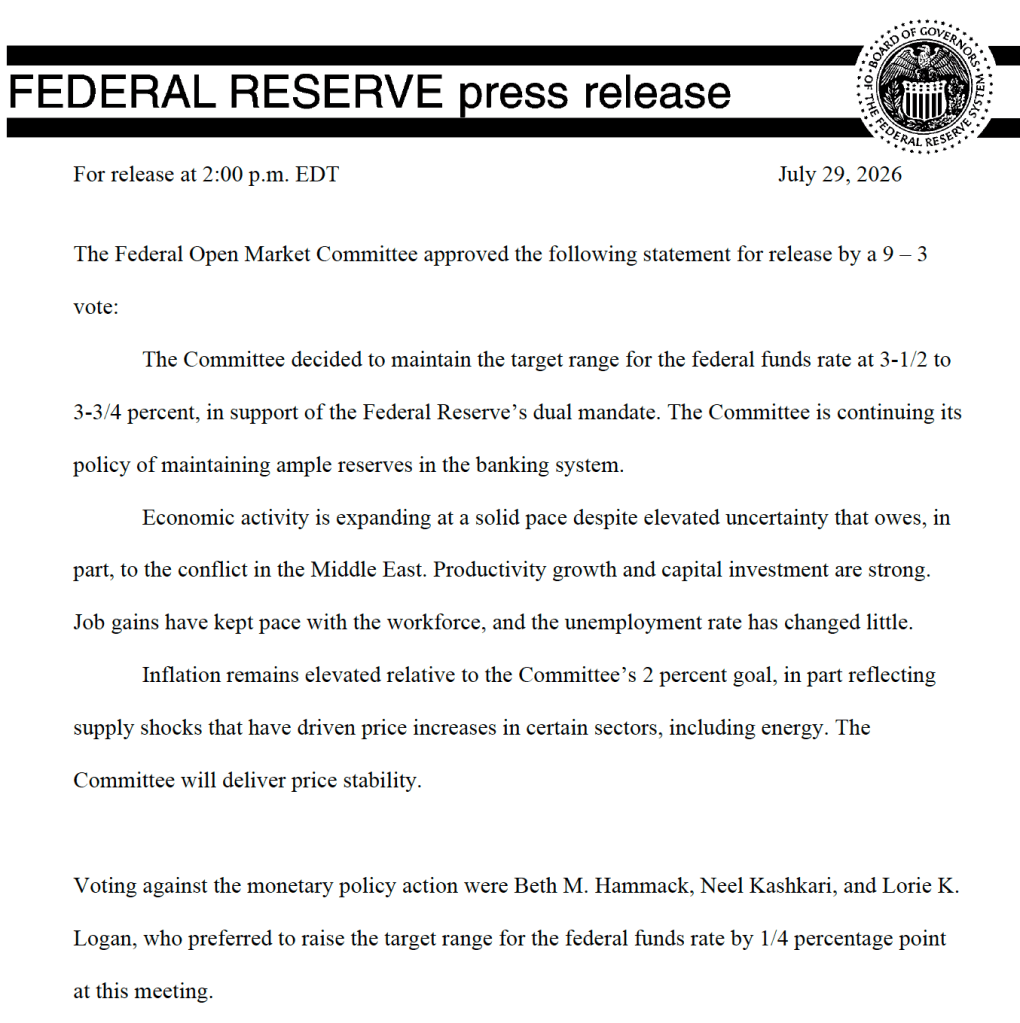
There was some uncertainty as to whether at its meeting that ended today, the Federal Open Market Committee (FOMC) would leave unchanged its target range for the federal funds rate at 3.50 percent to 3.75 percent. As of yesterday, trading in the federal funds rate futures market had given a 31 percent probability to the committee raising its target by 0.25 percentage points (25 basis points). The committee voted 9–3 to keep the target range unchanged, with Beth Hammack, president of the Federal Reserve Bank of Cleveland, Neel Kashkari, president of the Federal Reserve Bank of Minneapolis, and Lorie Logan, president of the Federal Reserve Bank of Dallas, voting to raise the target range by 25 basis points.

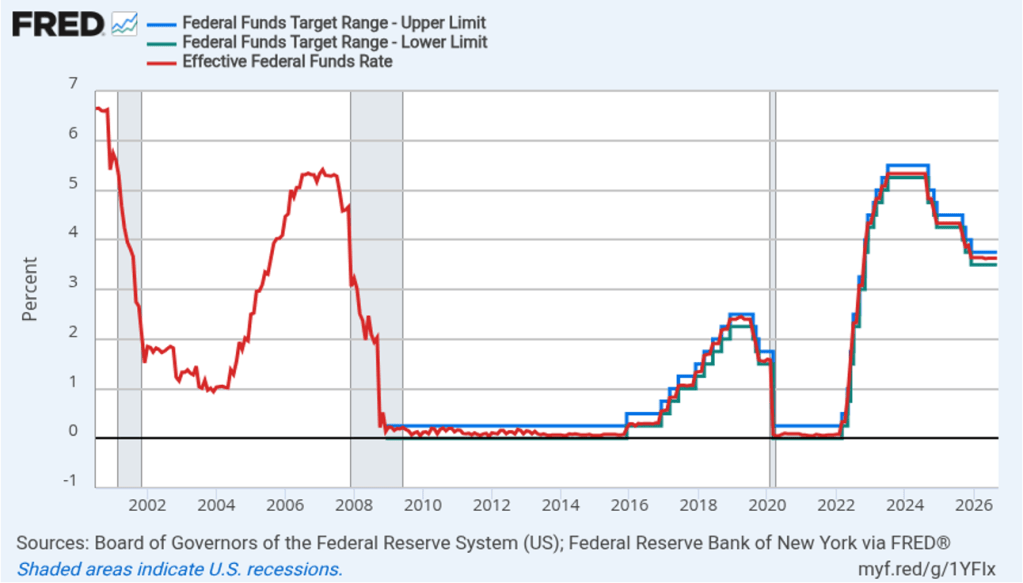
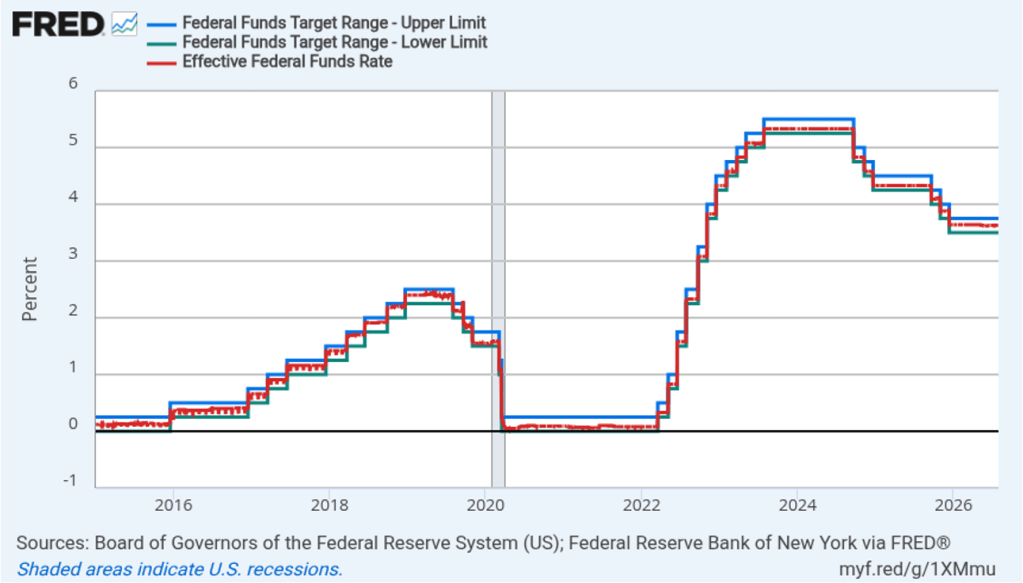
The FOMC has left its target for federal funds rate unchanged since lowering it by 25 basis points on December 10 of last year. The following figure shows for the period since January 2015, the upper bound (the blue line) and the lower bound (the green line) for the FOMC’s target range for the federal funds rate, as well as the actual values for the federal funds rate (the red line). Note that the Fed has been successful in keeping the value of the federal funds rate in its target range. (We discuss the monetary policy tools the FOMC uses to maintain the federal funds rate within its target range in Macroeconomics, Chapter 15, Section 15.2 (Economics, Chapter 25, Section 25.2).)

As with the policy statement issued following Fed Chair Kevin Warsh’s first FOMC meeting in June, today’s policy statement was short and did not include any discussion of the circumstances under which policy might change in the future—so-called forward guidance. We discuss forward guidance in Macroeconomics, Chapter 15 (Economics, Chapter 25).

In his press conference following the meeting, Warsh expanded on his approach to monetary policy, highlighting differences with previous Fed chairs. He noted that he believed that FOMC policy statements should present “just the facts,” providing only a brief summary of current economic conditions and avoiding mention of future monetary policy apart from the assertion—which also closed the policy statement following the June meeting—that “The Committee will deliver price stability.”

He stressed that the committee was in the process of reassessing its approach to monetary policy. The reassessment will rely in part on the findings of the five committees he has formed, although he noted that the FOMC would not feel bound by the recommendations of the five committees. He emphasized that the committee would focus more on trends in economic data and wouldn’t be “holding our breath” waiting for any particular data release. In reply to questions from reporters, he noted that despite the committee leaving its target for the federal funds rate unchanged, there hadn’t been a “pause” in policy because the committee had continued its “rigorous review of big, hard questions.”

Warsh noted that by avoiding forward guidance, the committee wasn’t attempting to surprise financial markets when at some point it announces a policy change. Instead, he argued that prices in financial markets would now better reflect the opinions of market participants, which will provide the committee with useful information.

On two issues, Warsh noted continuity with committee procedures under previous Fed chairs. First, at his June press conference, Warsh had indicated that he would only hold press conferences after FOMC meetings if there was new information to convey. Today, he stated that, through at least the end of the year, he would continue the recent tradition of holding a press conference after each FOMC meeting. Second, when asked about his statements that new measures of inflation were needed, Warsh indicated that, at least through the end of the year, the committee would continue to measure progress toward its 2 percent annual inflation goal using the inflation rate as measured by the personal consumption expenditures (PCE) price index.

Finally, this afternoon, investors in the federal funds rate futures market assigned a 63.4 percent probability to the committee increasing its target range by 25 basis points at its next meeting on September 15–16, a decrease from 76.0 percent yesterday.

New BEA Releases Show Faster Growth and Higher Inflation

Image created by ChatGPT

The Bureau of Economic Analysis (BEA) released two reports this morning (June 25): “GDP (Third Estimate), Industries, Corporate Profits, State GDP, and State Personal Income, 1st Quarter 2026” and “Personal Income and Outlays, May 2026.” The BEA revised upward its estimate of real GDP growth in the first quarter of 2026 from an annual rate of 1.6 percent to an annual rate of 2.1 percent. Economists surveyed by LSEG had expected that the BEA would leave its estimate of real GDP growth in the first quarter unchanged. The following figure shows the BEA’s estimated rates of real GDP growth in each quarter beginning with the first quarter of 2022.

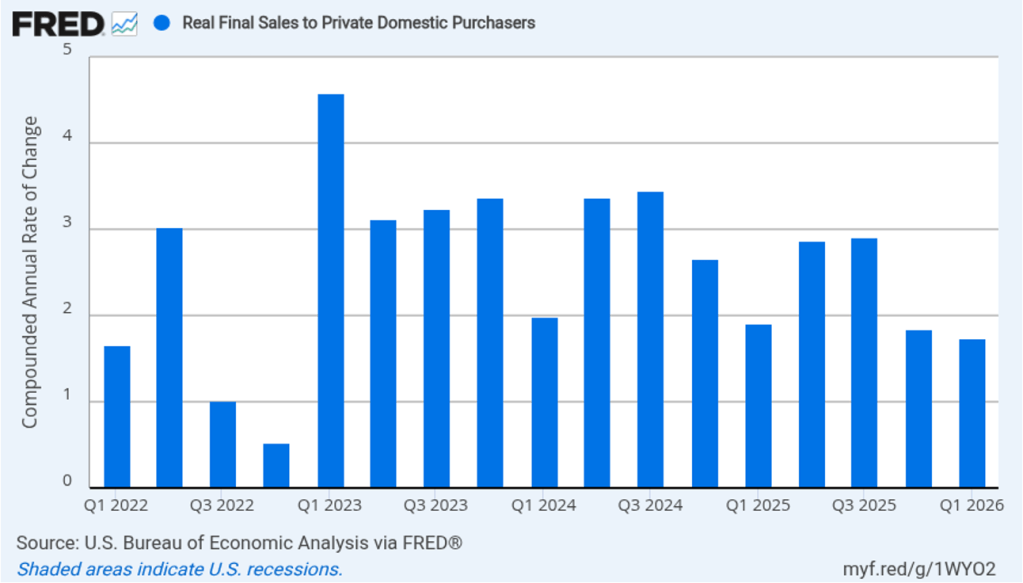
As we’ve discussed in previous blog posts, to better gauge the state of the economy, policymakers—including former Fed Chair Jerome Powell—often prefer to strip out the effects of imports, inventory investment, and government expenditures—which can be volatile—by looking at real final sales to private domestic purchasers, which includes only spending by U.S. households and firms on domestic production. As the following figure shows, real final sales to domestic purchasers increased at an annual rate of 1.7 percent in the first quarter, below the 2.1 percent rate of increase in real GDP and close to the U.S. economy’s expected long-run annual real growth rate of 1.8 percent. Note also that real final sales to private domestic purchasers grew by 2.9 percent in the third quarter of 2025, during which real GDP grew by 4.4 percent, and by 1.9 percent in the first quarter of 2025, when real GDP declined by 0.6 percent. So this measure of output is more stable, and likely is a better indicator of the underlying growth rate in the economy, than is the growth rate of real GDP.


The BEA’s “Personal Income and Outlays” report this morning included monthly data on the personal consumption expenditures (PCE) price index. The Fed relies on annual changes in the PCE price index to evaluate whether it’s meeting its 2 percent annual inflation target. (Fed Chair Kevin Warsh has indicated that in the future he may want the Fed to focus on a different measure of inflation.)

The following figure shows headline PCE inflation (the blue line) and core PCE inflation (the red line)—which excludes energy and food prices—for the period since January 2019, with inflation measured as the percentage change in the PCE from the same month in the previous year. In May, headline PCE inflation was 4.1 percent, up from 3.8 percent in April, and the highest rate since April 2023. Core PCE inflation in May was 3.4 percent, up slightly from 3.3 percent in April. Headline PCE inflation was equal to the forecasts of economists surveyed by FactSet, while core PCE inflation was slightly higher. Both headline PCE inflation and core PCE inflation remain well above the Fed’s 2 percent annual inflation target.

The following figure shows monthly PCE inflation and monthly core PCE inflation calculated by compounding the current month’s rate over an entire year. (Often referred to as 1-month inflation.) Measured this way, headline PCE inflation increased from 5.0 percent in April to 5.5 percent in May. Core PCE inflation rose from 3.0 in April to 3.9 percent in May. Even leaving aside the effect of rising gasoline prices on headline PCE, these data show that in May both core and headline PCE inflation were well above the Fed’s target.


Former Fed Chair Jerome Powell frequently mentioned that inflation in non-market services can skew PCE inflation. Non-market services are services whose prices the BEA imputes rather than measures directly. For instance, the BEA assumes that prices of financial services—such as brokerage fees—vary with the prices of financial assets. So that if stock prices rise, the prices of financial services included in the PCE price index also rise. Powell has argued that these imputed prices “don’t really tell us much about … tightness in the economy. They don’t really reflect that.” The following figure shows 12-month headline inflation (the blue line) and 12-month core inflation (the red line) for market-based PCE. (The BEA explains the market-based PCE measure here.)

Headline market-based PCE inflation was 3.9 percent in May, up from 3.7 percent in April. Core market-based PCE inflation was 3.2 percent in May, up slightly from 3.1 percent in April. So, both market-based measures, although lower than the full PCE measures, show inflation in May remaining well above the Fed’s 2 percent target.

New Fed Chair Kevin Warsh argued in testimony before the Senate that the Fed should stop relying on headline PCE inflation: “The measures [of inflation] I prefer are looking at things that are called trimmed averages. We take out all of the tail-risks, all of the one-off items, and we ask ourselves whether the generalized change in prices is having second-order effects on the economy.” 

Trimmed-mean PCE inflation drops the 31 percent of goods and services with the highest inflation rates and the 24 percent of goods and services with the lowest inflation rates. A closely related measure, median PCE inflation, is calculated by listing the inflation rate in each individual good or service included in the PCE and identifying the inflation rate of the good or service that is in the middle of the list—that is, the inflation rate in the price of the good or service that has an equal number of higher and lower inflation rates. 

The following figure shows headline PCE inflation the (blue line), core PCE inflation (the red line) and trimmed-mean PCE inflation (the brown line). Trimmed-mean PCE inflation in May was 2.4 percent, well below both headline and core PCE inflation.

The following figure from the web site of the Federal Reserve Bank of Cleveland shows headline PCE inflation (the green line), core PCE inflation (the blue line), and median PCE inflation (the brown line). In May, median PCE inflation was 2.8 percent, also below both headline and core inflation. So Warsh has a point that these two measures of inflation, which are less affected by particularly high or low rates of inflation in some goods and services, indicate that inflation has been running below the Fed’s currently preferred measure. But these measures also show inflation still running well above the Fed’s 2 percent annual inflation target.

Today’s macro data have had little effect on investors who buy and sell federal funds futures contracts. These investors still expect that the Federal Open Market Committee (FOMC) will leave its target for the federal funds rate unchanged at its meeting on July 28–29 but will raise the target by 0.25 percentage point at its September 15–16 meeting.

FOMC Holds Target Rate Constant as Warsh Promises Procedural Changes after First Meeting as Chair

Photo of Kevin Warsh from bloomberg.com via the Wall Street Journal

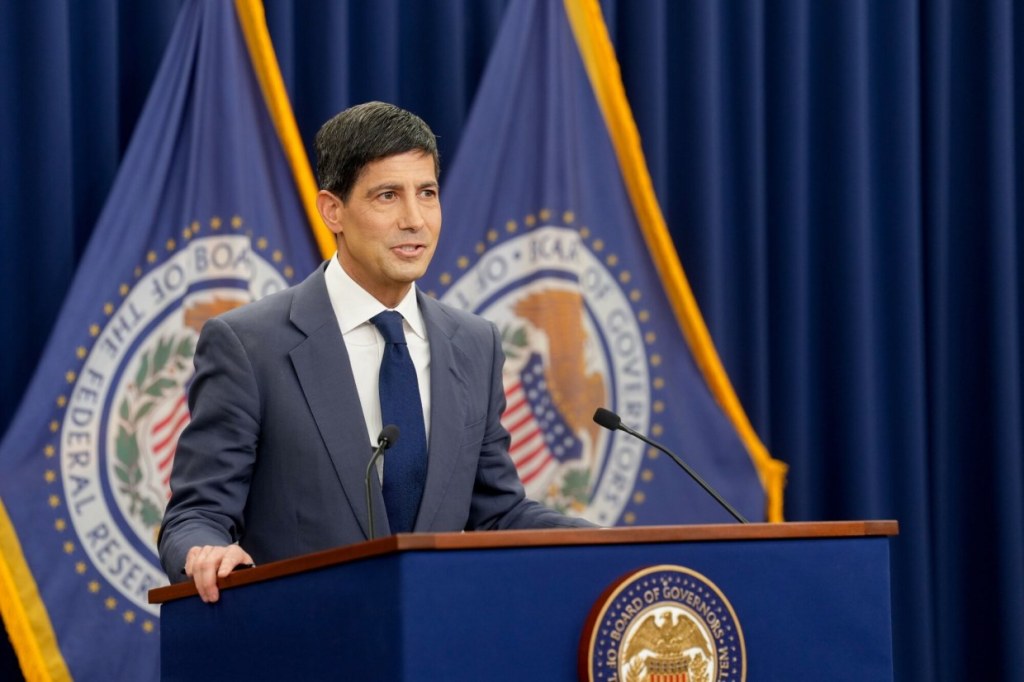
It was a foregone conclusion that at its meeting that ended today, the Federal Open Market Committee (FOMC) would leave unchanged its target range for the federal funds rate at 3.50 percent to 3.75 percent. There was great interest, however, about whether at his first meeting as chair of the committee, Kevin Warsh might indicate changes he would push for in the committee’s procedures.

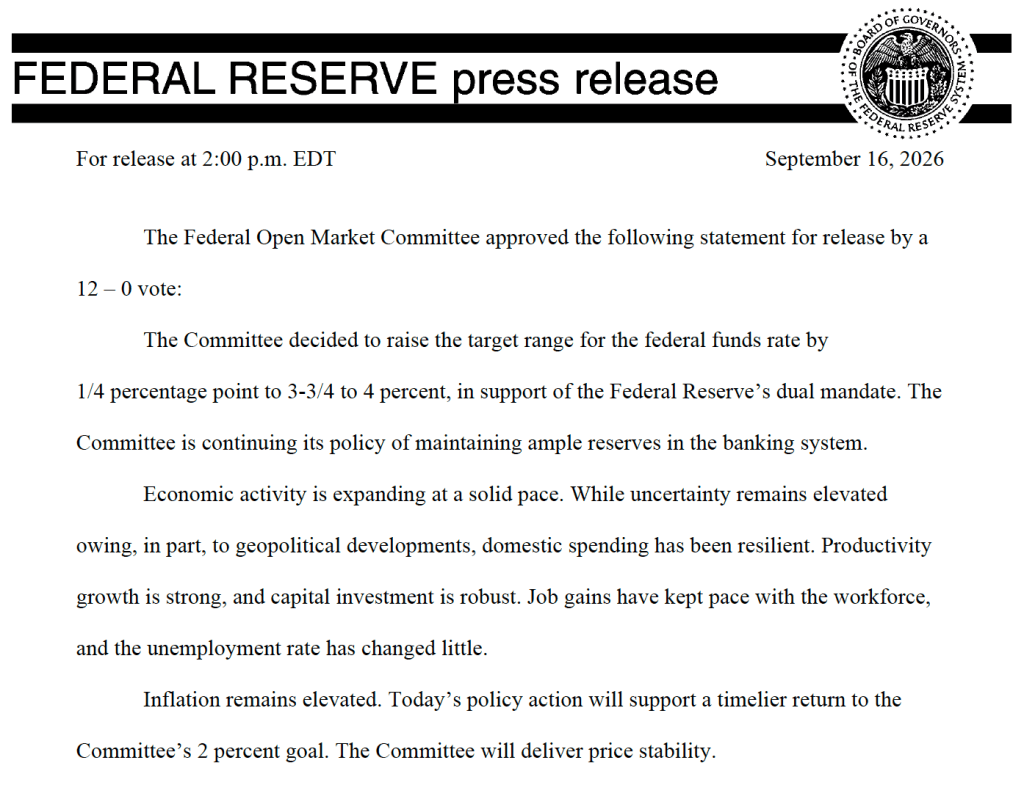
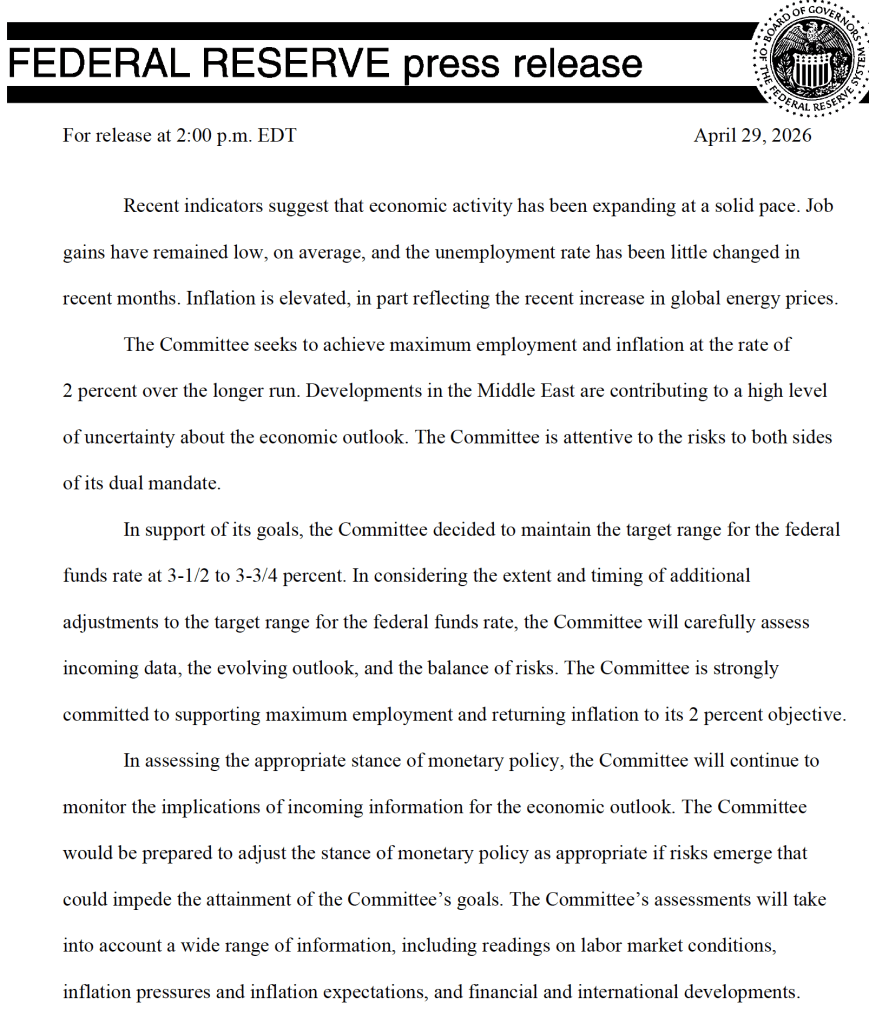
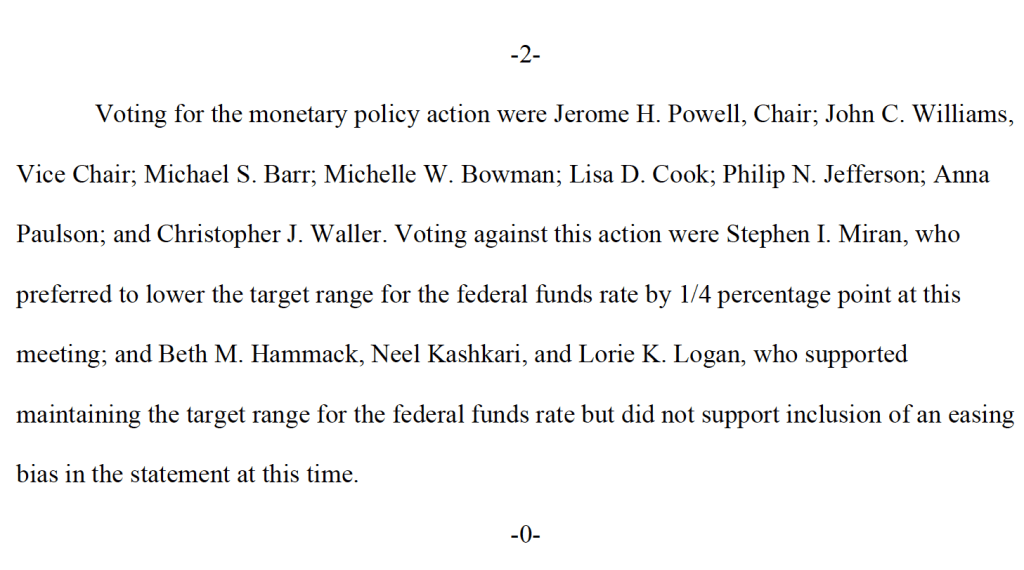
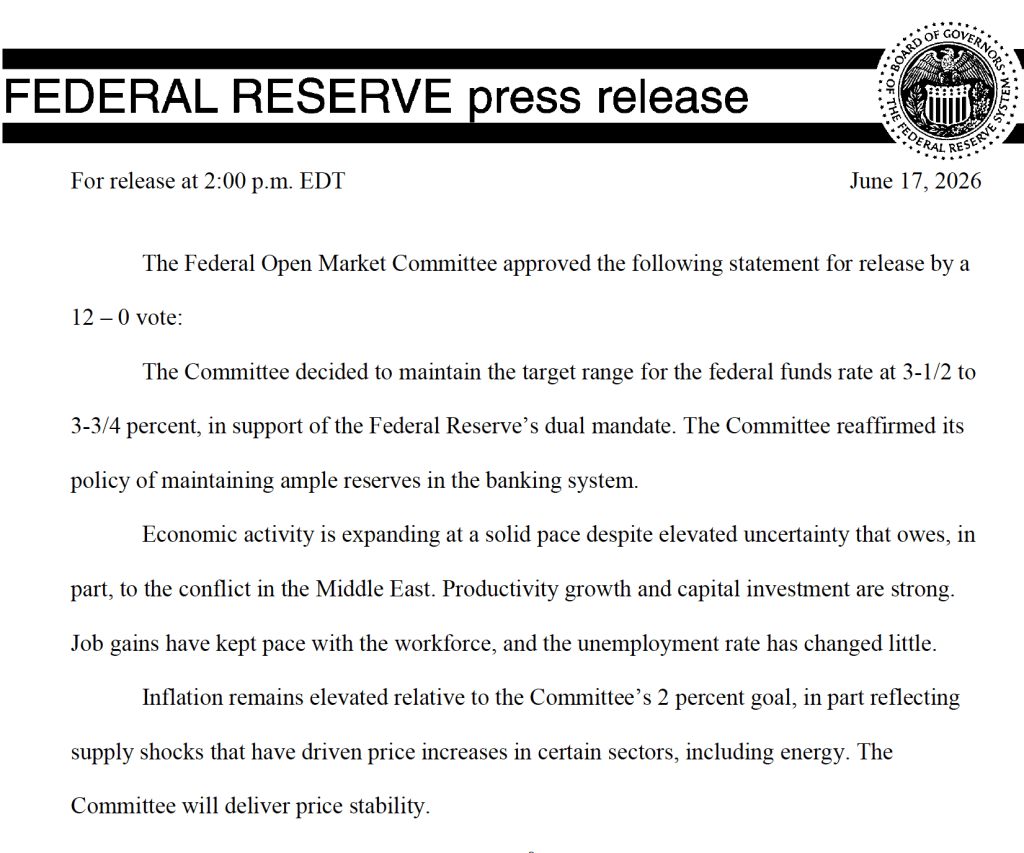
One immediate change was evident in the statement that the committee released at the end of its meeting. The first statement reproduced below is from April 29, the last meeting Jerome Powell presided over as chair. The second statement is the statement that the committee released today.

The statement released today is much shorter and omits any mention of how the committee might respond in the future to new economic data, other than the simple statement that, “The Committee will deliver price stability.”

The brevity of the statement reflects the skepticism Warsh had voiced in his Senate confirmation hearings on the usefulness of forward guidance, or statements by the FOMC about how it will conduct monetary policy in the future. We discuss forward guidance in Macroeconomics, Chapter 15 (Economics, Chapter 25).

In his press conference following the meeting, Warsh announced that he was forming five new committees to look at: 1) Fed communications, 2) the Fed’s balance sheet, 3) the Fed’s use of data, 4) the effects of technological change and productivity, particularly with respect to artificial intelligence, and 5) the inflation process, with the aim of identifying key drivers of inflation. He indicated that the committees would include members from outside the Fed and were expected to report their findings by the end of the year.

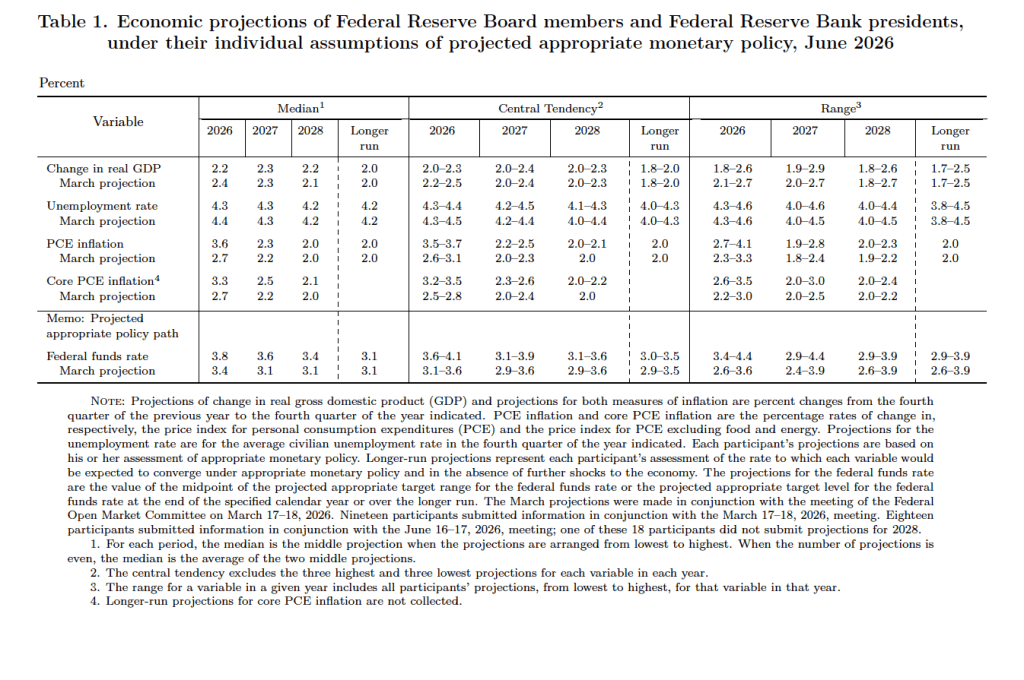
After the meeting, the committee also released a “Summary of Economic Projections” (SEP)—as it typically does after its March, June, September, and December meetings. The SEP presents median values of the, typically, 19 committee members’ forecasts of key economic variables. Notably, Warsh indicated that, although he encouraged his colleagues on the committee to continue submitting their forecasts to be compiled in the SEP, he didn’t submit forecasts. He indicated that the future of the SEP is one of the issues to be considered by his new committee on Fed communications.

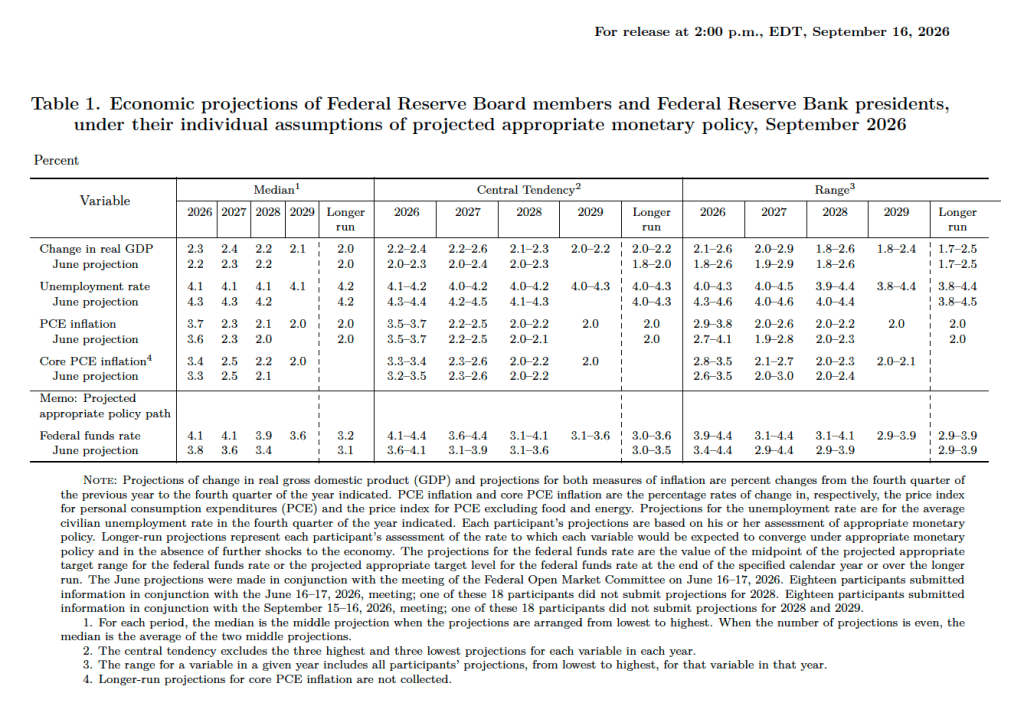
The forecasts of key economic variables from the SEP are summarized in the following table, reproduced from the release. (Note that only 5 of the district bank presidents vote at FOMC meetings, although all 12 presidents participate in the discussions and prepare forecasts for the SEP.)

There are several aspects of these forecasts worth noting:

  1. Compared with the previous SEP in March, the committee members reduced their forecast of real GDP growth in 2026 from 2.4 percent to 2.2 percent. The committee members left unchanged their forecast of long-run growth in real GDP at 2.0 percent. Despite reducing their forecast of real GDP growth in 2026, the committee lowered their forecast of the unemployment rate in 2026 from 4.4 percent to 4.3 percent. The committee members left their forecast of the long-run rate of unemployment, often called the natural rate of unemployment, unchanged at 4.2 percent. 
  2. Committee members significantly raised their forecast of personal consumption expenditures (PCE) price inflation in 2026 to 3.6 percent from 2.7 percent in March. They raised their forecast of inflation in 2027 slightly and continued to forecast that PCE inflation will decline to the Fed’s 2.0 percent annual target in 2028.
  3. The committee’s forecasts of the federal funds rate at the end of each year from 2026 through 2028 were increased, indicating that the committee sees the federal funds rate as likely to be “higher for longer.” The forecast for the long-run federal funds rate was left unchanged at 3.1 percent.

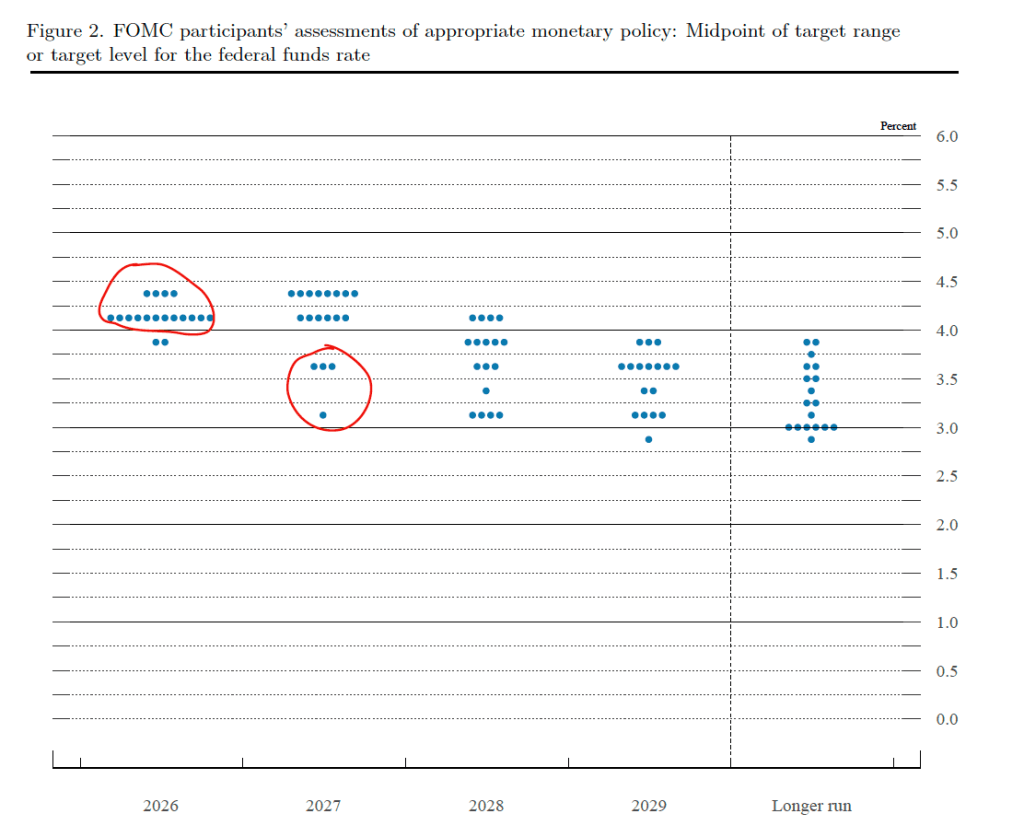
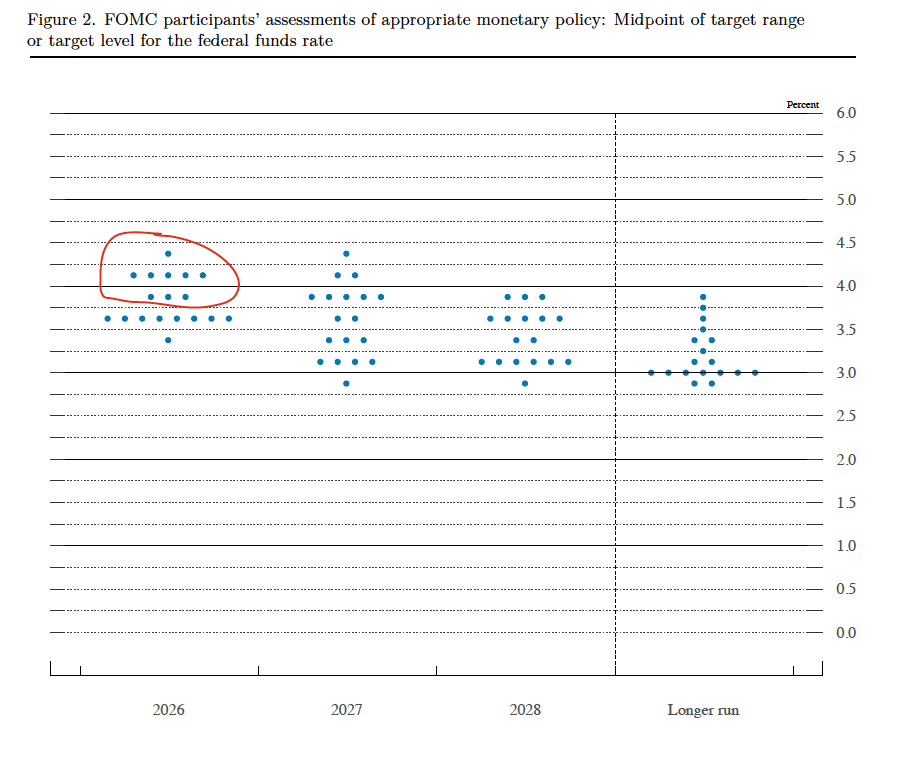
Prior to the meeting, there was much discussion in the business press and among investment analysts about the dot plot, shown below. Each dot in the plot represents the projection of an individual committee member. (The committee doesn’t disclose which member is associated with which dot.) Note that there are 18 dots, representing the 6 members of the Fed’s Board of Governors who provided forecasts and all 12 presidents of the Fed’s district banks. 

The dots plotted on the far left of the figure represent the projections by the 18 members of the value of the federal funds rate at the end of 2026. The plots indicate that at this point eight members of the committee forecast no change in the federal funds rate this year, nine members (circled in red) expect at least one increase in the federal funds rate by the end of the year, and only one member expected that there would be a cut in the federal funds by year’s end. The dots plotted on the far right of the figure indicate that there is substantial disagreement among committee members as to what the long-run value of the federal funds rate—the so-called neutral rate—should be. Of course, the plots only represent the forecasts of the committee members and individual committee members are likely to adjust their forecasts as additional macroeconomic data become available in the coming months.

Warsh indicated at his press conference that it was unlikely that he would hold a press conference after each meeting of the committee as Jerome Powell had been doing beginning with the January 2019 meeting.

Warsh made several other notable points at the press conference. He reiterated that the Fed’s inflation target would remain an annual increase of 2.0 percent in the PCE. He noted that he saw the current level of the federal funds rate as having a restrictive effect on only the housing market. And he expressed dissatisfaction with how the economic statistics the FOMC relies upon when setting policy were being compiled. He indicated that the new committee on the Fed’s use of data might formulate suggestions to other federal government agencies, such as the Bureau of Economic Analysis and the Bureau of Labor Statistics, on changes in how they collect data.

New BEA Releases Show Slower Growth and High Inflation

Image created by ChatGPT

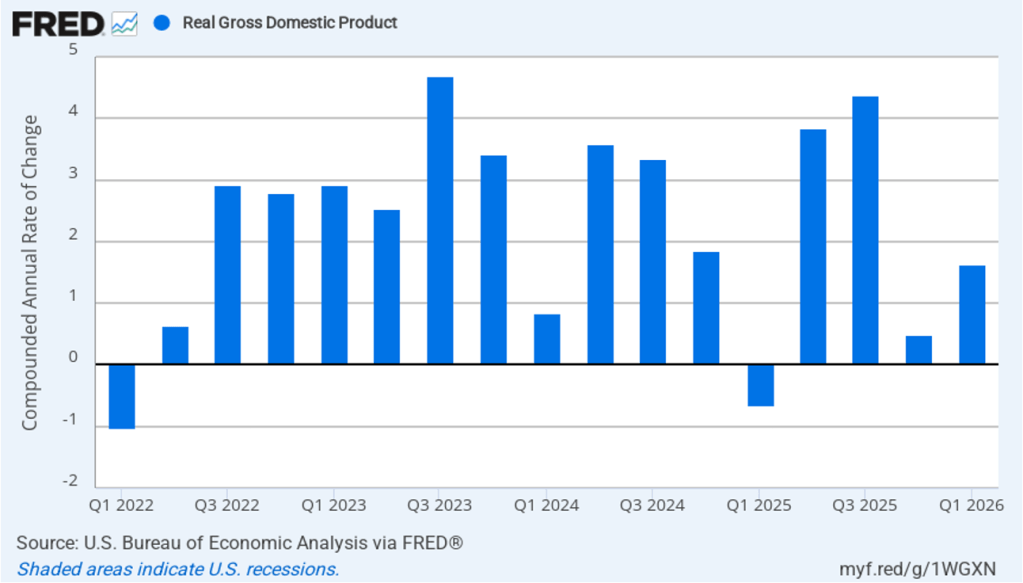
The Bureau of Economic Analysis (BEA) released two reports this morning (May 28): “GDP (Second Estimate) and Corporate Profits, 1st Quarter 2026” and “Personal Income and Outlays, April 2026.” The BEA revised downward its estimate of real GDP growth in the first quarter of 2026 from an annual rate of 2.0 percent to an annual rate of 1.6 percent. Economists surveyed by the Wall Street Journal had expected that the BEA would leave its estimate of real GDP growth in the first quarter unchanged. The following figure shows the BEA’s estimated rates of GDP growth in each quarter beginning with the first quarter of 2022.

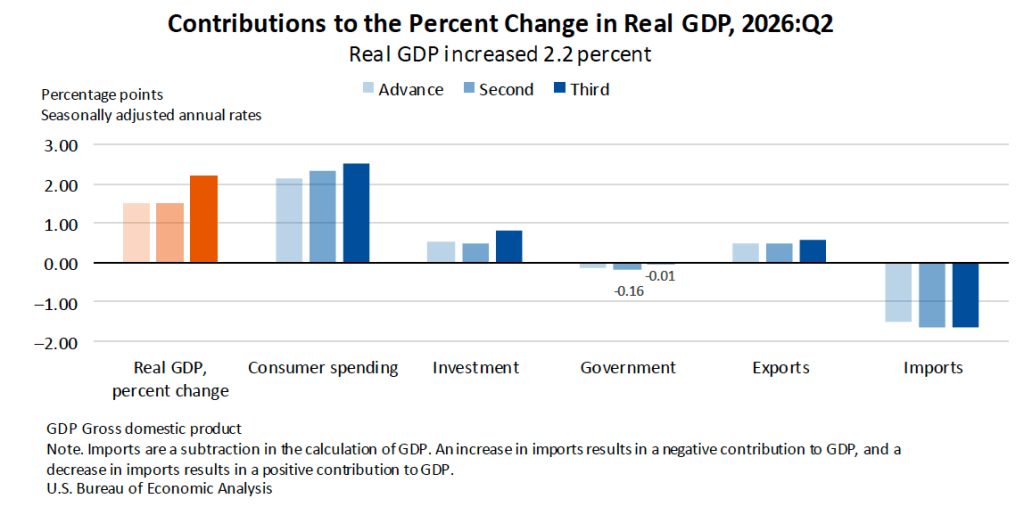
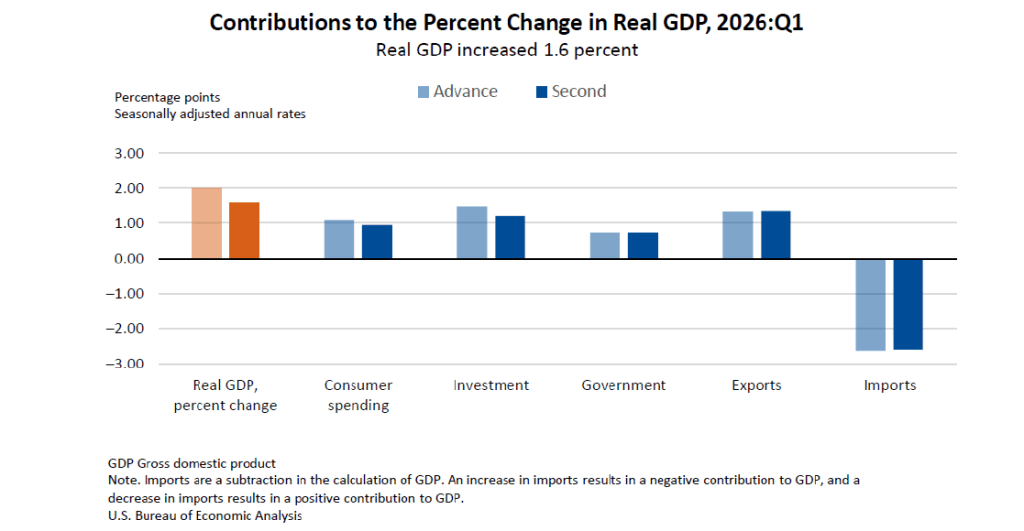
The following figure—taken from the BEA report—shows the contributions of each component of spending to the BEA’s downward revision of its estimate of GDP growth. The growth of both consumption spending and investment spending, which are the largest component of GDP, were revised downward. The downward revision in consumption spending reflects lower spending on services and the downward revision in investment spending reflects lower business spending on inventories.

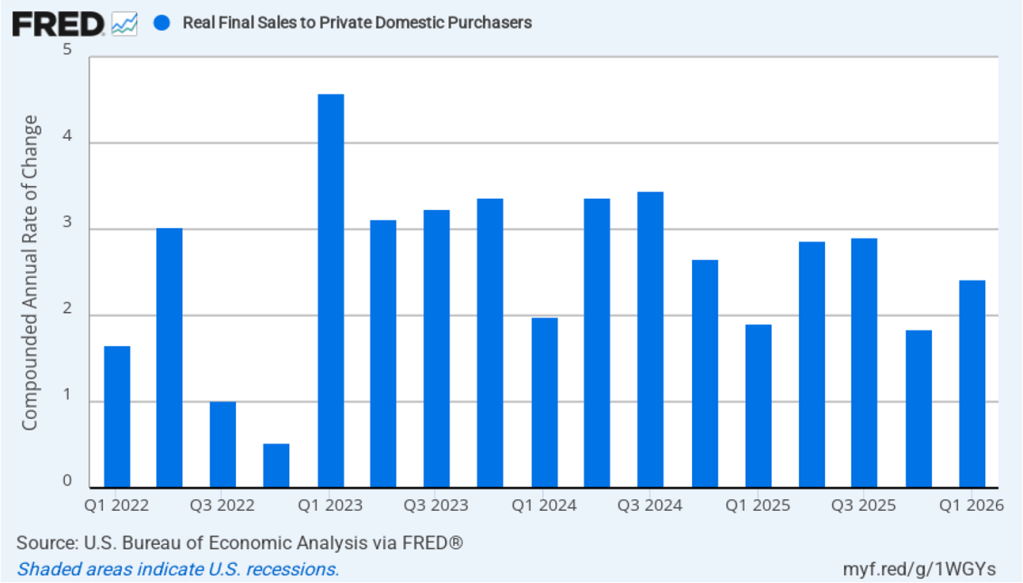
As we’ve discussed in previous blog posts, to better gauge the state of the economy, policymakers—including former Fed Chair Jerome Powell—often prefer to strip out the effects of imports, inventory investment, and government expenditures—which can be volatile—by looking at real final sales to private domestic purchasers, which includes only spending by U.S. households and firms on domestic production. As the following figure shows, real final sales to domestic purchasers increased at an annual rate of 2.4 percent in the first quarter, which was well above the 1.6 percent rate of increase in real GDP and also above the U.S. economy’s expected long-run annual real growth rate of 1.8 percent. Note also that real final sales to private domestic purchasers grew by 2.9 percent in the third quarter of 2025, during which real GDP grew by 4.4 percent, and by 1.9 percent in the first quarter of 2025, when real GDP declined by 0.6 percent. So this measure of output is more stable and likely is a better indicator of the underlying growth rate in the economy than is the growth rate of real GDP.

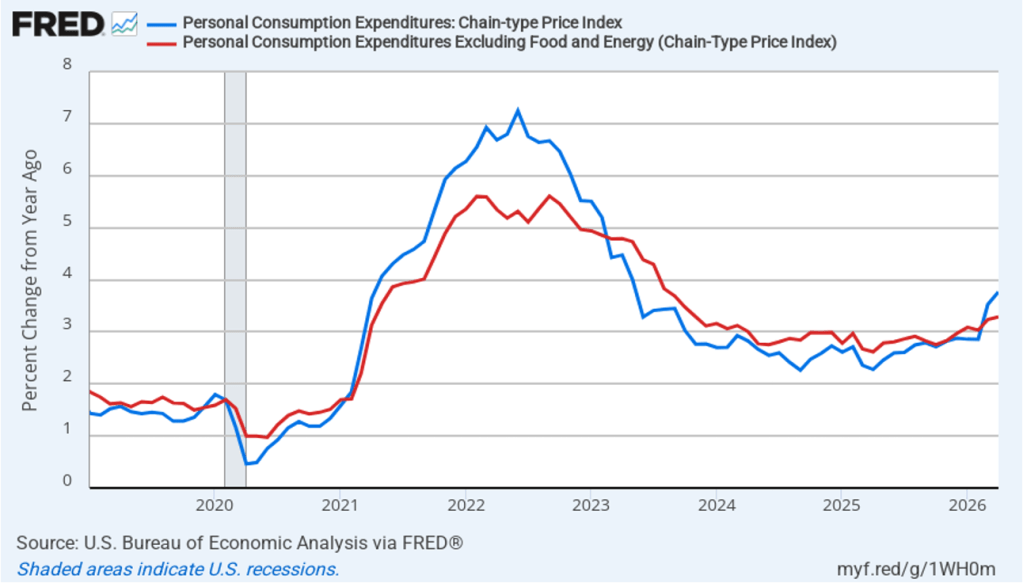
The BEA’s “Personal Income and Outlays” report this morning included monthly data on the personal consumption expenditures (PCE) price index. The Fed relies on annual changes in the PCE price index to evaluate whether it’s meeting its 2 percent annual inflation target. The following figure shows headline PCE inflation (the blue line) and core PCE inflation (the red line)—which excludes energy and food prices—for the period since January 2019, with inflation measured as the percentage change in the PCE from the same month in the previous year. In April, headline PCE inflation was 3.8 percent, up from 3.5 percent in March. Core PCE inflation in April was 3.3 percent, up slightly from 3.2 percent in March. Headline PCE inflation was slightly below and core PCE inflation was equal to the forecasts of economists surveyed by FactSet. Both headline PCE inflation and core PCE inflation remain well above the Fed’s 2 percent annual inflation target.

The following figure shows monthly PCE inflation and monthly core PCE inflation calculated by compounding the current month’s rate over an entire year. (Often referred to as 1-month inflation.) Measured this way, headline PCE inflation fell from the very high rate of 8.9 percent in March to a still high rate of 4.9 percent in April. Core PCE inflation declined from 3.6 in March to 2.9 percent in April. Even leaving aside the effect of rising gasoline prices on headline PCE, these data show that in March both core and headline PCE inflation were well above the Fed’s target.

Former Fed Chair Jerome Powell frequently mentioned that inflation in non-market services can skew PCE inflation. Non-market services are services whose prices the BEA imputes rather than measures directly. For instance, the BEA assumes that prices of financial services—such as brokerage fees—vary with the prices of financial assets. So that if stock prices rise, the prices of financial services included in the PCE price index also rise. Powell has argued that these imputed prices “don’t really tell us much about … tightness in the economy. They don’t really reflect that.” The following figure shows 12-month headline inflation (the blue line) and 12-month core inflation (the red line) for market-based PCE. (The BEA explains the market-based PCE measure here.)

Headline market-based PCE inflation was 3.7 percent in April, up from 3.4 percent in March. Core market-based PCE inflation was 3.1 percent in April, unchanged from March. So, both market-based measures, although lower than the full PCE measures, show inflation in April remaining well above the Fed’s 2 percent target.

New Fed Chair Kevin Warsh argued in testimony before the Senate that the Fed should stop relying on headline PCE inflation: “The measures [of inflation] I prefer are looking at things that are called trimmed averages. We take out all of the tail-risks, all of the one-off items, and we ask ourselves whether the generalized change in prices is having second-order effects on the economy.”

Trimmed-mean PCE inflation drops the 31 percent of goods and services with the highest inflation rates and the 24 percent of goods and services with the lowest inflation rates. A closely related measure, median PCE inflation, is calculated by listing the inflation rate in each individual good or service included in the PCE and identifying the inflation rate of the good or service that is in the middle of the list—that is, the inflation rate in the price of the good or service that has an equal number of higher and lower inflation rates. 

The following figure shows headline PCE inflation the (blue line), core PCE inflation (the brown line) and trimmed-mean PCE inflation (the red line). Trimmed-mean PCE inflation in April was 2.4 percent, well below both headline and core PCE inflation.

The following figure from the web site of the Federal Reserve Bank of Cleveland shows headline PCE inflation (the green line), core PCE inflation (the blue line), and median PCE inflation (the brown line). In April, median PCE inflation was 2.8 percent, also below both headline and core inflation. So Warsh has a point that these two measures of inflation, which are less affected by particularly high or low rates of inflation in some goods and services, indicate that inflation has been running below the Fed’s currently preferred measure. But these measures also show inflation running well above the Fed’s 2 percent annual inflation target.

Today’s macro data have had little effect on investors who buy and sell federal funds futures contracts. For some time, investors have seen little likelihood that the Fed’s policymaking Federal Open Market Committee would cut its target for the federal funds rate until sometime next year. These investors see it as far more likely that the committee will raise its target by the end of the year than that it will cut it.

Two Releases from the BEA this Morning Show Steady GDP Growth and Rising Inflation

Image created by ChatGPT of the Department of Commerce building in Washington, DC

The Bureau of Economic Analysis (BEA) released two reports this morning: “GDP (Advance Estimate), 1st Quarter 2026” and “Personal Income and Outlays, March 2026.” The BEA estimates that real GDP grew at annual rate of 2.0 percent in the first quarter of 2026. That rate was up sharply from 0.5 percent in the fourth quarter of 2025, but below the 2.2 percent rate economists surveyed by the Wall Street Journal had forecast. The following figure shows the BEA’s estimated rates of GDP growth in each quarter beginning with the first quarter of 2022.


As the following figure—taken from the BEA report—shows, investment spending made the largest contribution to the growth of real GDP in the first quarter, with consumption spending growing at a slower rate than during the previous three quarters. Spending on imports grew significantly more than did spending on exports, resulting in net exports reducing real GDP growth by 1.3 percentage points.

As we’ve discussed in previous blog posts, to better gauge the state of the economy, policymakers—including Fed Chair Jerome Powell—often prefer to strip out the effects of imports, inventory investment, and government expenditures—which can be volatile—by looking at real final sales to private domestic purchasers, which includes only spending by U.S. households and firms on domestic production. As the following figure shows, real final sales to domestic purchasers increased by 2.5 percent at an annual rate in the first quarter, which was well above the 2.0 percent increase in real GDP and also above the U.S. economy’s expected long-run annual real growth rate of 1.8 percent. Note also that real final sales to private domestic purchasers grew by 2.9 percent in the third quarter of 2025, during which real GDP grew by 4.4 percent, and by 1.9 percent in the first quarter of 2025, when real GDP declined by 0.6 percent. So this measure of output is more stable and likely is a better indicator of the underlying growth rate in the economy than is growth in real GDP.

The BEA’s “Personal Income and Outlays” report this morning included monthly data on the personal consumption expenditures (PCE) price index. The Fed relies on annual changes in the PCE price index to evaluate whether it’s meeting its 2 percent annual inflation target. The following figure shows headline PCE inflation (the blue line) and core PCE inflation (the red line)—which excludes energy and food prices—for the period since January 2019, with inflation measured as the percentage change in the PCE from the same month in the previous year. In March, headline PCE inflation was 3.4 percent, up from 2.7 percent in February. Core PCE inflation in March was 3.2 percent, up from 3.0 percent in February. Both headline PCE inflation and core PCE inflation remained well above the Fed’s 2 percent annual inflation target.

The following figure shows monthly PCE inflation and monthly core PCE inflation calculated by compounding the current month’s rate over an entire year. (Often referred to as 1-month inflation.) Measured this way, headline PCE inflation soared to 9.2 percent in March, up from to 4.9 percent in February. Core PCE inflation fell to 3.6 percent in March from 5.2 percent in February. Even leaving aside the effect of rising gasoline prices on headline PCE, these data show that in March both core and headline PCE inflation were far above the Fed’s target.

Fed Chair Jerome Powell has frequently mentioned that inflation in non-market services can skew PCE inflation. Non-market services are services whose prices the BEA imputes rather than measures directly. For instance, the BEA assumes that prices of financial services—such as brokerage fees—vary with the prices of financial assets. So that if stock prices rise, the prices of financial services included in the PCE price index also rise. Powell has argued that these imputed prices “don’t really tell us much about … tightness in the economy. They don’t really reflect that.” The following figure shows 12-month headline inflation (the blue line) and 12-month core inflation (the red line) for market-based PCE. (The BEA explains the market-based PCE measure here.)

Headline market-based PCE inflation was 3.4 percent in March, up from 2.9 percent in February. Core market-based PCE inflation was 3.1 percent in March, up from 2.9 percent in February. So, both market-based measures show inflation in March remaining well above the Fed’s 2 percent target.

Increases in rent have been one driver of inflation. The following figure shows the 12-month change in service prices, excluding energy and housing prices. Inflation in service prices measured this way was 3.5 percent in March. One-month inflation (not shown) was even higher at 4.6 percent.

However measured, inflation is clearly running well above the Fed’s 2 percent target. Incoming Fed Chair Kevin Warsh is walking into a difficult situation. He’s likely to come under pressure from President Trump to convince his colleagues on the Federal Open Market Committee to cut the target for the federal funds rate. But it seems unlikely that a majority of the committee would be willing to cut the target with inflation remaining well above 2 percent. As we mentioned in yesterday’s post, investors who buy and sell federal funds futures contracts don’t expect that the target rate will be lowered before the committee’s meeting on December 14–15 2027.

A Double Dose of Bad Inflation News

Image generated by ChatGPT

This morning, the Bureau of Labor Statistics (BLS) released its report on the consumer price index (CPI) for March. Yesterday,  the Bureau of Economic Analysis (BEA) released monthly data on the personal consumption expenditures (PCE) price index for February as part of its “Personal Income and Outlays” report.  Both reports showed that the inflation has worsened. Note that data for the PCE were collected before the beginning of the conflict with Iran.

CPI Inflation jumped to a level well above the Federal Reserve’s 2 percent annual inflation target. The following figure compares headline CPI inflation (the blue line) and core CPI inflation (the red line). Because of the effects of the federal government shutdown, the BLS didn’t report inflation rates for October or November, so both lines show gaps for those months.  

  • The headline inflation rate, which is measured by the percentage change in the CPI from the same month in the previous year, was 3.3 percent in March, up from 2.4 percent in February. 
  • The core inflation rate, which excludes the prices of food and energy, was 2.6 percent in March, up only slightly from 2.5 percent in February. 

Headline inflation was equal to the forecast of economists surveyed by the Wall Street Journal but well below the 3.7 percent rate forecast by economists surveyed by FactSet. Core inflation was slightly below the forecast of 2.7 percent in both surveys. Higher energy prices drove the jump in CPI inflation.

In the following figure, we look at the 1-month inflation rate for headline and core inflation—that is the annual inflation rate calculated by compounding the current month’s rate over an entire year. Calculated as the 1-month inflation rate, headline inflation (the blue line) was 10.9 percent in March, up from 3.2 percent in February. Core inflation (the red line) actually decreased to 2.4 in March from 2.6 percent in February.

The following figure emphasizes the role paid by energy prices in causing the jump in inflation. The blue line shows the 1-month inflation rate in all energy prices included in the CPI. The red line shows the 1-month inflation rate in gasoline prices—which was an astounding 907.4 percent.

Did the jump in energy prices pass through to increases in food prices, which are a key concern for many consumers? The following figure shows 1-month inflation in the CPI category “food at home” (the blue bar)—primarily food purchased at grocery stores—and the category “food away from home” (the red bar)—primarily food purchased at restaurants. Inflation in both measures fell in March, indicating that they hadn’t (yet?) been affected by rising energy prices. Food at home actually decreased by 1.9 percent in March after increasing by 5.4 percent in February. Food away from home increased 2.9 percent in March, down from 3.9 percent in February.

Turning now to PCE inflation for February. The following figure shows headline PCE inflation (the blue line) and core PCE inflation (the red line)—which excludes energy and food prices—with inflation measured as the percentage change in the PCE from the same month in the previous year. Headline PCE inflation was 2.8 percent in February, unchanged from January. Core PCE inflation was 3.0 percent in February, down slight from 3.1 percent in January . Headline inflation was slightly higher and core inflation was equal to the forecast of economists surveyed by FactSet.

The following figure shows 1-month headline PCE inflation and core PCE. Measured this way, headline PCE inflation increased from 3.7 percent in January to 4.6 percent in February. Core PCE inflation declined from 4.8 percent in January to 4.5 percent in February. So, even before the effects of the escalation in energy prices, both 1-month and 12-month PCE inflation are telling the same story of inflation above the Fed’s target—well above in the case of 1-month inflation. These numbers raise significant concern about whether inflation was making progress toward the Fed’s 2 percent target even before the effects of the rise in energy prices.

Fed Chair Jerome Powell has frequently mentioned that inflation in non-market services can skew PCE inflation. Non-market services are services whose prices the BEA imputes rather than measures directly. For instance, the BEA assumes that prices of financial services—such as brokerage fees—vary with the prices of financial assets. So that if stock prices rise, the prices of financial services included in the PCE price index also rise. Powell has argued that these imputed prices “don’t really tell us much about … tightness in the economy. They don’t really reflect that.” The following figure shows 12-month headline inflation (the blue line) and 12-month core inflation (the red line) for market-based PCE. (The BEA explains the market-based PCE measure here.)

Headline market-based PCE inflation was 2.7 percent in February, up slightly from 2.6 percent in January. Core market-based PCE inflation was 2.9 percent in February, up slightly from 2.8 percent in January. So, both market-based measures show inflation as stable but well above the Fed’s 2 percent target.

In the following figure, we look at 1-month inflation using these measures. One-month headline market-based inflation increased to 2.1 percent in November from 1.3 percent in October. One-month core market-based inflation fell to 1.3 percent in November from 2.0 percent in October. So, in November, 1-month market-based inflation was at or below the Fed’s annual inflation target. As the figure shows, the 1-month inflation rates are more volatile than the 12-month rates, which is why the Fed relies on the 12-month rates when gauging how close it is coming to hitting its target inflation rate.

What effect are these troubling inflation reports likely to have on the Fed’s policymaking Federal Open Market Committee (FOMC) at its next meeting on April 28–29—likely Jerome Powell’s last meeting as Fed chair? Economists generally recommend that central banks “look through”—that is, take no action—in response to a supply shock. A supply shock ordinarily results in a one-time increase in the price level, rather than a long-lasting increase in inflation. Fed policymakers, though, are aware that inflation has been running above their 2 percent target for more than five years. The possibility that even a temporary spike in inflation might result in a significant increase in the inflation rate that households and firms expect is a concern. At this point, investors in the federal funds futures market assign only a very small probability to the FOMC raising or lowering its target for the federal funds rate at the next several meetings. Following the next meeting, Powell will give his thoughts on these and other issues at a press conference.

FOMC Holds Its Target for the Federal Funds Rate Steady at Powell’s Next-to-Last Meeting

Photo from federalreserve.gov

Today’s meeting of the Federal Reserve’s policymaking Federal Open Market Committee (FOMC) had the expected result with the committee deciding to leave unchanged its target for the federal funds rate at its current range of 3.50 percent to 3.75 percent. The members of the committee voted 11 to in favor of the decision. Fed Governor Stephen Miran voted against the decision, preferring to lower the target range for the federal funds rate by 0.25 percentage point (25 basis points).

The following figure shows for the period since January 2010, the upper bound (the blue line) and the lower bound (the green line) for the FOMC’s target range for the federal funds rate, as well as the actual values for the federal funds rate (the red line). Note that the Fed has been successful in keeping the value of the federal funds rate in its target range. (We discuss the monetary policy tools the FOMC uses to maintain the federal funds rate within its target range in Macroeconomics, Chapter 15, Section 15.2 (Economics, Chapter 25, Section 25.2).)

After the meeting, the committee also released a “Summary of Economic Projections” (SEP)—as it typically does after its March, June, September, and December meetings. The SEP presents median values of the 19 committee members’ forecasts of key economic variables. The values are summarized in the following table, reproduced from the release. (Note that only 5 of the district bank presidents vote at FOMC meetings, although all 12 presidents participate in the discussions and prepare forecasts for the SEP.)

There are several aspects of these forecasts worth noting:

  1. Compared with December, the committee members increased their forecasts of real GDP growth for each year from 2025 through 2027. The committee members also increased their forecast of long-run growth in real GDP to 2.0 percent from 1.8 percent in December. Although that increase may seem small, as we discuss in Macroeconomics, Chapter 10, Section 10.1 (Economics, Chapter 20, Section 20.1), over time, small increases in growth rates in real GDP can result in substantial increases in the standard of living. Despite increasing their forecast of growth in real GDP, committee members left their forecasts of the unemployment rate unchanged. 
  2. Committee members reduced their forecast for 2026 of personal consumption expenditures (PCE) price inflation significantly to 2.7 percent from 2.4 percent in December. They raised their forecast for inflation in 2027 slightly and continued to forecast that PCE inflation will decline to the Fed’s 2.0 percent annual target in 2028.
  3. The committee’s forecasts of the federal funds rate at the end of each year from 2026 through 2028 were unchanged but the forecast for the long-run federal funds rate was increased to 3.1 percent from 3.0 percent in December.
Prior to the meeting there was much discussion in the business press and among investment analysts about the dot plot, shown below. Each dot in the plot represents the projection of an individual committee member. (The committee doesn’t disclose which member is associated with which dot.) Note that there are 19 dots, representing the 7 members of the Fed’s Board of Governors and all 12 presidents of the Fed’s district banks. 

The plots on the far left of the figure represent the projections by the 19 members of the value of the federal funds rate at the end of 2026. The plots indicate that at this point there is majority support on the committee for one 25 basis point cut by the end of the year in the federal funds rate from its current range of 3.50 percent to 3.25 percent to a range of 3.25 percent to 3.00 percent. The plots on the far right of the figure indicate that there is substantial disagreement among committee members as to what the long-run value of the federal funds rate—the so-called neutral rate—should be. Of course, the plots only represent the forecasts of the committee members and individual committee members are likely to adjust their forecasts as additional macroeconomic data become available in the coming months.

During his press conference following the meeting, Powell indicated that the effects of the conflict in Iran on the U.S. economy were uncertain. He noted that traditionally central banks “look through” increases in oil prices because they result in only a one-time increase in the price level rather than in sustained inflation. He noted, though, that the committee might take steps to offset the effect of higher oil prices if there were an indication that the price increases were affecting long-run expectations of inflation.

He noted that the increase in inflation in recent months was largely due to the effects of the increase in tariffs on goods prices. Powell indicated that committee members expect that the tariff increases will have largely passed through the economy by the middle of the year. Powell attributed committee members increasing their forecast of long-run growth in real GDP to their expectation that recent increases in productivity growth would be sustained.

Finally, Powell discussed the end of his term as chair on May 15. (Powell will be chair for one more meeting of the FOMC on April 28–29.) He stated that if the Senate doesn’t confirm Kevin Warsh as his replacement as chair by May 15, he would follow the law and Fed tradition by continuing to serve as chair in a temporary capacity. Powell’s term as a member of the Board of Governors doesn’t end until January 31, 2028. He indicated that he will only step down from his position on the Board if the legal case the Department of Justice has opened against him for having given allegedly false testimony to Congress is “well and truly over, with transparency and finality.”