

Image created by ChatGPT
This morning (September 4), the Bureau of Labor Statistics (BLS) released its “Employment Situation” report (often called the “jobs report”) for August. The report showed an unexpectedly large increase in employment.
The jobs report has two estimates of the change in employment during the month: one estimate from the establishment survey, often referred to as the payroll survey, and one from the household survey. As we discuss in Macroeconomics, Chapter 9, Section 9.1 (Economics, Chapter 19, Section 19.1), many economists and Federal Reserve policymakers believe that employment data from the establishment survey provide a more accurate indicator of the state of the labor market than do the household survey’s employment and unemployment data. (The groups included in the employment estimates from the two surveys are somewhat different, as we discuss in this post.)
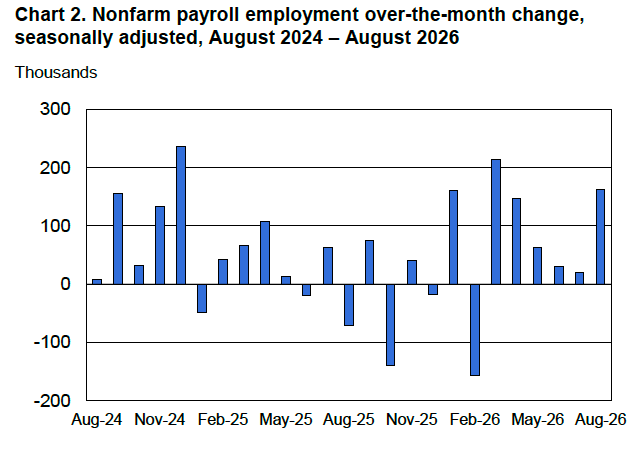
According to the establishment survey, there was a net increase of 162,000 nonfarm jobs during August. Economists surveyed by the Wall Street Journal had forecast an increase of only 55,000 jobs. Economists surveyed by FactSet had forecast a net increase of 65,000 jobs. The BLS revised upward its previous estimates of employment in June and July by a combined 55,000 jobs. The estimate of the net employment change in July was revised from a decrease of 23,000 to an increase of 21,000. (The BLS notes that: “Monthly revisions result from additional reports received from businesses and government agencies since the last published estimates and from the recalculation of seasonal factors.”)
The following figure from the jobs report shows the net change in nonfarm payroll employment for each month in the last two years. The figure shows that since peaking in March with a net increase of 214,000 jobs, job growth slowed markedly over the following four months until strongly rebounding in August. In 2026, monthly net employment growth has averaged 80,375. That is much higher than the 2025 average monthly employment growth of only 9,667, but well below the 2024 average monthly employment growth of 121,583.
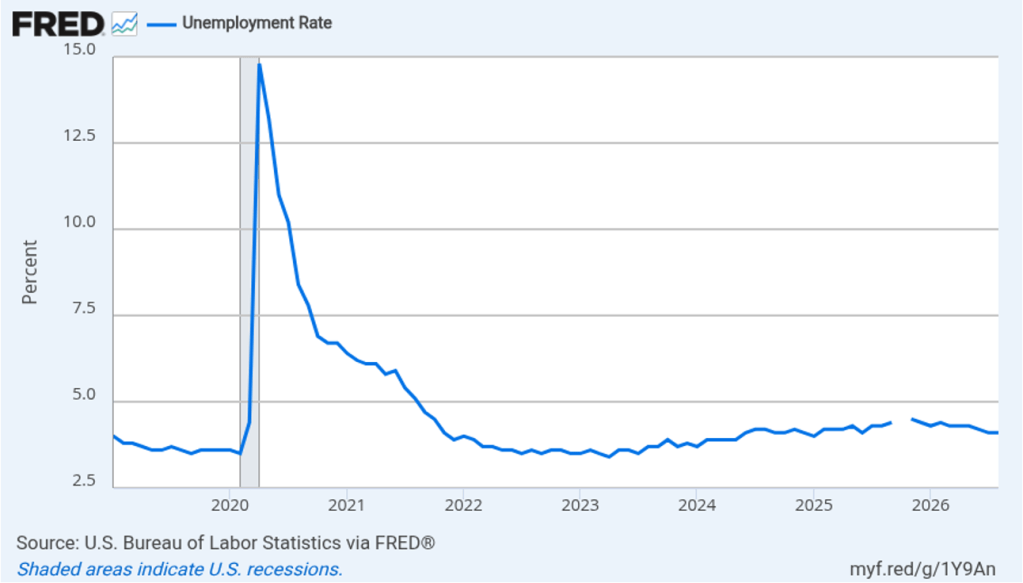
The unemployment rate, which is calculated from data in the household survey, was 4.1 percent, unchanged from July. The estimated size of the labor force, the number of workers employed, and the number of workers unemployed all increased in August. The following figure shows that the unemployment rate has been remarkably stable over the past year and a half, staying between 4.0 percent and 4.4 percent in each month since June 2024. The Federal Open Market Committee’s most recent estimate of the natural rate of unemployment—the normal rate of unemployment over the long run—is 4.2 percent. So, currently the unemployment rate is slightly below that estimate of the natural rate. (We discuss the natural rate of unemployment in Macroeconomics, Chapter 9 and Economics, Chapter 19.)
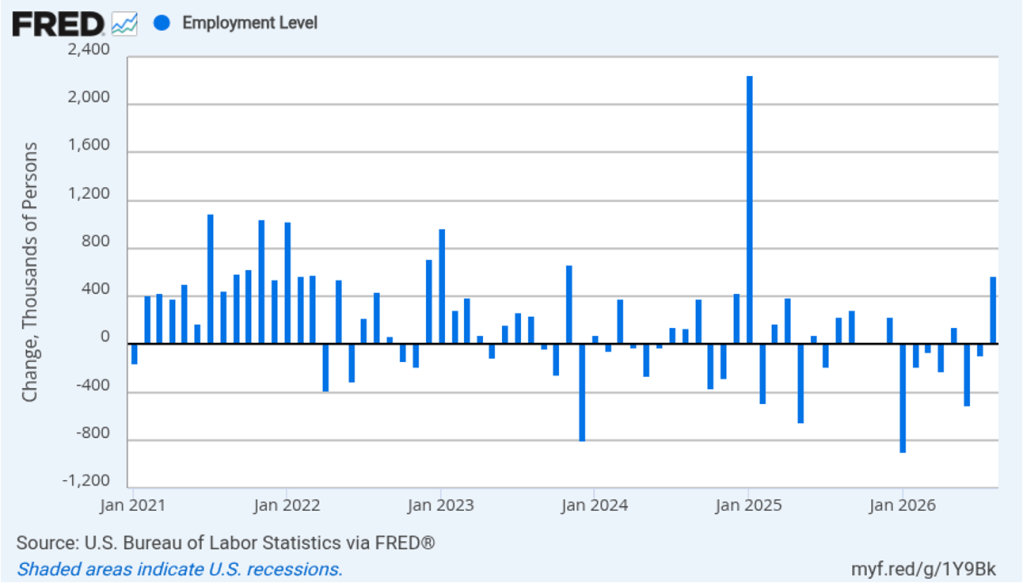
As the following figure shows, the monthly net change in jobs from the household survey moves much more erratically than does the net change in jobs from the establishment survey. As measured by the household survey, there was a net increase of 569,000 jobs in August, far larger than the net increase in employment shown in the establishment survey. Since January, the household survey has shown a net increase in jobs in only two months, with a total net decrease of 326,000 jobs over the period. In contrast, the establishment survey has shown a net increase of 643,000 jobs over the same period. (Note that because of last year’s shutdown of the federal government, there are no data for October or November.)
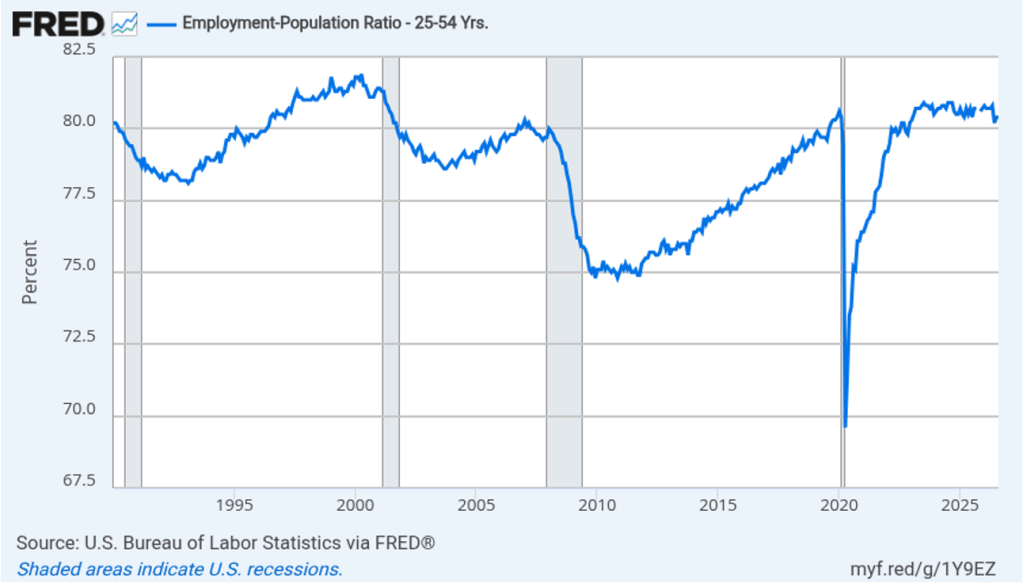
The household survey has another important labor market indicator: the employment-population ratio for prime age workers—those workers aged 25 to 54. In August, the ratio was 80.4 percent, unchanged from July. The prime-age population ratio can show volatility from month to month but has remained above 80 percent every month since December 2022.
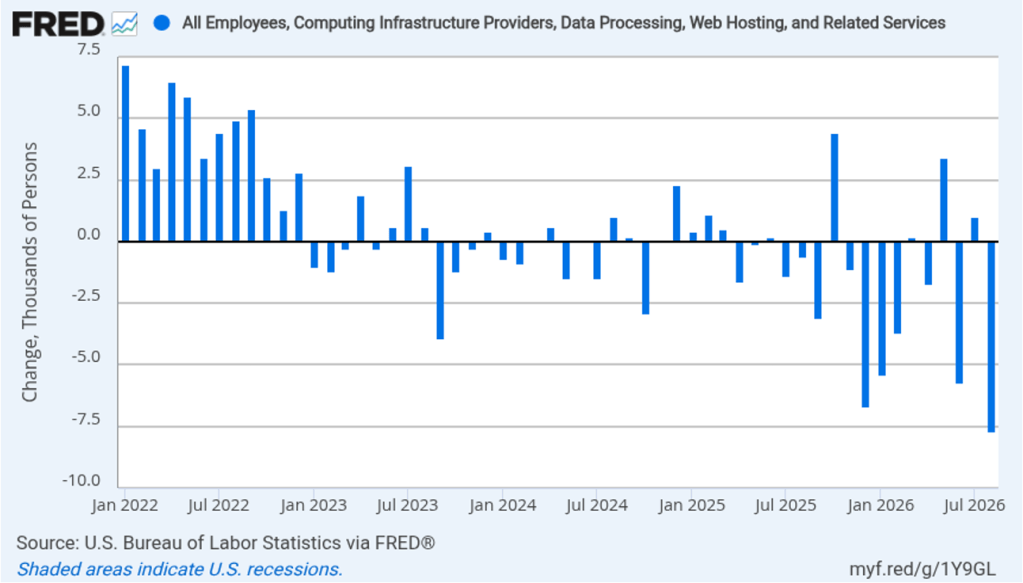
The rapid adoption of artificial intelligence (AI) by many firms has led to forecasts of substantial layoffs of workers in information systems. The following figure shows net employment changes in the BLS employment category of “computing infrastructure providers, data processing, web hosting, and related services.” Employment in this sector has been declining during most months since the beginning of 2023. In August, there was a net decrease of 7,700 jobs.
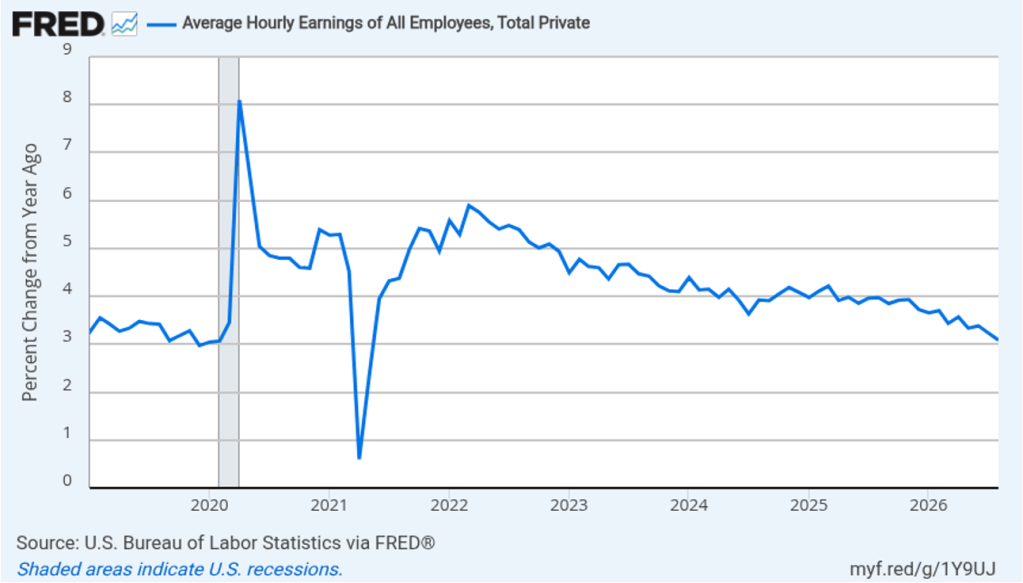
The establishment survey also includes data on average hourly earnings (AHE). As we noted in earlier posts, many economists and policymakers believe the employment cost index (ECI) is a better measure of wage pressures in the economy than is AHE. AHE does have the important advantage of being available monthly, whereas the ECI is only available quarterly. The following figure shows the percentage change in AHE from the same month in the previous year. AHE increased 3.1 percent in August, down from 3.2 percent in July. That was the smallest increase since May 2021. The rate of increase in AHE has been below 4.0 percent each month since August 2025, indicating that cost pressure from wage increases has not been a significant source of price inflation during the past year.
With inflation having been above the Federal Reserve’s 2 percent annual target every month since March 2021, there has been an expectation that the Fed’s policymaking Federal Open Market Committee (FOMC) would increase its target for the federal funds rate at least once before the end of 2026. At the FOMC’s last meeting in late July, three members of the committee voted to increase the target, an unusual amount of dissent from a committee decision.
Do today’s surprisingly strong employment data increase the chance that the FOMC will raise its target range for the federal funds rate at its next meeting on September 15–16? Investors in the federal funds futures market believe that the answer is “yes.” Yesterday, trading in the federal funds futures market indicated that investors assigned a 49.4 percent probability to the committee increasing its target range by 0.25 percentage points (25 basis points) at that meeting. This afternoon, that probability had increased to 58.4 percent. The probability that the committee will have increased its target range by at least 25 basis points from its current range of 3.50 percent to 3.75 percent after its meeting on October 27–28 increased from 62.8 percent yesterday to 69.4 percent this afternoon.
The BLS will release its estimate of inflation as measured by the consumer price index next Friday. That report will provide further evidence on the current state of inflation and may have a significant effect on the decision the FOMC makes at its meeting the following week.


One thought on “Unexpectedly Strong August Jobs Report”