Shrinkflation in the Comic Book Industry

Action Comics No. 1, published in June 1938, is often consider the first superhero comic book. (Image from comics.org.)

In a political advertisement that ran before the broadcast of the Super Bowl, President Joe Biden discussed shrinkflation, which refers to firms reducing the quantity of a product in container while keeping the price unchanged. In this post from the summer of 2022, we discussed examples of shrinkflation—including Chobani reducing the quantity of yogurt in the package shown here from 5.3 ounces to 4.5 ounces—and noted that shrinkflation complicates the job of the Bureau of Labor Statistics when compiling the consumer price index. 

This yogurt remained the same price although the quantity of yogurt in the container shrank from 5.3 ounces to 4.5 ounces.

Shrinkflation isn’t new; firms have used the strategy for decades. Firms are particularly likely to use shrinkflation during periods of high inflation or during periods when the federal government implements price controls.  Firms also sometimes resort to shrinkflation when the the price of a product has remained constant for long enough that the firms fear that consumers will react strongly to the firms increasing the price.

Comic books provide an interesting historical example of shrinkflation. David Palmer, a professor of management at South Dakota State University published an article in 2010 in which he presented data on the price and number of pages in copies of Action Comics from 1938 to 2010. When DC Comics introduced Superman in the first issue of Action Comics in June 1938, it started the superhero genre of comic books. Action Comics No. 1 had a price of $0.10 and was 64 pages.

After the United States entered World War II in December 1941, the federal government imposed price controls to try to limit the inflation caused by the surge in spending to fight the war. Rising costs of producing comic books, combined with the difficulty in raising prices because of the controls, led comic book publishers to engage in shrinkflation. In 1943, the publishers reduced the number of pages in their comics from 64 to 56. In 1944, the publishers engaged in further shrinkflation, reducing the number of pages from 56 to 48.

In 1951, during the Korean War, the federal government again imposed price controls. Comic book publishers responded with further shrinkflation, keeping the price at $0.10, while reducing the number of pages from 48 to 40. In 1954, they shrank the number of pages to 36, which remains the most common number of pages in a comic book today. At that time, the publishers also slightly reduced the width of comics from 7 3/4 inches to 7 1/8 inches. (Today the typical comic book has a width of 6 7/8 inches.)

By the late 1950s, comic book publishers became convinced that they would be better off raising the prices of comic books rather than further shrinking the number of pages. But they were reluctant to raise their prices because they had been a constant $0.10 for more than 20 years, so children and their parents might react very negatively to a price increase, and because no firm wanted to be the first to raise its price for fear of losing sales to its competitors. They were caught in a prisoner’s dilemma: Comic book publishers would all have been better off if they had raised their prices but the antitrust laws kept them from colluding to raise prices and no individual firm had an incentive to raise prices alone. (We discuss collusion, prisoner’s dilemmas, and other aspects of oligopolistic firm behaviour in Chapter 14 of Microeconomics and Economics.)

The most successful publisher in the 1950s was Dell, which sold very popular comic books featuring Donald Duck, Uncle Scrooge, and other characters that particularly appealed to younger children. Because the prices of Dell’s comic books, like those of other publishers, been unchanged at $0.10 since the late 1930s, the firm didn’t have a clear idea of the price elasticity of demand for its comics. In 1957, the firm’s managers decided to use a market experiment to gather data on the price elasticity of demand. In most cities, Dell kept the price of its comics at $0.10, but in some cities it sold the identical comics at a price of $0.15.

The experiment lasted from March 1957 to August 1958 when the company discontinued it by reverting to selling all of its comics for $0.10. Although we lack the data necessary to compare the sales of Dell comics with a $0.15 price to the sales of Dell comics with a $0.10 price, the fact that no other publisher raised its prices during that period and that Dell abandoned the experiment indicates that the demand curve for Dell’s comics was price elastic—the percentage decline in the quantity sold was greater than the 50 percent increase in price—so Dell’s revenue from sales in the cities selling comics with a price of $0.15 likely declined. Dell’s strategy can be seen as a failed example of price leadership. (We discuss the relationship between the price elasticity of demand for a good and the total revenue a firm earns from selling the good in Chapter 6, Section 6.3 of Microeconomics and Economics. We discuss price leadership in Microeconomic and Economics, Chapter 14, Section 14.2.)

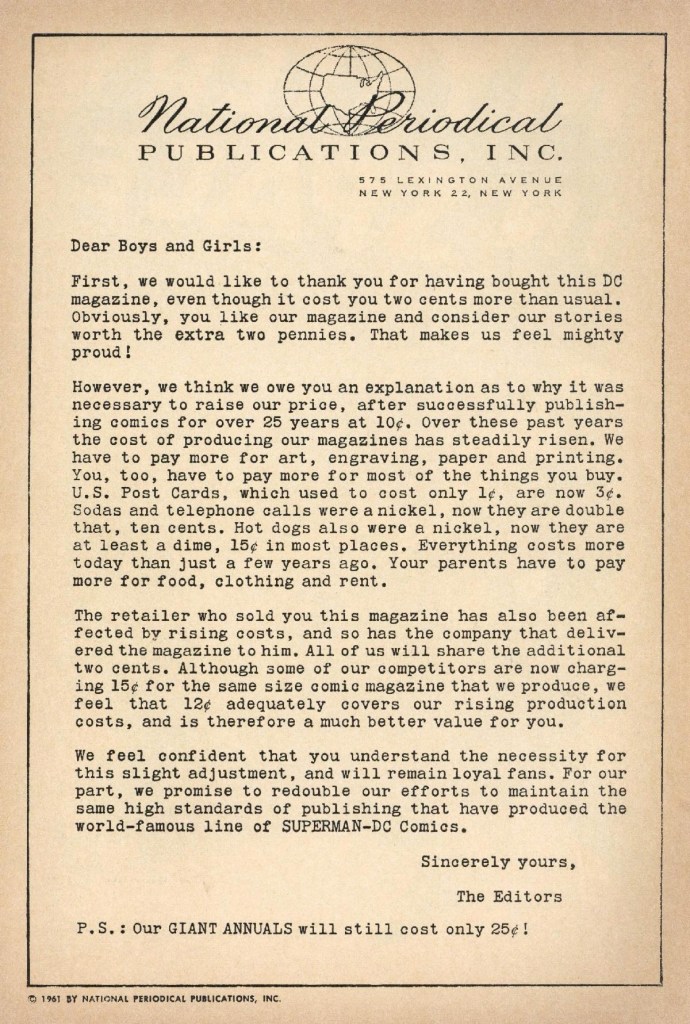
In March 1961, Dell increased the price of all of its comics from $0.10 to $0.15. At first, Dell’s competitors kept the prices of their comics at $0.10. As a result, in September 1961, Dell cut the price of its comics from $0.15 to $0.12. By early 1962, Dell’s competitors, including DC Comics, Marvel Comics—publishers of Spider-Man and the Fantastic Four—along with several smaller publishers, had increased the prices of their comics from $0.10 to $0.12. The managers at DC decided that raising the price of comics after having kept it constant for so long required an explantion. Accordingly, they printed the following letter in each of their comics.
H/T to Buddy Saunders for the image.

Comic book publishers have raised their prices many times since the early 1960s, with most comics currently having a price of $4.99. During the recent period of high inflation, comic publishers did not use a strategy of shrinkflation perhaps because they believe that 36 pages is the minimum number that buyers will accept.

The first 25 years of the comic book industry represents an interesting historical example of shrinkflation.

Solved Problem: High Prices and High Revenue in the U.S. Car Industry

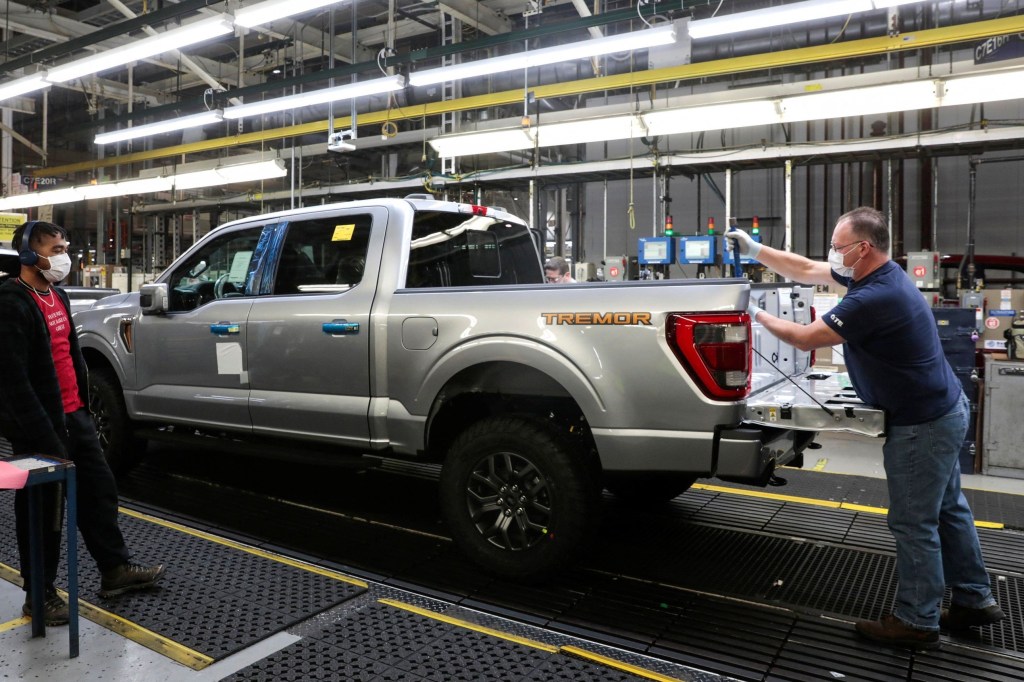
Production line for Ford F-series trucks. Photo from the Wall Street Journal.

Supports: Microeconomics, Chapter 6, Section 6.3 and Chapter 15, Section 15.6, Economics Chapter 6, Section 6.3 and Chapter 15, Section 15.6, and Essentials of Economics, Chapter 7, Section 7.7 and Chapter 10, Section 10.5.

In July 2022, an article in the Wall Street Journal noted that “The chip shortage and broader supply constraints have hampered vehicle production … Many major car companies on Friday reported U.S. sales declines of 15% or more for the first half of the year.” But the Wall Street Journal also reported that car makers were experiencing increases in revenues. For example, Ford Motor Company reported an increase in revenue even though it had sold fewer cars than during the same period in 2021.

  1. Briefly explain what must be true of the demand for new cars if car makers can sell 15 percent fewer cars while increasing their revenue.
  2. Eventually, the chip shortage and other supply problems facing car makers will end. At that point, would we expect that car makers will expand production to prepandemic levels or will they continue to produce fewer cars in order to maintain higher levels of profits? Briefly explain. 

Solving the Problem

Step 1: Review the chapter material. This problem is about the effects of price increases on firms’ revenues and on the ability of firms to restrict output in order increase profits, so you may want to review Chapter 6, Section 6.3, “The Relationship between Price Elasticity of Demand and Total Revenue” and Chapter 15, Section 15.6, “Government Policy toward Monopoly.” 

Step 2: Answer part a. by explaining what must be true of the demand for new cars if car makers are increasing their profits while selling fewer cars. Assuming that the demand curve for cars is unchanged, a decline in the quantity of cars sold will result in a move up along the demand curve for cars, raising the price of cars.  Only if the demand curve for new cars is price inelastic will the revenue car markers receive increase when the price increases. Revenue increases in this situation because with an inelastic demand curve, the percentage increase in price is greater than the percentage decrease in quantity demanded. 

Step 3: Answer part b. by explaining whether we should expect that once the car industry’s supply problems are resolved, car makers will continue to produce fewer cars.  Although as a group car makers would be better off if they could continue to reduce the supply of cars, they are unlikely to be able to do so. Any one car maker that decided to keep producing fewer cars would lose sales to other car makers who increased their production to prepandemic levels. Because this increased production would result in a movement down along the demand curve for new cars, the price would fall. So a car maker that reduced output would receive a lower price on its reduced output, causing its profit to decline. (Note that this situation is effectively a prisoner’s dilemma as discussed in Chapter 14, Section 14.2.)

The firms could attempt to keep output of new cars at a low level by explicitly agreeing to do so.  But colluding in this way would violate the antitrust laws, and executives at the firms would risk being fined or even imprisoned. The firms could attempt to implicitly collude by producing lower levels of output without explicitly agreeing to do so. (We discus implicit collusion in Chapter 14, Section 14.2.) But implicit collusion is unlikely to succeed because firms have an incentive to break an implicit agreement by increasing output. 

We can conclude that once the chip and other supply problems facing car makers are resolved, production of cars is likely to increase.

Sources: Mike Colias and Nora Eckert, “GM Says Unfinished Cars to Hurt Quarterly Results,” Wall Street Journal, July 1, 2022; and Nora Eckert, “Ford’s U.S. Sales Increase 32% in June, Outpacing Broader Industry,” Wall Street Journal, July 5, 2022.

Fanatics: The Unlikely Unicorn

Image from fanatics.com website.

unicorn is a startup, or newly formed firm, that has yet to begin selling stock publicly and has a value of $1 billion or more. (We discuss the difference between private firms and public firms in Economics and Microeconomics, Chapter 8, chapter opener and Section 8.2, and in Macroeconomics, Chapter 6, chapter opener and Section 6.2.) Usually, when we think of unicorns, we think of tech firms. That assumption is largely borne out by the following list of the 10 highest-valued U.S.-based startups, as compiled by cbinsights.com.

FirmValue
SpaceX$100.3 B
Stripe$95 B
Epic Games$42 B
Instacart$39 B
Databricks$38 B
Fanatics$27 B
Chime$25 B
Miro$17.5 B
Ripple$15 B
Plaid$13.4 B

Nine of the ten firms are technology firms, with six being financial technology—fintech—firms. (We discuss fintech firms in the Apply the Concept, “Help for Young Borrowers: Fintech or Ceilings on Interest Rates,” which appears in Macroeconomics, Chapter 14, Section 14.3, and Economics, Chapter 24, Section 24.3.) The one non-tech firm on the list is Fanatics, whose main products are sports merchandise and sports trading cards.  Because a unicorn doesn’t issue publicly traded stock, the firm’s valuation is determined by how much an investor pays for a percentage of the firm. In Fanatics’s case, the valuation was based on a $1.5 billion investment in the firm made in early March 2022 by a group of investors, including Fidelity, the large mutual find firm; Blackrock, the largest hedge fund in the world; and Michael Dell, the founder of the computer company.

These investors were expecting that Fanatics would earn an economic profit. But, as we discuss in Chapter 14, Section 14.1 and Chapter 15, Section 15.2, a firm will find its economic profit competed away unless other firms that might compete against it face barriers to entry. Although Fanatics CEO Michael Rubin has plans for the firm to expand into other areas, including sports betting, the firm’s core businesses of sports merchandise and trading cards would appear to have low barriers to entry. There are already many firms selling sportswear and there are many firms selling trading cards. The investment required to establish another firm to sell those products is low. So, we would expect competition in the sports merchandise and trading card markets to eliminate economic profit.

The key to Fanatics success is that it is selling differentiated products in those markets. Its differentiation is based on a key resource that competitors lack access to: The right to produce sportswear with the emblems of professional sports teams and the right to produce trading cards that show images of professional athletes. Fanatics has contracts with the National Football League (NFL), Major League Baseball (MLB), the National Hockey League (NHL), the National Basketball Association (NBA), and Major League Soccer (MLS)—the five most important professional sports leagues in North America—to produce jerseys, caps, and other sportswear that uses the copyrighted brands of the leagues’ teams. (In some cases, as with the NBA, Fanatics shares the right with another firm.)

Similarly, Fanatics has the exclusive right to produce trading cards bearing the images of NFL, NBA, and MLB players. In January 2022, Fanatics bought Topps, the firm that for decades had held the right to produce MLB trading cards. 

Fanatics has paid high prices to these sports leagues and their players to gain the rights to sell branded merchandise and cards. Some business analysts questioned whether Fanatics will be able to sell the merchandise and cards for prices high enough to earn an economic profit on its investments. Fanatics CEO Rubin is counting on an increase in the popularity of trading cards and the increased interest in sports caused by more states legalizing sports gambling. 

That Fanatics has found a place on the list of the most valuable startups that is otherwise dominated by tech firms indicates that many investors agree with Rubin’s business strategy.

Sources:  “The Complete List of Unicorn Companies,” cbinsights.com; Miriam Gottfried and Andrew Beaton, “Fanatics Raises $1.5 Billion at $27 Billion Valuation,” Wall Street Journal, March 2, 2022; Tom Baysinger, “Fanatics Scores $27 Billion Valuation,” axios.com March 2, 2022; Lauren Hirsch, “Fanatics Is Buying Mitchell & Ness, a Fellow Sports Merchandiser,” New York Times, February 18, 2022; and Kendall Baker, “Fanatics Bets Big on Trading Card Boom,” axios.com, January 5, 2022.

Price Leadership in the Beer Market

InBev’s St. Louis production line for Stell Artois beer. Photo from the Wall Street Journal

Firms in an oligopoly can increase their profits by agreeing with other firms in the industry on what prices to charge. Explicit price fixing violates the antitrust laws and can subject the firms involved to fines of up to $100 million and executives at the firms to fines of up to $1 million and prison terms of up to 10 years. Despite these penalties, the rewards to avoiding price competition are often so great that firms look for ways to implicitly collude—that is, to arrange ways to coordinate their prices without violating the law by explicitly agreeing on the prices to charge. (We discuss the antitrust laws in Microeconomics and Economics, Chapter 15, Section 15.6.) 

One way for firms to implicitly collude is through price leadership. With price leadership, one firm in the industry takes the lead in announcing a price change that other firms in the industry then match. (We briefly discuss price leadership in Microeconomics and Economics, Chapter 14, Section 14.2.)

In their classic industrial organization textbook, F.M. Scherer of Harvard’s Kennedy School and David Ross of Bryn Mawr College summarize the legal status of price leadership, given court opinions from antitrust cases: “[P]rice leadership is not apt to be found contrary to the antitrust laws unless the leader attempts to coerce other producers into following its lead, or unless there is evidence of an agreement among members of the industry to use the leadership device as the basis of a price-fixing scheme.” As the Federal Trade Commission notes on its website: “A uniform, simultaneous price change could be the result of price fixing, but it could also be the result of independent business responses to the same market conditions.”

Scherer and Ross describe price leadership in a number of oligopolistic industries during the twentieth century, including cigarettes, steel, automobiles, breakfast cereals, turbogenerators, and gasoline.

Recently, Nathan Miller of Georgetown University, Gloria Sheu of the Federal Reserve, and Matthew Weinberg of Ohio State University published an article in the American Economic Review analyzing price leadership in the beer industry. They focus on the period from 2001 to 2011, although they believe that conditions in the beer industry are similar today. From 2001 to 2007, three large U.S.-based firms—Anheuser-Busch, SABMiller, and Molson Coors—accounted for about two-thirds of beer sales in the United States. Two importers—Heineken and Grupo Modelo—accounted for about 14 percent of sales.  In 2008, SABMiller and Molson Coors combined to form MillerCoors and InBev—which had a small market share—bought Anheuser Busch. In 2011, MillerCoors and InBev together accounted for 63 percent of beer sales.

ABI has acted as the price leader, announcing prices in the late summer that MillerCoors typically matches. ABI’s Bud Light had the largest market share among beers in the United States in 2011, well ahead of Coors Light, which had the second largest share. They find that industry profits were 17 percent above the competitive level in 2007—just before the Miller-Coors merger—and 22 percent above the competitive level in 2010—after the merger. The U.S. Department of Justice (DOJ) had decided not to contest the Miller-Coors merger because “cost savings in distribution likely would offset any loss of competition.” As it turned out, the cost savings occurred but their value was smaller than the losses in consumer surplus resulting from reduced competition.

The authors estimate that, compared with the competitive outcome, the reduction in consumer surplus in the beer market due to price leadership equaled 154 of the increase in producer surplus before the Miller-Coors merger and 170 percent after it. Figure 15.5 from Chapter 15 of Microeconomics (reproduced below) illustrates why the loss of consumer surplus is larger than the increase in producer surplus: The increase in price and decline in quantity compared with the competitive level results in a deadweight loss that reduces the total economic surplus in the market. (Note that the figure is comparing the situation when a market is monopoly with the situation when the market is perfectly competitive. For simplicity, we are assuming that price leadership in an oligopolistic industry, such as beer, results in the monopoly outcome. But note that whenever collusive behavior, like price leadership, occurs in an industry, we would expect an increase in deadweight loss that will make the gains to firms larger than the losses to consumers.)

Sources: Federal Trade Commission, “Price Fixing,” ftc.gov; U.S. Department of Justice, Antitrust Division, “Price Fixing, Bid Rigging, and Market Allocation Schemes: What They Are and What to Look for,” justice.gov; Nathan H. Miller, Gloria Sheu, and Matthew C. Weinberg, “Oligopolistic Price Leadership and Mergers: The United States Beer Industry,” American Economic Review, Vol. 111, No. 10, pp. 3123-3159; and F.M Scherer and David Ross, Industrial Market Structure and Economic Performance, Third edition, Boston: Houghton Mifflin, 1990.

Streaming Conquers the Music Industry

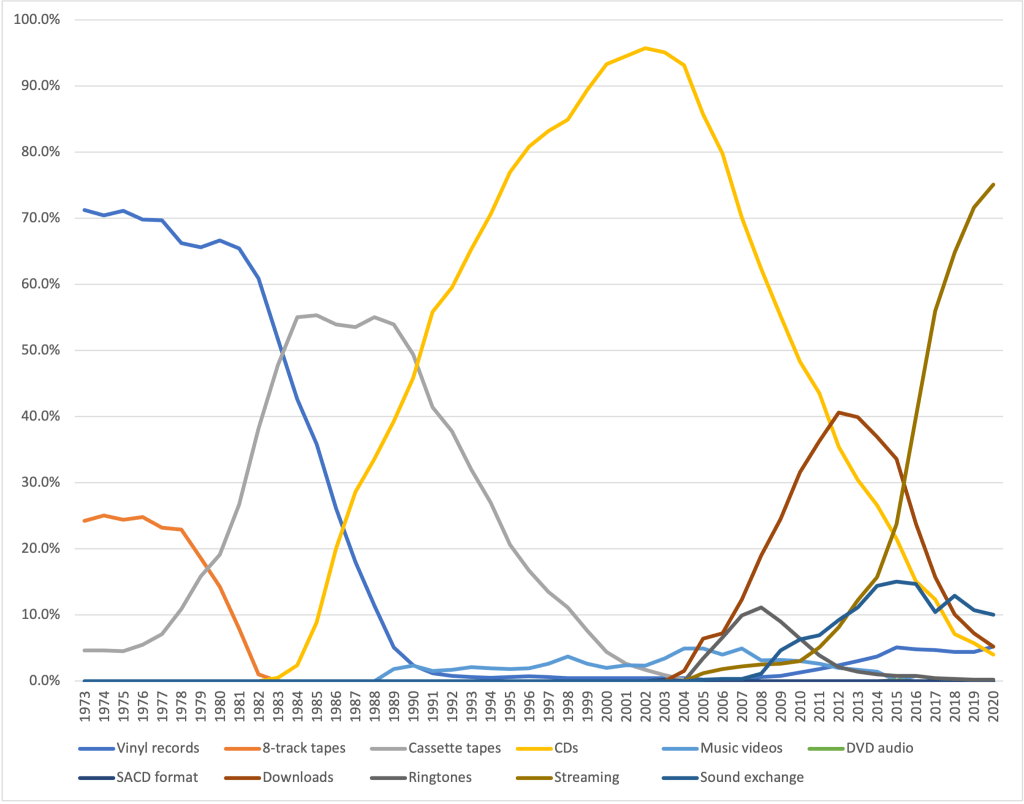
Listening to recorded music seems like a basic, uncomplicated activity, but as we discuss in the opening to Chapter 14, few markets have been as disrupted by technological change over the years as the market for recorded music.  The following graph shows the distribution of revenue received by firms in the recording industry by type of music format. The data are first available for 1973. 

From the 1930s to the mid-1960s, nearly all recorded music was sold on vinyl records. In the 1960s, 8-track tapes began to compete with vinyl records. In 1973, recording companies received about 71 percent of their revenue from selling vinyl records, 24 percent from selling 8-track tapes, and 5 percent from selling cassette tapes. Cassette tapes became increasingly popular after Sony introduced the Walkman, a portable cassette player, in 1979.  The popularity of cassettes contributed to a sharp decline in sales of vinyl records.  The share of vinyl records in revenue received from sales of recorded music dropped from 71 percent in 1975 to only 2 percent in 1990. The greater portability of cassette tapes was a significant advantage over 8-track tapes, which were most frequently used in players built into automobiles. By 1983, 8-track tapes had largely disappeared from the market.

The introduction of digital compact discs (CDs) in the early 1980s ended the rapid rise in sales of cassette tapes. By the end of the 1980s, sales of cassette tapes began to decline rapidly and their share of the market had fallen to less than 2 percent by the early 2000s. 

As discussed in the opening to Chapter 14, the development by engineers in Germany of the MP3 file format made it possible to store the contents of a music CD on a file small enough to be downloaded from the internet. Apple’s opening its iTunes online music store in 2003 increased sales of music downloads, which peaked at 40 percent of the market in 2012. In that year, recording companies earned about 8 percent of their revenue from payments from streaming services like Spotify or Apple Music.

Steaming music has become increasingly popular and by 2020, 75 percent of industry revenue was earned from streaming. Ten percent was earned from “sound exchange,” which refers to revenue recording companies receive when music is used in a movie, television series, advertisement, or online video. (Some industry analysts consider sound exchange to be a form of streaming. Using that definition raises streaming’s share to 85 percent of the market.) Downloads had a market share of only 5 percent, about the same as the share of vinyl records, which had increased from a low point of less than 1 percent in 2007. CD sales continue to slowly decline and make up about 4 percent of the market. 

In Chapter 14, we discuss the streaming market as an example of oligopolistic competition.  When a market expands as rapidly as music streaming has, competition can be less intense because it’s possible for firms to increase their revenue as the market expands without having to attract customers from competitors. Typically when a market matures and the increase in total revenue levels off, competition can become more intense. We may see that development in the market for streaming music in coming years.

Source: Data from Recording Industry Association of America, “U.S. Sales Database.”

Solved Problem: Pricing Video Games

Supports:  Econ (Chapter 12 – Oligopoly: Firms in Less Competitive Markets (Section 14.2); Essentials: Chapter 11 – Monopolistic Competition and Oligopoly (Section 11.6)

Solved Problem: Pricing Video Games

   In November 2020, an article on bloomberg.com discussed the pricing of video games for consoles like PlayStation and Xbox. The article noted that firms selling video games had kept prices constant at $60 per game since 2005. But this stable price was about to change: “This week, video game publishers will press ahead with an industry-wide effort to raise the standard price to $70.” An article in the Wall Street Journal indicated that the number of people playing video games has been increasing and had reached 244 million in the United States and 3.1 billion worldwide in 2020. Answer the following questions assuming that the video game industry is an oligopoly.

a. Is it likely that the demand for video games and the cost of producing them have remained constant for 15 years? If not, what can explain the fact that the prices of video games remained constant from 2005 to 2020?

b. Given your answer to part a., what can explain the fact that the prices of video games increased by $10 in 2020? Does the fact that this increase was an “industry-wide effort” matter? Briefly explain.

Sources: Olga Kharif and Takashi Mochizuki, “Video Game Prices Are Going Up for the First Time in 15 Years,” Bloomberg.com, November 9, 2020; and Sarah E. Needleman, “From ‘Fall Guys’ to ‘Among Us,’ How America Turned to Videogames Under Lockdown,” Wall Street Journal, October 31, 2020.

Solving the Problem

Step 1:   Review the chapter material. This problem is about pricing in an oligopolistic industry, so you may want to review Chapter 14, Section 14.2 “Game Theory and Oligopoly.”

Step 2:   Answer part a. by discussing whether it’s likely that the demand for video games and the cost of producing them have remained constant for 15 years and by providing an alternative explanation for the prices of video games remaining constant over this period. Over such a long period, it’s unlikely that the demand for video games and the cost of producing them have remained constant. For one thing, the Wall Street Journal article indicates that the number of people playing video games has been increasing, reaching 244 million in the United States in 2020 (out of a U.S. population of about 330 million). The cost of producing most consumer electronics has declined over the years. Although we are not given specific information that the cost of producing video games has followed this pattern, it seems probable that it did. So, it’s unlikely that the reason that the prices of video games have remained constant is that the demand for video games and the cost of producing them have remained unchanged.

The problem tells us to assume that the video game industry is an oligopoly. We know that price stability in an oligopolistic industry can sometimes be the result of the firms in the industry finding themselves in a prisoner’s dilemma. In this situation, the most profitable strategy for a firm is to match the low price charged by competitors even though the firm and its competitors could, both as a group and individually, earn larger profits by all charging a higher price. It seems more likely that the firms in the video game industry were stuck for years in a prisoner’s dilemma than that they have faced unchanged demand and production costs over such a long period.

Step 3:   Answer part b. by explaining why the prices of video games increased by $10 in 2020, taking into account that the increase was an “industry-wide effort.” As we note in the textbook, the prisoner’s dilemma is an example of a noncooperative equilibrium in which firms fail to cooperate by taking actions—in this case raising the prices of video games—that would make them all better off. Firms have an incentive to increase their profits by switching to a cooperative equilibrium of charging $10 more for video games by implicitly colluding to do so. Explicitly colluding by having firms’ executives meet and agree to raise prices is against the law in the United States and Europe. But implicit collusion in which firms signal to each other—perhaps by talking about their plans with journalists—that they intend to raise prices is a gray area of the law that governments may not take action against. The fact that the bloomberg.com article states that the price increase was an “industry-wide effort” is an indication that video game firms may have implicitly colluded to raise video game prices by $10.

COVID-19 Update – Can Mom and Pop Businesses Survive the Coronavirus Pandemic?

Supports:  Econ & Micro: Chapter 11, Technology, Production, and Costs (Section 11.6); Chapter 13, Monopolistic Competition; Chapter 14, Oligopoly (Section 14.1); Essentials: Chapter 9, Technology, Production, and Costs; Chapter 11, Monopolistic Competition and Oligopoly

Can Mom and Pop Businesses Survive the Coronavirus Pandemic?

By early April 2020, because of the coronavirus pandemic, all 50 state governments had issued declarations of emergency and had closed schools and some or all businesses considered to be non-essential.  A survey by Alexander Bartik of the University of Illinois and colleagues indicated that about 43 percent of small businesses in the Unites States had closed, causing most of their revenue to disappear.  As a result, those businesses had laid off about 40 percent of their employees.

In March 2020, Congress and President Donald Trump enacted the Coronavirus Aid, Relief, and Economic Security (CARES) Act. The act included the Paycheck Protection Program (PPP), which provided loans to businesses with 500 or fewer employees to pay for up to eight weeks of payroll expenses and certain other costs. The government would forgive the loans if business owners used 75 percent of the funds for payroll expenses.

            The PPP was administered by the federal Small Business Administration with the loans being made primarily by local banks. Many small businesses have trouble borrowing from banks, particularly if they lack collateral, such as owning the building they operate in, or if they don’t have a long-term relationship with a bank by having borrowed from them in the past or having maintained a business checking account with them. In a survey by the Federal Reserve conducted in 2019, before the coronavirus pandemic, 64 percent of small businesses had faced financial challenges, such as paying operating expenses or purchasing inventories, during the previous year.  Of those firms, 69 percent had relied on the owner’s personal funds to meet the financial challenge. 

            In mid-April 2020, it was unclear whether Congress might change the PPP to make it easier for small businesses to borrow through credit unions and other lenders that are not commercial banks. News reports indicated that a significant number of small businesses had exhausted the funds their owners had available and intended to permanently close.  It’s not unusual for a small firm to fail. In a typical year, even when the economy is expanding, hundreds of thousands of businesses fail (and a similar number open).  But some economists and policymakers were concerned that the effects of the pandemic might lead to a permanent reduction in the number of small firms, particularly so-called “Mom and Pop businesses”—sole proprietorships that employ fewer than 20 workers.  (We discuss the differences between sole proprietorships and other ways of organizing a business in Chapter 8, Section 8.1)

The pandemic posed particular challenges for these businesses.  Many small retailers, such as clothing stores, shoe stores, card shops, and toy stores, had already been hurt before the pandemic as consumers shopped at online sites such as Amazon. This trend increased during the pandemic. In addition, as many consumers shifted from eating in restaurants to buying groceries from supermarkets or online, the future of some small restaurants seemed in doubt.

Even as states and cities began to allow nonessential businesses to reopen, many consumers were reluctant to return to eating in restaurants, staying in hotels, and shopping in brick-and-mortar stores in the absence of a vaccine against the coronavirus.  The shift to online buying was evident during March and April 2020 when, as many small businesses were laying off workers, Amazon was hiring an additional 175,000 workers and Walmart was hiring an additional 150,000.  Some public health authorities and epidemiologists were suggesting that businesses take certain steps to reassure consumers, although doing so would raise the businesses’ costs of operating. For instance, Scott Gottlieb, former Food and Drug Administration commissioner, suggested that “businesses … should look at trying to bring testing on-site at the place of employment” to reassure customers that the businesses’ workers did not have the virus. He also suggested that restaurants print their menus on paper that could be thrown away after each use and commit to more frequent disinfecting. Clearly, the revenue earned by larger businesses would be better able to cover these costs while still at least breaking even.

            If the world is entering a new period with more frequent epidemics of viruses to which most people lack immunity, small businesses will be at a further disadvantage. Although Congress and the president responded to the coronavirus with the PPP program, whether they would have funds to do so during future epidemics remained unclear. As a result, it may be of increased importance that firms have the resources to finance periods of closure without having to rely on government payments, loans from banks for which they may lack the necessary collateral, or running balances on high-interest rate credit cards. The survey by Alexander Bartik and colleagues referred to earlier indicated that the average small business has $10,000 in monthly costs and less than that amount readily available to use to pay those costs.  In other words, many small businesses are dependent on paying their current costs from their current revenues.

            Most small business owners are resourceful enough to respond to changing conditions, but the challenges posed by the coronavirus seemed likely to reshape the structure of some industries, including restaurants, small retail stores, gyms, non-chain hotels, and small medical and dental practices. When discussing the role that barriers to entry play in determining the level of competition and the size of firms in an industry, we emphasized the role played by physical economies of scale. For instance, we noted that:

A music streaming firm has the following high fixed costs:  very large server capacity, large research and development costs for its app, and the cost of the complex accounting necessary to keep track of the payments to the musicians and other copyright holders whose songs are being streamed.  A large streaming firm such as Spotify has much lower average costs than would a small music streaming firm, partly because a large firm can spread its fixed costs over a much larger quantity of subscriptions sold.

We also noted that economies of scale of this type did not exist in the restaurant industry. Prior to the pandemic, it was reasonable to argue that large restaurants were typically unable to serve meals at a lower average cost than smaller restaurants and that even if smaller restaurants faced higher average costs, by differentiating the meals they served, smaller restaurants could still attract customers despite charging a higher price than larger restaurants. But if small restaurants lack the ability to finance periods of closure during epidemics and have trouble breaking even due to the higher costs of printing paper menus, testing their employees onsite, and more frequent cleaning, they may struggle to survive. Larger restaurants can spread these costs over a larger number of meals, reducing the average cost of one meal compared with smaller restaurants. As more consumers avoid restaurants and eat more frequently at home, smaller restaurants may be pushed further up their average cost curves by being able to sell only a smaller quantity of meals.

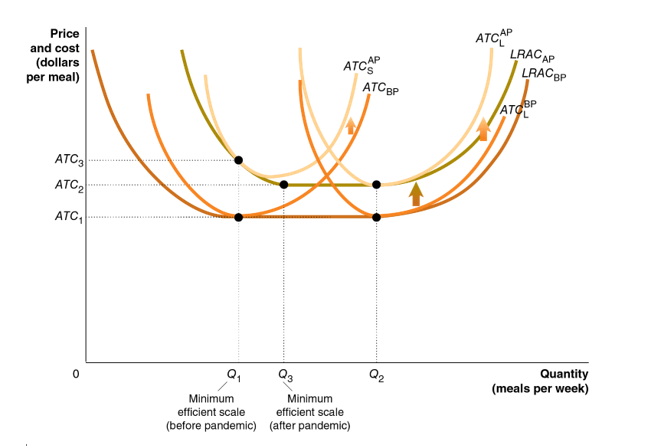
The following figure illustrates how the pandemic may affect the costs of a typical restaurant.  The long-run average cost curve LRACBP shows the situation before the pandemic. The higher costs necessary to operate after the pandemic, including printing paper menus and more frequent cleaning, shifts up the long-run average cost curve to LRACAP.  Before the pandemic, the average total cost curve for the small restaurant is  and for the large restaurant is .  Notice that even though the large restaurant serves Q2 meals per week and the small restaurant serves Q1 meals per week, they both have the same average total cost per meal, ATC1.

Also notice that before the pandemic, serving Q1 meals per week was the minimum efficient scale for a restaurant.  Minimum efficient scale is the level of output at which all economies of scale are exhausted.  The pandemic increases the costs of the small restaurant from  to is , and the costs of the large restaurant from to .  Minimum efficient scale increases to Q3, which is more meals per week than a small restaurant can sell. As a result, the average total cost of small restaurant increases to ATC3. A larger restaurant is still selling a quantity of meals that is beyond minimum efficient scale, so its average cost only rises to ATC2.  With higher average costs, smaller restaurants are less able to successfully compete with larger restaurants.  

Small firms in other industries are likely to face similar challenges. The result could be a contraction in the number of firms in some industries.  For instance, we may see franchised firms replacing Mom and Pop businesses—more Domino’s and Pizza Hut outlets and fewer independent pizza restaurants.  Although it’s too early to tell the full effects of the coronavirus pandemic on U.S. businesses, the effects are likely to be far-reaching.

Sources: Ruth Simon, “For These Companies, Stimulus Was No Solution; ‘We Decided to Cut Our Losses,’” Wall Street Journal, April 15, 2020; Amara Omeokwe, “Small-Business Funding Dispute Challenges Community Lenders,” Wall Street Journal, April 14, 2020; Alexander W. Bartik, Marianne Bertrand, Zoë B. Cullen, Edward L. Glaeser, Michael Luca, and Christopher T. Stanton, “How Are Small Businesses Adjusting to Covid-19? Early Evidence from a Survey,” National Bureua of Economic Research, Working Paper 26989, April 2020 (https://www.nber.org/papers/w26989.pdf); Board of Governors of the Federal Reserve System, 2019 Report on Employer Firms: Small Business Credit Survey, https://www.fedsmallbusiness.org/medialibrary/fedsmallbusiness/files/2019/sbcs-employer-firms-report.pdf, 2019; Norah O’Donnell And Margaret Hynds, “5 Things to Know about Reopening the Country from Dr. Scott Gottlieb,” cbsnews.com, April 14, 2020.

Question: 

Sendhil Mullainathann of the University of Chicago wrote an opinion column in the New York Times describing the situation facing the owner of a small restaurant:

She has little money in cash reserve; operating margins are thin … and her savings had already been spent on expanding the cramped kitchen. What was a thriving enterprise before the pandemic will emerge—if it emerges at all—as a hobbled business, which may well fail shortly thereafter.

A) What does Mullainathan mean by the restaurant’s “operating margins are thin”? Why would we expect the operating margins of a small restaurant to be thin?

B) If this restaurant was a “thriving enterprise” before the pandemic, why might it be likely to fail after the pandemic?

For Economics Instructors that would like the approved answers to the above questions, please email Christopher DeJohn from Pearson at christopher.dejohn@pearson.com and list your Institution and Course Number.