This morning (November 27), the BEA released monthly data on the personal consumption expenditures (PCE) price index as part of its “Personal Income and Outlays” report for October. The Fed relies on annual changes in the PCE price index to evaluate whether it’s meeting its 2 percent annual inflation target. This month’s data indicates that progress towards the Fed’s target may have stalled.
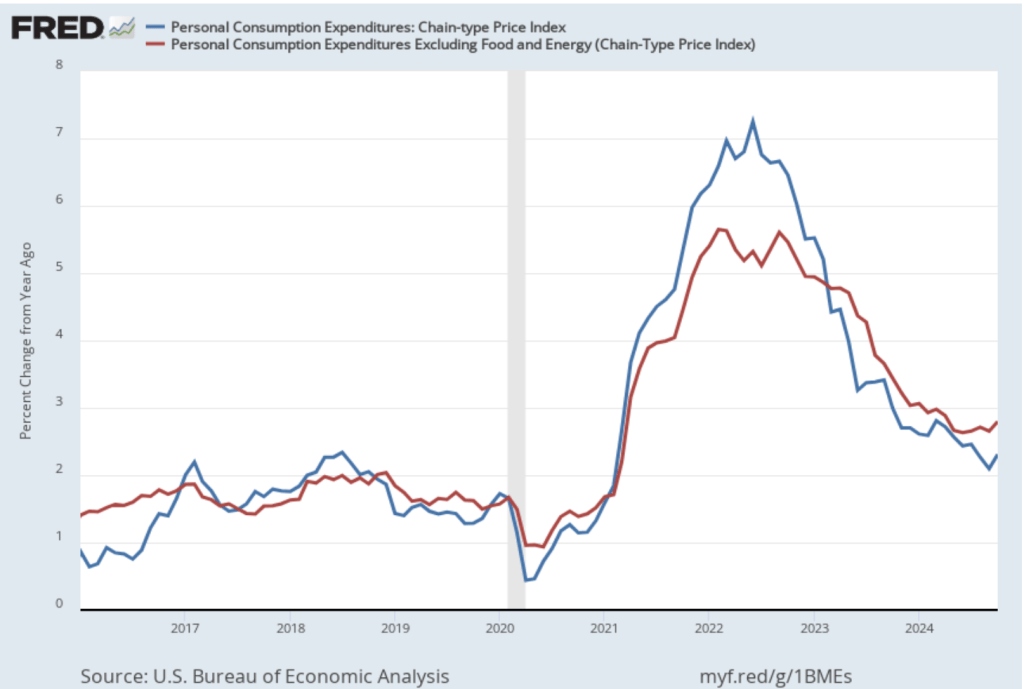
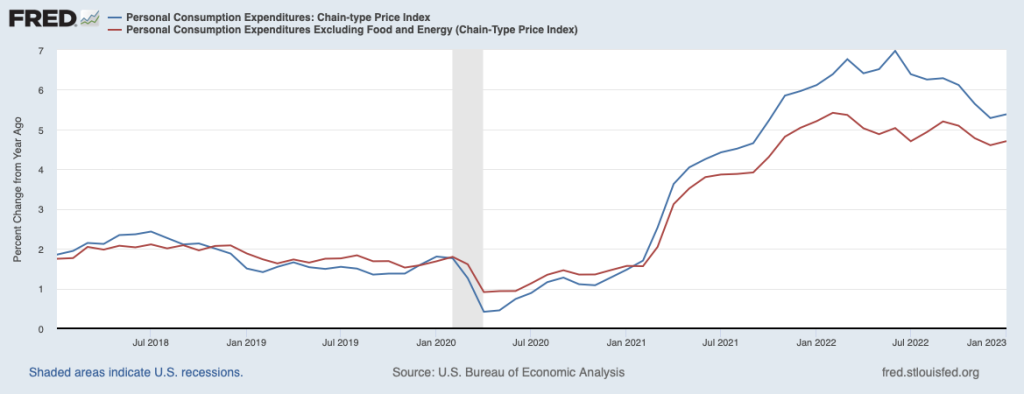
The following figure shows PCE inflation (blue line) and core PCE inflation (red line)—which excludes energy and food prices—for the period since January 2016 with inflation measured as the percentage change in the PCE from the same month in the previous year. Measured this way, in October, PCE inflation (the blue line) was 2.3 percent, up from 2.1 percent in September. Core PCE inflation (the red line) in October was 2.8 percent, up from 2.7 percent in September. Both PCE inflation and core PCE inflation were in accordance with the expectations of economists surveyed.
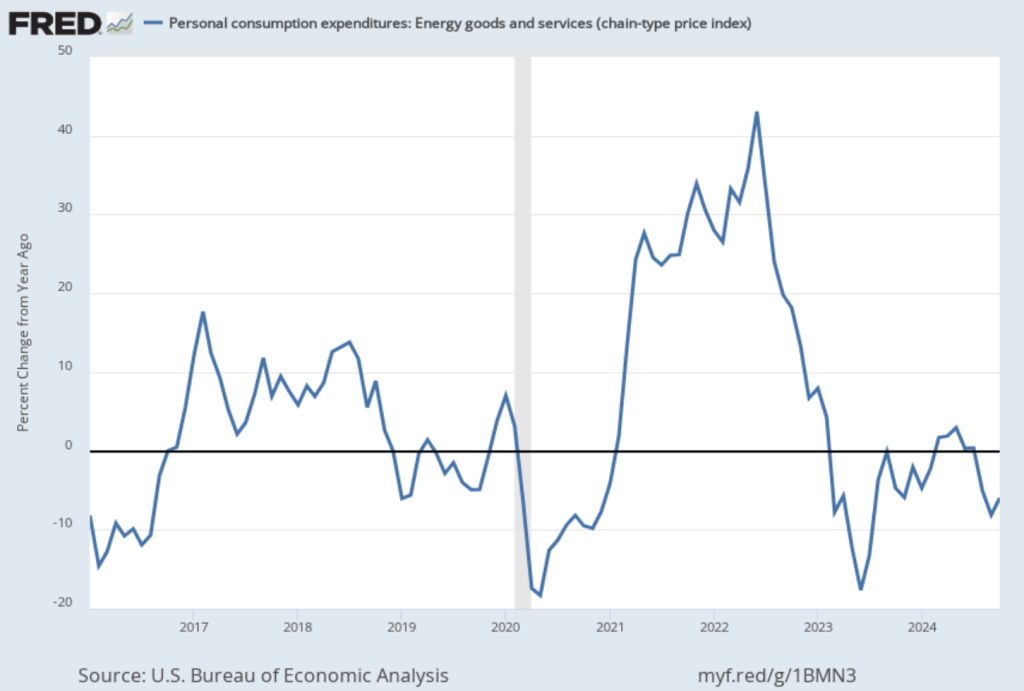
One reason that PCE inflation has been lower than core PCE inflation in recent months is that PCE inflation has been held down by falling energy prices, as shown in the following figure. Energy prices have been falling over the last three months and were down 5.9 percent in October. It seems unlikely that falling energy prices will persist.
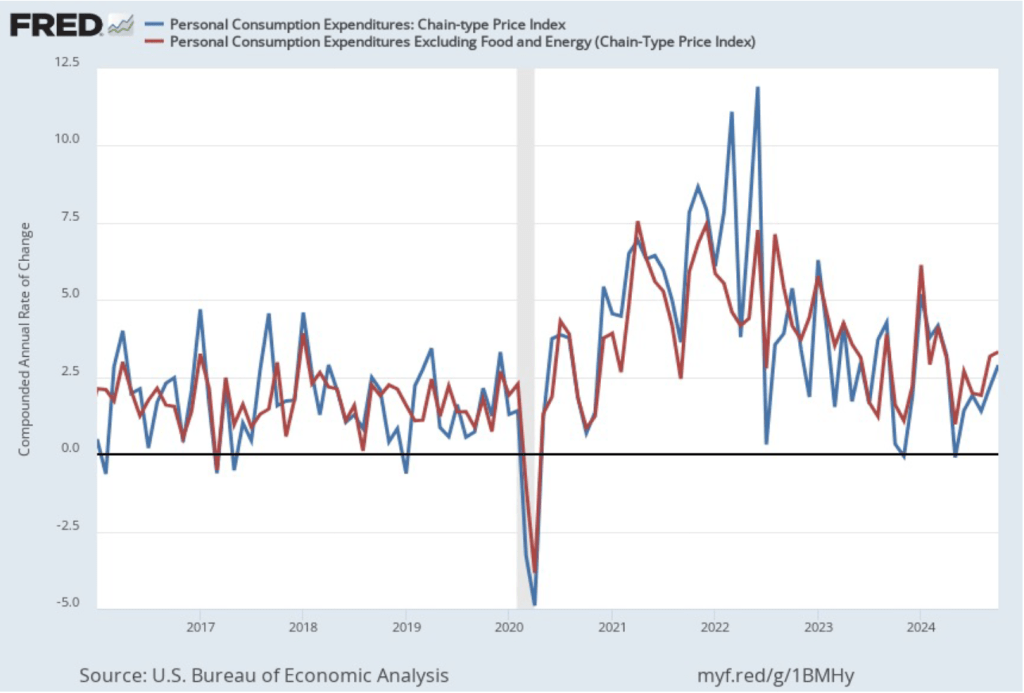
The following figure shows PCE inflation and core PCE inflation calculated by compounding the current month’s rate over an entire year. (The figure above shows what is sometimes called 12-month inflation, while this figure shows 1-month inflation.) Measured this way, PCE inflation rose in October to 2.9 percent from 2.1 percent in September. Core PCE inflation rose from 3.2 percent in September to 3.3 percent in October. Because core inflation is generally a better measure of the underlying trend in inflation, both 12-month and 1-month core PCE inflation indicate that inflation may still run well above the Fed’s 2 percent target in coming months. But the usual caution applies that data from one month shouldn’t be overly relied on.
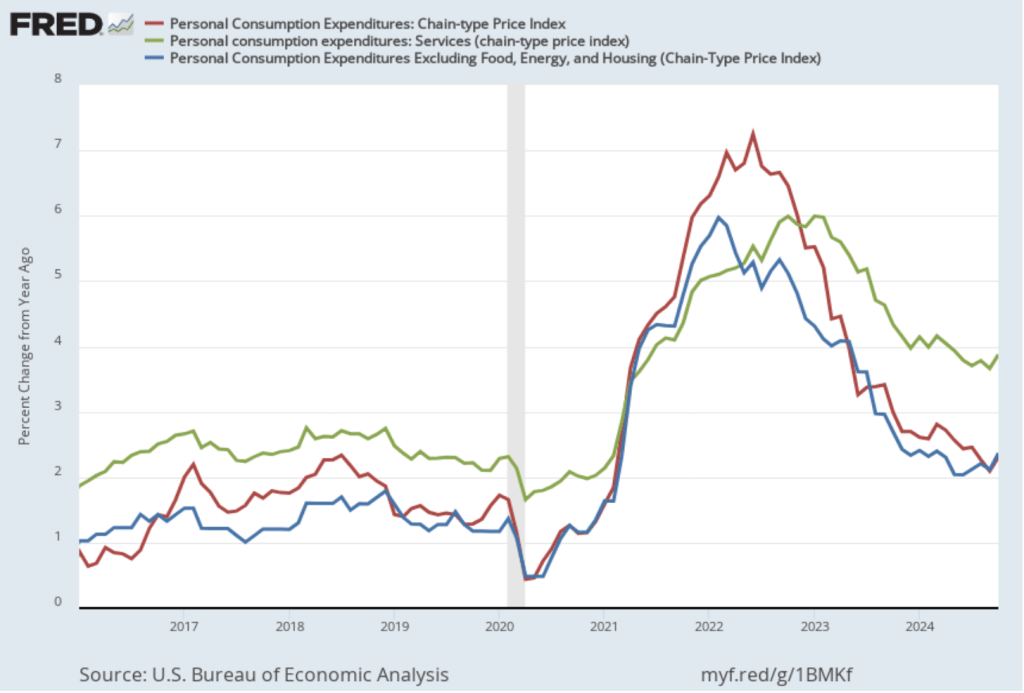
The following figure shows other ways of gauging inflation by including the 12-month inflation rate in the PCE (the same as shown in the figure above—although note that PCE inflation is now the red line rather than the blue line), inflation as measured using only the prices of the services included in the PCE (the green line), and core inflation, excluding the price of housing services as well as the prices of food and energy (the blue line). Fed Chair Jerome Powell and other members of the Federal Open Market Committee (FOMC) have said that they are concerned by the persistence of elevated rates of inflation in services and in housing.
Inflation in services remained high, increasing from 3.7 percent in September to 3.9 percent in October. Core inflation, measured by excluding housing as well as food and energy, increased from 2.1 percent in September to 2.4 percent in October.
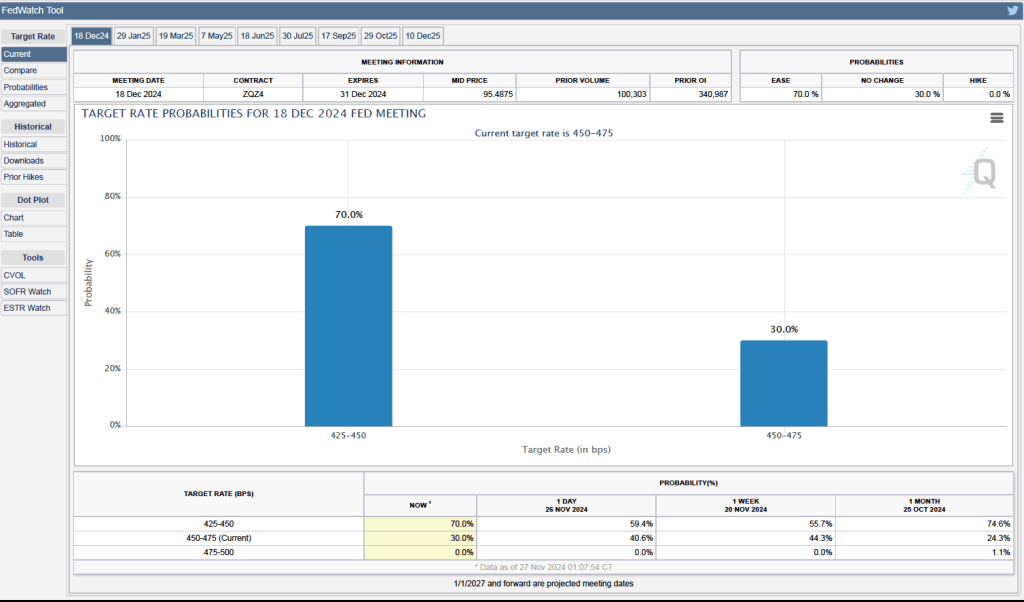
Some Fed watchers have suggested that higher inflation readings may lead he Fed’s policymaking Federal Open Market Committee (FOMC) to leave its target for the federal funds rate unchanged at its next meeting on December 17-18. As of today, however, investors who buy and sell federal funds futures contracts are still expecting that the FOMC will reduce its target by 0.25 percent (25 basis points) at its next meeting. (We discuss the futures market for federal funds in this blog post.) As shown in the following figure, investors assign a probability of 70 percent to the FOMC cutting its target for the federal funds rate from the current range of 4.50 percent to 4.75 percent to a range of 4.25 percent to 4.50 percent. Investors assign a probability of only 30 percent to the FOMC leaving its target unchanged.
Since the FOMC began increasing the target for the federal funds rate in the spring of 2022, economists have discussed three possible outcomes of the Fed’s monetary policy:
A hard landing, with the economy only returning to the Fed’s 2 percent inflation target if the U.S. economy experiences a recession
A soft landing, with the economy returning to 2 percent inflation without experiencing a recession.
No landing, with the economy not experiencing a recession but with inflation remaining persistently above the Fed’s 2 percent target.
With GDP and employment data showing no indication that a recession will begin soon and with today’s data showing inflation—while having declined substantially from its mid-2022 peak—remaining above the Fed’s 2 percent target, the chances of the no landing outcome seem to be increasing.
Federal Reserve Governor Christopher J. Waller (photo from the Associated Press via the Wall Street Journal)
Fed Governor Christopher Waller has a reputation for being a policy hawk, which means that since the spring of 2022 he has been a forceful advocate of multiple increases in the target for the federal funds rate as the Fed attempts to slow the economy and bring inflation back to the Fed’s 2 percent target. (Waller’s biography on the Fed’s web site can be found here.)
So, it was notable that in a speech at the American Enterprise Institute (AEI) on November 28, he said that “I am increasingly confident that policy is currently well positioned to slow the economy and get inflation back to 2 percent.” Although he also stressed that “there is still significant uncertainty about the pace of future activity, and so I cannot say for sure whether the [Federal Open Market Committee] FOMC has done enough to achieve price stability” his remarks were interpreted as reinforcing the growing view among non-Fed economists and investors that the FOMC is unlikely to increase its target for the federal funds rate further and is likely to reduce the target at some point during 2024. The text of Waller’s speech can be found here.
AEI economist Michael Strain interviewed Waller following his speech. In the interview (which can be found here), Strain made the case for believing that the Fed’s ability to achieve a soft landing—returning inflation to the 2 percent target without pushing the economy into a recession—would be more difficult than Waller seems to believe. Included in the interview are discussions of whether expecting a soft landing is consistent with the historical record, what guidance the Taylor rule can give to monetary policymakers (we discuss the Taylor rule in Macroeconomics, Chapter 15, Section 15.5, Economics, Chapter 25, Section 15.5, and Essentials of Economics, Chapter 17, Section 17.5), the significance of rising labor force participation rates among prime-age workers, and the implications large federal budget deficits have for monetary policy.
This morning the Bureau of Economic Analysis (BEA) released its advance estimate of GDP for the third quarter of 2023. (The report can be found here.) The BEA estimates that real GDP increased by 4.9 percent at an annual rate in the third quarter—July through September. That was more than double the 2.1 percent increase in real GDP in the second quarter, and slightly higher than the 4.7 percent that economists surveyed by the Wall Street Journal last week had expected. The following figure shows the rates of GDP growth each quarter beginning in 2021.
Note that the BEA’s most recent estimates of real GDP during the first two quarters of 2022 still show a decline. The Federal Reserve’s Federal Open Market Committee only switched from a strongly expansionary monetary policy, with a target for the federal funds of effectively zero, to a contractionary monetary policy following its March 16, 2022 meeting. That real GDP was declining even before the Fed had pivoted to a contractionary monetary policy helps explain why, despite strong increases employment during this period, most economists were expecting that the U.S. economy would experience a recession at some point during 2022 or 2023. This expectation was reinforced when inflation soared during the summer of 2022 and it became clear that the FOMC would have to substantially raise its target for the federal funds rate.
Clearly, today’s data on real GDP growth, along with the strong September employment report (which we discuss in this blog post), indicates that the chances of the U.S. economy avoiding a recession in the future have increased and are much better than they seemed at this time last year.
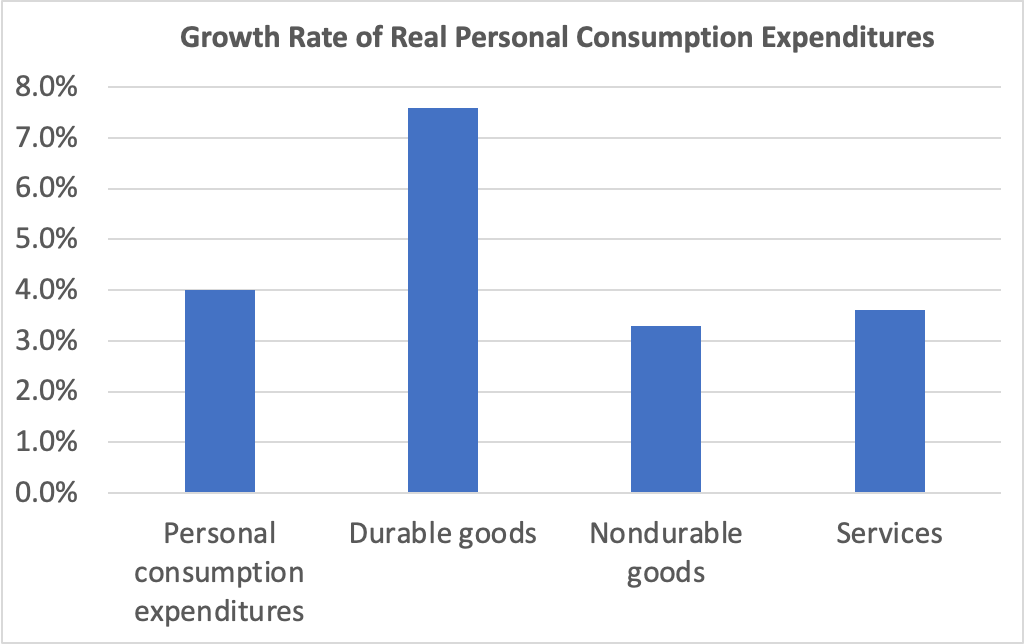
Consumer spending was the largest contributor to third quarter GDP growth. The following figure shows growth rates of real personal consumption expenditures and the subcategories of expenditures on durable goods, nondurable goods, and services. There was strong growth in each component of consumption spending. The 7.6 percent increase in expenditures on durables was particularly strong, particularly given that spending on durables had fallen by 0.3 percent in the second quarter.
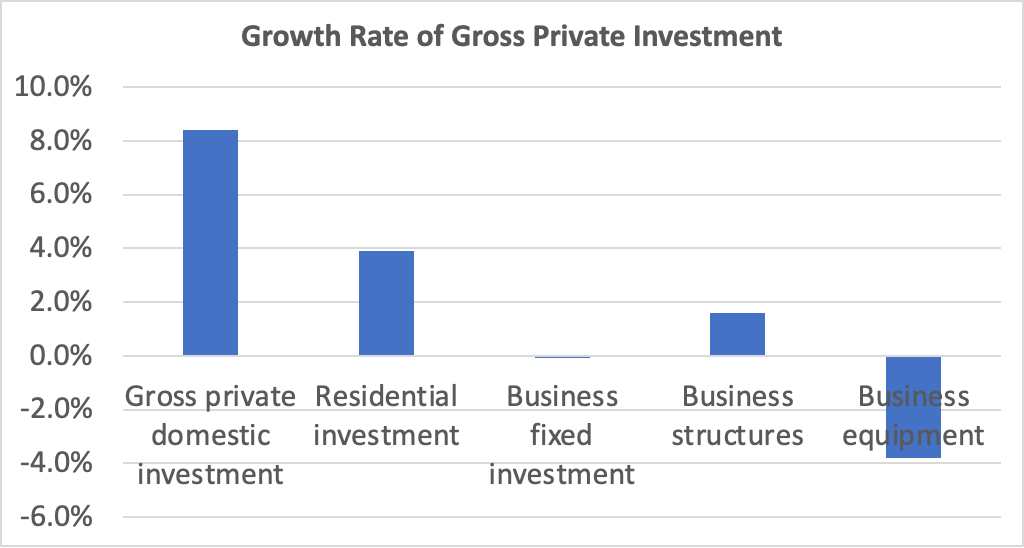
Investment spending and its components were a more mixed bag, as shown in the following figure. Overall, gross private domestic investment increased at a very strong rate of 8.4 percent—the highest rate since the fourth quarter of 2021. Residential investment increased 3.9 percent, which was particularly notable following nine consecutive quarters of decline and during a period of soaring mortgage interest rates. But business fixed investment was noticeably weak, falling by 0.1 percent. Spending on structures—such as factories and office buildings—increased by only 1.6 percent, while spending on equipment fell by 3.8 percent.
Today’s real GDP report also contained data on the private consumption expenditure (PCE) price index, which the FOMC uses tp determine whether it is achieving its goal of a 2 percent inflation rate. The following figure shows inflation as measured using the PCE and the core PCE—which excludes food and energy prices—since the beginning of 2015. (Note that these inflation rates are measured using quarterly data and as compound annual rates of change.) Despite the strong growth in real GDP and employment, inflation as measured by PCE increased only from 2.5 percent in the second quarter to 2.9 percent in the third quarter. Core PCE, which may be a better indicator of the likely course of inflation in the future, continued the long decline that began in first quarter of 2022 by failling from 3.7 percent to 2.9 percent.
The combination of strong growth in real GDP and declining inflation indicates that the Fed appears well on its way to a soft landing—achieving a return to its 2 percent inflation target without pushing the economy into a recession. There are reasons to be cautious, however.
GDP, inflation, and employment data are all subject to—possibly substantial—revisions. So growth may have been significantly slower than today’s advance estimate of real GDP indicates. Even if the estimate of real GDP growth of 4.9 percent proves in the long run to have been accurate, there are reasons to doubt whether output growth can be maintained at near that level. Since 2000, annual growth in real GDP has average only 2.1 percent. For GDP to begin increasing at a rate substantially higher than that would require a significant expansion in the labor force and an increase in productivity. While either or both of those changes may occur, they don’t seem likely as of now.
In addition, the largest contributor to GDP growth in the third quarter was from consumption expenditures. As households continue to draw down the savings they built up as a result of the federal government’s response to the Covid recession of 2020, it seems unlikely that the current pace of consumer spending can be maintained. Finally, the lagged effects of monetary policy—particularly the effects of the interest rate on the 10-year Treasury note having risen to nearly 5 percent (which we discuss in our most recent podcast)—may substantially reduce growth in real GDP and employment in future quarters.
But those points shouldn’t distract from the fact that today’s GDP report was good news for the economy.
When the Bureau of Labor Statistics’ Employment Situation report is released on the first Friday of each month economists and policymakers—notably including the members of the Federal Reserve’s Federal Open Market Committee (FOMC)—focus on the change in total nonfarm payroll employment as recorded in the establishment, or payroll, survey. That number gives what is generally considered to be the best indicator of the current state of the labor market. The most recent report showed a surprisingly strong net increase of 336,000 jobs during September. (The report can be found here.)
According to a survey by the Wall Street Journal, economists had been expecting an net increase in jobs of only 170,000. The larger than expected increase indicated that the economy might be expanding more rapidly than had been thought, raising the possibility that the FOMC might increase its target for the federal funds rate at least once more before the end of the year.
To meet increases in the growth of the U.S. working-age population, the economy needs to increase the total jobs available by approximately 80,000 jobs per month. A net increase of more than four times that amount may be an indication of an overheated job market. As always, one difficulty with drawing that conclusion is determing how many more people might be pulled into the labor market by a strong demand for workers. An increase in labor supply can potentially satisify an increase in labor demand without leading to an acceleration in wage growth and price inflation.
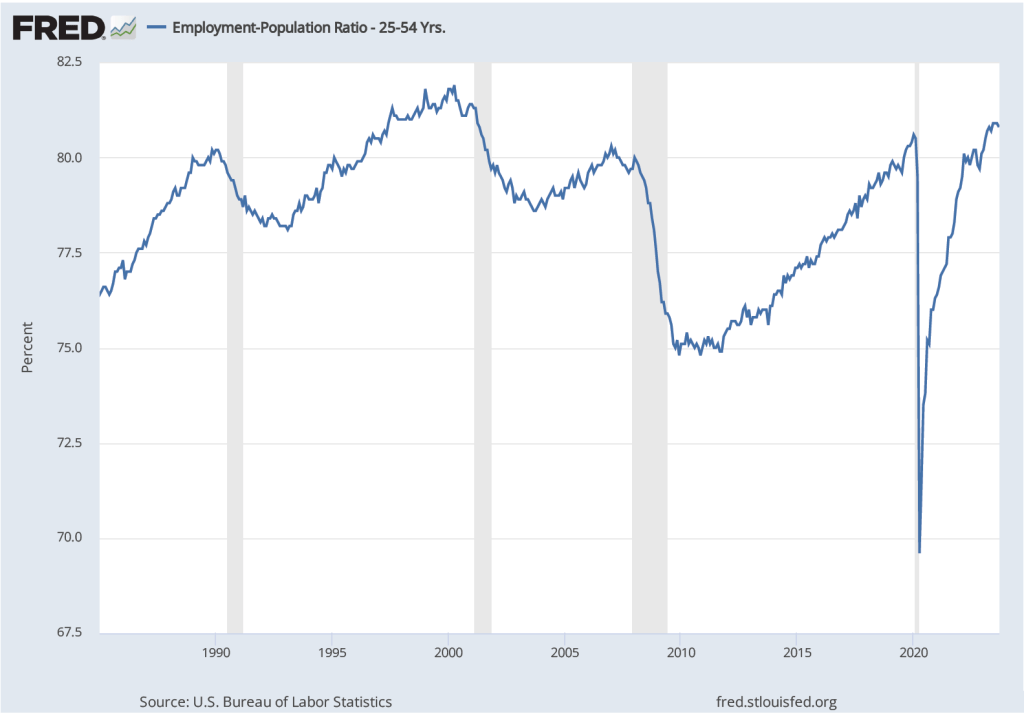
The following figure shows the employment-to-population ratio for workers ages 25 to 54—so-called prime-age workers—for the period since 1985. In September 2023, the ratio was 80.8 perccent, down slightly from 80.9 percent in August, but above the levels reached in early 2020 just before the effects of the Covid–19 pandemic were felt in the United States. The ratio was still below the record high of 81.9 percent reached in April 2000. The population of prime-age workers is about 128 million. So, if the employment-population ratio were to return to its 2000 peak, potentially another 1.3 million prime-age workers might enter the labor market. The likelihood of that happening, however, is difficult to gauge.
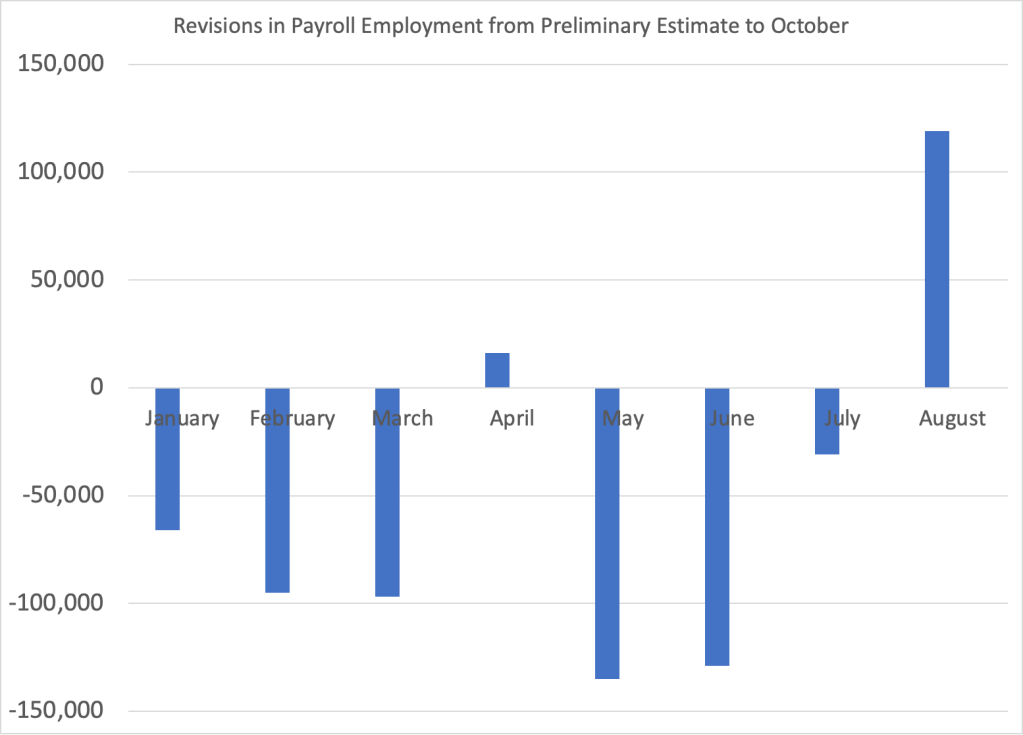
A couple of other points about the September employment report. First, it’s worth keeping in mind that the results from the establishment survey are subject to often substantial revisisons. The figure below shows the revisions the BLS has released as of October to their preliminary estimates for each month of 2023. In three of these eight months the revisions so far have been greater than 100,000 jobs. As we discuss in Macroeconomics, Chapter 9, Section 9.1 (Economics, Chapter 19, Section 19.1 and Essentials of Economics, Chapter 13, Section 13.1), the revisions that the BLS makes to its employment estimates are likely to be particularly large when the economy is about to enter a period of significantly lower or higher growth. So, the large revisions to the preliminary employment estimates in most months of 2023 may indicate that the surprisingly large preliminary estimate of a 336,000 increase in net employment will be revised lower in coming months.
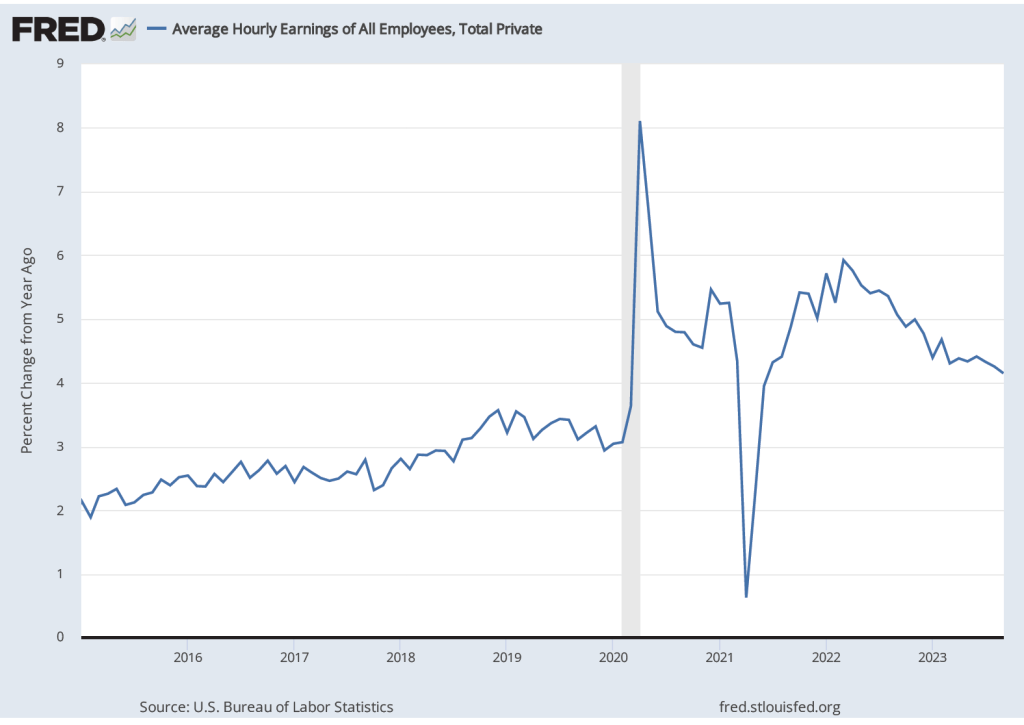
Finally, data in the employment report provides some evidence of a slowing in wage growth, despite the sharp increase in employment. The following figure shows wage inflation as measured by the percentage increase in average hourly earnings (AHE) from the same month in the previous year. The increase in September was 4.2 percent, continuing a generally downward trend since March 2022, although still somewhat above wage inflation during the pre-2020 period.
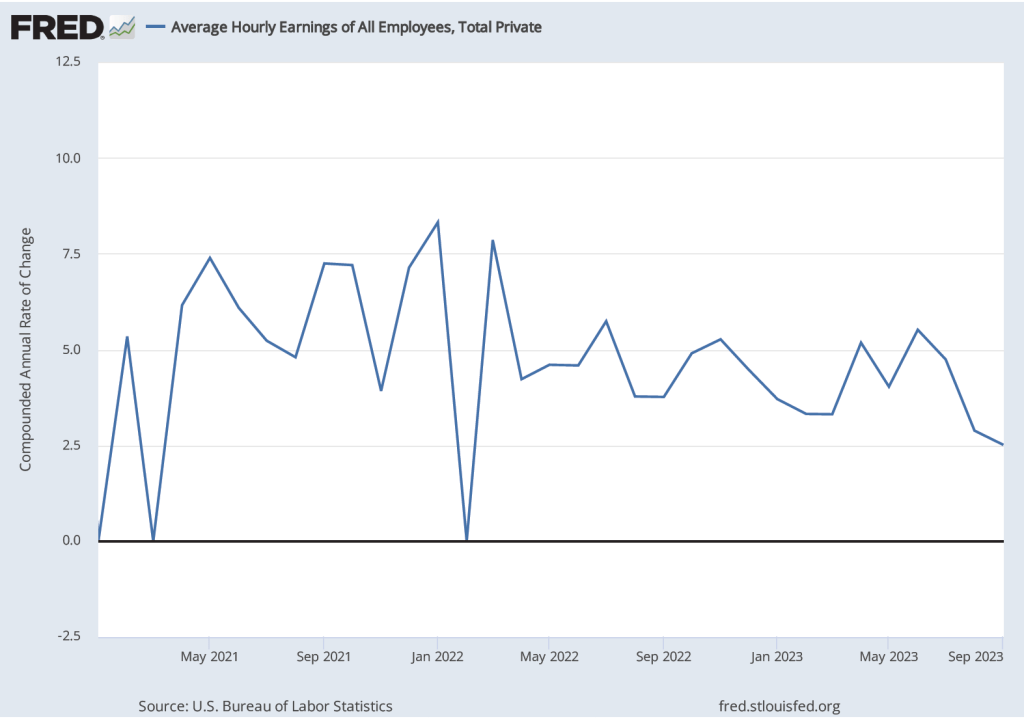
As the following figure shows, September growth in average hourly earnings measured as a compound annual growth rate was 2.5 percent, which—if sustained—would be consistent with a rate of price inflation in the range of the Fed’s 2 percent target. (The figure shows only the months since January 2021 to avoid obscuring the values for recent months by including the very large monthly increases and decrease during 2020.)
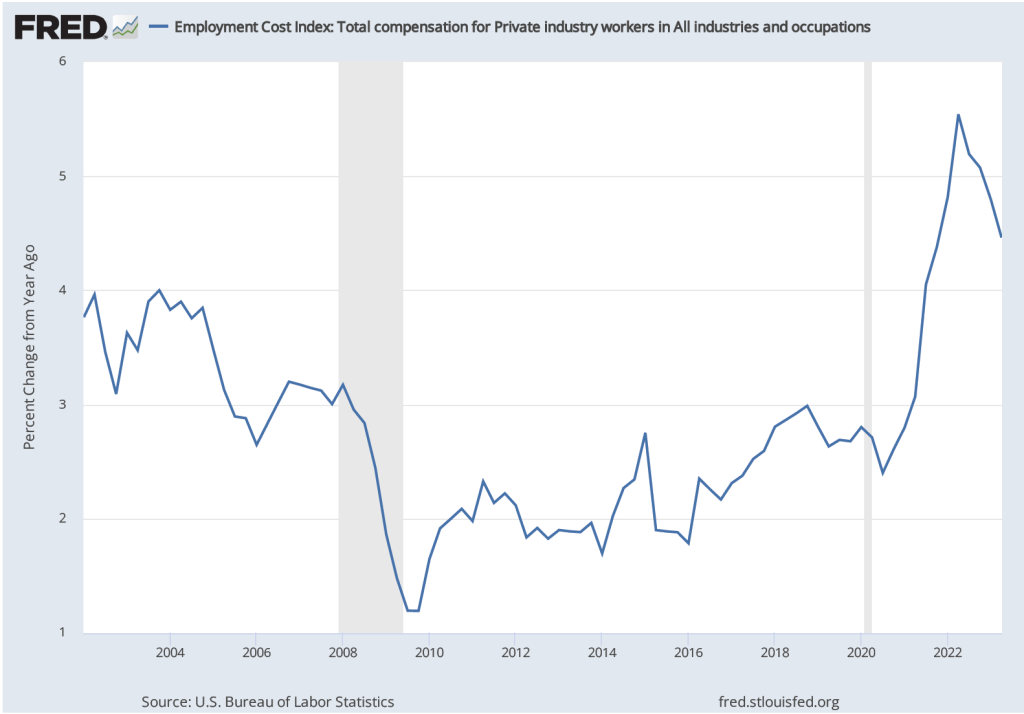
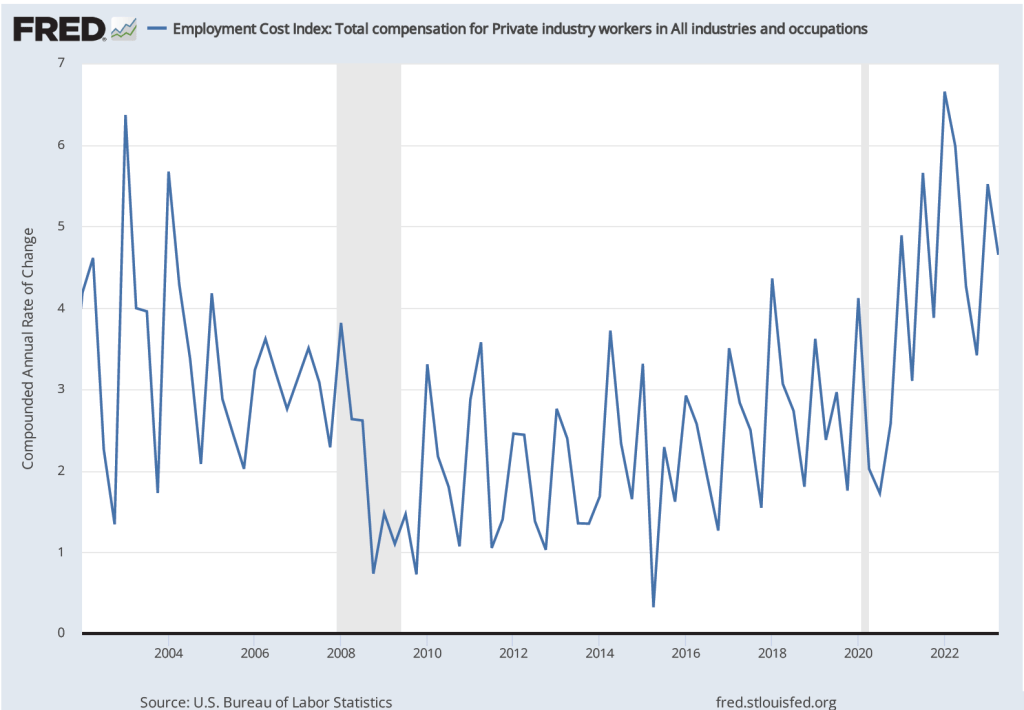
As we note in this blog post, the employment cost index (ECI), published quarterly by the BLS, measures the cost to employers per employee hour worked and can be a better measure than AHE of the labor costs employers face. The first figure shows the percentage change in ECI from the same quarter in the previous year. The second figure shows the compound annual growth rate of the ECI. Both measures show a general downward trend in the growth of labor costs, although the measures are somewhat dated because the most recent values are for the second quarter of 2023.
Ultimately, the key question is one we’ve considered in previous blog posts (most recently here) and podcasts (most recently here): Will the Fed be able to achieve a soft landing by bringing inflation down to its 2 percent target without triggering a recession? The September jobs report can be interpreted as increasing the probability of a soft landing if the slowing in wage growth is emphasized but decreasing the probability if the Fed decides that the strong employment growth is real—that is, the September increase is not likely to be revised sharply lower in coming months—and requires additional increases in the target for the federal funds rate. It’s worth mentioning, of course, that factors over which the Fed has no control, such as a federal government shutdown, rising oil prices, or uncertainty resulting from the attack on Israel by Hamas, will also affect the likelihood of a soft landing.
During the recovery from the Covid–19 pandemic, inflation as measured by the personal consumption expenditures (PCE) price index, first rose above the Federal Reserve’s target annual inflation rate of 2 percent in March 2021. Many economists inside and outside of the Fed believed the increase in inflation would be transitory because it was thought to be mainly the result of supply chain problems and an initial burst of spending as business lockdowns were ended or mitigated in most areas.
Accordingly, the Federal Open Market Committee (FOMC) kept its target for the federal funds rate at effectively zero (a range of 0 to 0.25 percent) until March 2022 and continued its quantitative easing (QE) program of buying long-term Treasury bonds and mortgage-backed securities (MBS) until that same month.
As the following figure shows, by March 2022 inflation had been well above the FOMC’s target for a year. The Fed responded by raising its target for the federal funds rate and switched from QE to quantitative tightening (QT). Although some supply chain problems were still contributing to the high inflation rate during the spring of 2022, the main driver appeared to be very expansionary monetary and fiscal policies. (This blog post from May 2021 has links to contributions to the debate over macro policy at the time. Glenn’s interview that month with the Financial Times can be found here. In November 2022, Glenn argued that overly expansionary fiscal policy was the main driver of inflation in this op-ed in the Financial Times (subscription or registration may be required).We discuss inconsistencies in the Fed’s forecasts of unemployment and inflation here. And in this post we discuss the question of whether the Fed made a mistake in not attempting to preempt inflation before it accelerated.)
Since March 2022, the FOMC has raised its target for the federal funds rate multiple times. In February 2023, the target was a range of 4.50 to 4.75 percent. Longer-term interest rates have also increased. In particular, the average interest rate on residential mortgage loans increased from 3 percent in March 2022 to 7 percent in November 2022, before falling back to around 6 percent in February 2023. In the fall of 2022, there was optimism among some economists that the Fed had succeeded in slowing the economy enough to put inflation on a path back to its 2 percent target. Although many economists had expected that inflation would only return to the target if the U.S. economy experienced a recession—labeled a hard landing—the probability that inflation could be reduced without a recession—labeled a soft landing—appeared to be increasing.
Economic data for January 2023 made a soft landing seem less likely. Consumer spending remained above its trend from before the pandemic, employment increases were unexpectedly high, and inflation reversed its downward trend. A continuation of low rates of unemployment and high rates of inflation wasn’t consistent with either a hard landing or a soft landing. Some observers, particularly in Wall Street financial firms, began describing the situation as no landing. But given the Fed’s strong commitment to returning to its 2 percent target, the no landing scenario couldn’t persist indefinitely.
Many investors had anticipated that the FOMC would end its increases in the federal funds target by mid-2023 and would have made one or more cuts to the target by the end of the year, but that outcome now seems unlikely. The FOMC had increased the federal funds target by only 0.25 percent at its February meeting but many economists now expected that it would announce a 0.50 percent increase at its next meeting on March 21 and 22. Unfortunately, the odds of a hard landing seem to be increasing.
A couple of notes: Although there are multiple ways of measuring inflation, the percentage increase in the PCE is the formal way in which the FOMC determines whether it is hitting its inflation target. To judge what the underlying inflation is—in other words, the inflation rate likely to persist in at least the near future—many economists look at core inflation. In the earlier figure we show movements in core inflation as measured by the PCE excluding prices of food and energy. Note that over the period shown PCE and core PCE follow the same pattern, although core PCE inflation begins to moderate earlier than does core PCE.
Some economists use other adjustments to PCE or to the consumer price index (CPI) in an attempt to better measure underlying inflation. For instance, housing rents and new and used car prices have been particularly volatile since early 2020, so some economists calculate PCE or CPI excluding those prices, as well as food and energy prices. As we discuss in this blog post from last September some economists prefer median CPI as the best measure of underlying inflation. (We discuss some of the alternative ways of measuring inflation in Macroeconomics, Chapter 15, Section 15.5 and Economics, Chapter 25, Section 25.5.) Nearly all these alternative measures of inflation indicated that the moderation in inflation that began in the summer of 2022 had ended in January 2023. So, choosing among measures of underlying inflation wasn’t critical to understanding the current path of inflation.
Finally, the inflation, employment, and output measures that in January seemed to show that the U.S. economy was still in a strong expansion and that the inflation rate may have ticked up are all seasonally adjusted. Seasonal adjustment factors are applied to the raw (unadjusted) data to account for regular seasonal fluctuations in the series. For instance, unadjusted employment declined in January as measured by both the household and establishment series. Applying the seasonal adjustment factors to the data resulted in the actual decline in employment from December to January turning into an adjusted increase. In other words, employment declined by less than it typically does, so on a seasonally adjusted basis, the Bureau of Labor Statistics reported that it had increased. Seasonal adjustments for the holiday season may be distorted, however, because the 2020–2021 and 2021–2022 holiday seasons occurred during upsurges in Covid. Whether the reported data for January 2023 will be subject to significant revisions when the seasonal adjustments factors are subsequently revised remains to be seen. The latest BLS employment report, showing seasonally adjusted and not seasonally adjusted data, can be found here.
On September 16, 2022 an article in the Wall Street Journal had the headline: “Economic Worries, Weak FedEx Results Push Stocks Lower.” Another article in the Wall Street Journal noted that: “The company’s downbeat forecasts, announced Thursday, intensified investors’ macroeconomic worries.”
Why would the news that FedEx had lower revenues than expected during the preceding weeks cause a decline in stock market indexes like the Dow Jones Industrial Average and the S&P 500? As the article explained: “Delivery companies [such as FedEx and its rival UPS) are the proverbial canary in the coal mine for the economy.” In other words, investors were using FedEx’s decline in revenue as a leading indicator of the business cycle. A leading indicator is an economic data series—in this case FedEx’s revenue—that starts to decline before real GDP and employment in the months before a recession and starts to increase before real GDP and employment in the months before a recession reaches a trough and turns into an expansion.
So, investors were afraid that FedEx’s falling revenue was a signal that the U.S. economy would soon enter a recession. And, in fact, FedEx CEO Raj Subramaniam was quoted as believing that the global economy would fall into a recession. As firms’ profits decline during a recession so, typically, do the prices of the firms’ stock. (As we discuss in Macroeconomics, Chapter 6, Section 6.2 and in Economics, Chapter 8, Section 8.2, stock prices reflect investors’ expectations of the future profitability of the firms issuing the stock.)
Monitoring fluctuations in FedEx’s revenue for indications of the future course of the economy is nothing new. When Alan Greenspan was chair of the Federal Reserve from 1987 to 2006, he spoke regularly with Fred Smith, the founder of FedEx and at the time CEO of the firm. Greenspan believed that changes in the number of packages FedEx shipped gave a good indication of the overall state of the economy. FedEx plays such a large role in moving packages around the country that most economists agree that there is a close relationship between fluctuations in FedEx’s business and fluctuations in GDP. Some Wall Street analysts refer to this relationship as the “FedEx Indicator” of how the economy is doing.
In September 2022, the FedEx indicator was blinking red. But the U.S. economy is complex and fluctuations in any indicator can sometimes provide an inaccurate forecast of when a recession will begin or end. And, in fact, some investment analysts believed that problems at FedEx may have been due as much to mistakes the firms’ managers had made as to general problems in the economy. As one analyst put it: “We believe a meaningful portion of FedEx’s missteps here are company-specific.”
At this point, Fed Chair Jerome Powell and the other members of the Federal Open Market Committee are still hoping that they can bring the economy in for a soft landing—bringing inflation down closer to the Fed’s 2 percent target, without bringing on a recession—despite some signals, like those being given by the FedEx indicator, that the probability of the United States entering a recession was increasing.
Sources: Will Feuer, “FedEx Stock Tumbles More Than 20% After Warning on Economic Trends,” Wall Street Journal, September 16, 2022; Alex Frangos and Hannah Miao, “ FedExt Stock Hit by Profit Warning; Rivals Also Drop Amid Recession Fears,” Wall Street Journal, September 16, 2022; Richard Clough, “FedEx has Biggest Drop in Over 40 Years After Pulling Forecast,” bloomberg.com, September 16, 2022; and David Gaffen, “The FedEx Indicator,” Wall Street Journal, February 20, 2007.
On Thursday morning, April 28, the Bureau of Economic Analysis (BEA) released its “advance” estimate for the change in real GDP during the first quarter of 2022. As shown in the first line of the following table, somewhat surprisingly, the estimate showed that real GDP had declined by 1.4 percent during the first quarter. The Federal Reserve Bank of Atlanta’s “GDP Now” forecast had indicated that real GDP would increase by 0.4 percent in the first quarter. Earlier in April, the Wall Street Journal’s panel of academic, business, and financial economists had forecast an increase of 1.2 percent. (A subscription may be required to access the forecast data from the Wall Street Journal’s panel.)
Do the data on real GDP from the first quarter of 2022 mean that U.S. economy may already be in recession? Not necessarily, for several reasons:
First, as we note in the Apply the Concept, “Trying to Hit a Moving Target: Making Policy with ‘Real-Time’ Data,” in Macroeconomics, Chapter 15, Section 15.3 (Economics, Chapter 25, Section 25.3): “The GDP data the BEA provides are frequently revised, and the revisions can be large enough that the actual state of the economy can be different for what it at first appears to be.”
Second, even though business writers often define a recession as being at least two consecutive quarters of declining real GDP, the National Bureau of Economic Research has a broader definition: “A recession is a significant decline in activity across the economy, lasting more than a few months, visible in industrial production, employment, real income, and wholesale-retail trade.” Particularly given the volatile movements in real GDP during and after the pandemic, it’s possible that even if real GDP declines during the second quarter of 2022, the NBER might not decide to label the period as being a recession.
Third, and most importantly, there are indications in the underlying data that the U.S. economy performed better during the first quarter of 2022 than the estimate of declining real GDP would indicate. In a blog post in January discussing the BEA’s advance estimate of real GDP during the fourth quarter of 2021, we noted that the majority of the 6.9 percent increase in real GDP that quarter was attributable to inventory accumulation. The earlier table indicates that the same was true during the first quarter of 2022: 60 percent of the decline in real GDP during the quarter was the result of a 0.84 decline in inventory investment.
We don’t know whether the decline in inventories indicates that firms had trouble meeting demand for goods from current inventories or whether they decided to reverse some of the increases in inventories from the previous quarter. With supply chain disruptions continuing as China grapples with another wave of Covid-19, firms may be having difficulty gauging how easily they can replace goods sold from their current inventories. Note the corresponding point that the decline in sales of domestic product (line 2 in the table) was smaller than the decline in real GDP.
The table below shows changes in the components of real GDP. Note the very large decline exports and in purchases of goods and services by the federal government. (Recall from Macroeconomics, Chapter 16, Section 16.1, the distinction between government purchases of goods and services and total government expenditures, which include transfer payments.) The decline in federal defense spending was particularly large. It seems likely from media reports that the escalation of Russia’s invasion of Ukraine will lead Congress and President Biden to increase defense spending.
Notice also that increases in the non-government components of aggregate demand remained fairly strong: personal consumption expenditures increased 2.7 percent, gross private domestic investment increased 2.3 percent, and imports surged by 17.7 percent. These data indicate that private demand in the U.S. economy remains strong.
So, should we conclude that the economy will shrug off the decline in real GDP during the first quarter and expand during the remainder of the year? Unfortunately, there are still clouds on the horizon. First, there are the difficult to predict effects of continuing supply chain problems and of the war in Ukraine. Second, the Federal Reserve has begun tightening monetary policy. Whether Fed Chair Jerome Powell will be able to bring about a soft landing, slowing inflation significantly while not causing a large jump in unemployment, remains the great unknown of economic policy. Finally, if high inflation rates persist, households and firms may respond in ways that are difficult to predict and, may, in particular decide to reduce their spending from the current strong levels.
It now seems clear that the new monetary policy strategy the Fed announced in August 2020 was a decisive break with the past in one respect: With the new strategy, the Fed abandoned the approach dating to the 1980s of preempting inflation. That is, the Fed would no longer begin raising its target for the federal funds rate when data on unemployment and real GDP growth indicated that inflation was likely to rise. Instead, the Fed would wait until inflation had already risen above its target inflation rate.
Since 2012, the Fed has had an explicit inflation target of 2 percent. As we discussed in a previous blog post, with the new monetary policy the Fed announced in August 2020, the Fed modified how it interpreted its inflation target: “[T]he Committee seeks to achieve inflation that averages 2 percent over time, and therefore judges that, following periods when inflation has been running persistently below 2 percent, appropriate monetary policy will likely aim to achieve inflation moderately above 2 percent for some time.”
The Fed’s new approach is sometimes referred to as average inflation targeting (AIT) because the Fed attempts to achieve its 2 percent target on average over a period of time. But as former Fed Vice Chair Richard Clarida discussed in a speech in November 2020, the Fed’s monetary policy strategy might be better called a flexible average inflation target (FAIT) approach rather than a strictly AIT approach. Clarida noted that the framework was asymmetric, meaning that inflation rates higher than 2 percent need not be offset with inflation rates lower than 2 percent: “The new framework is asymmetric. …[T]he goal of monetary policy … is to return inflation to its 2 percent longer-run goal, but not to push inflation below 2 percent.” And: “Our framework aims … for inflation to average 2 percent over time, but it does not make a … commitment to achieve … inflation outcomes that average 2 percent under any and all circumstances ….”
Inflation began to increase rapidly in mid-2021. The following figure shows three measure of inflation, each calculated as the percentage change in the series from the same month in the previous year: the consumer price index (CPI), the personal consumption expenditure (PCE) price index, and the core PCE—which excludes the prices of food and energy. Inflation as measured by the CPI is sometimes called headline inflation because it’s the measure of inflation that most often appears in media stories about the economy. The PCE is a broader measure of the price level in that it includes the prices of more consumer goods and services than does the CPI. The Fed’s target for the inflation rate is stated in terms of the PCE. Because prices of food and inflation fluctuate more than do the prices of other goods and services, members of the Fed’s Federal Open Market Committee (FOMC) generally consider changes in the core PCE to be the best measure of the underlying rate of inflation.
The figure shows that for most of the period from 2002 through early 2021, inflation as measured by the PCE was below the Fed’s 2 percent target. Since that time, inflation has been running well above the Fed’s target. In February 2022, PCE inflation was 6.4 percent. (Core PCE inflation was 5.4 percent and CPI inflation was 7.9 percent.) At its March 2022 meeting the FOMC begin raising its target for the federal funds rate—well after the increase in inflation had begun. The Fed increased its target for the federal funds rate by 0.25 percent, which raised the target from 0 to 0.25 percent to 0.25 to 0.50 percent.
Should the Fed have taken action to reduce inflation earlier? To answer that question, it’s first worth briefly reviewing Fed policy during the Great Inflation of 1968 to 1982. In the late 1960s, total federal spending grew rapidly as a result of the Great Society social programs and the war in Vietnam. At the same time, the Fed increased the rate of growth of the money supply. The result was an end to the price stability of the 1952-1967 period during which the annual inflation rate had averaged only 1.6 percent.
The 1973 and 1979 oil price shocks also contributed to accelerating inflation. Between January 1974 and June 1982, the annual inflation rate averaged 9.3 percent. This was the first episode of sustained inflation outside of wartime in U.S. history—until now. Although the oil price shocks and expansionary fiscal policy contributed to the Great Inflation, most economists, inside and outside of the Fed, eventually concluded that Fed policy failures were primarily responsible for inflation becoming so severe.
The key errors are usually attributed to Arthur Burns, who was Fed Chair from January 1970 to March 1978. Burns, who was 66 at the time of his appointment, had made his reputation for his work on business cycles, mostly conducted prior to World War II at the National Bureau of Economic Research. Burns was skeptical that monetary policy could have much effect on inflation. He was convinced that inflation was mainly the result of structural factors such as the power of unions to push up wages or the pricing power of large firms in concentrated industries.
Accordingly, Burns was reluctant to raise interest rates, believing that doing so hurt the housing industry without reducing inflation. Burns testified to Congress that inflation “poses a problem that traditional monetary and fiscal remedies cannot solve as quickly as the national interest demands.” Instead of fighting inflation with monetary policy he recommended “effective controls over many, but by no means all, wage bargains and prices.” (A collection Burns’s speeches can be found here.)
Few economists shared Burns’s enthusiasm for wage and price controls, believing that controls can’t end inflation, they can only temporarily reduce it while causing distortions in the economy. (A recent overview of the economics of price controls can be found here.) In analyzing this period, economists inside and outside the Fed concluded that to bring the inflation rate down, Burns should have increased the Fed’s target for the federal funds rate until it was higher than the inflation rate. In other words, the real interest rate, which equals the nominal—or stated—interest rate minus the inflation rate, needed to be positive. When the real interest rate is negative, a business may, for example, pay 6% on a bond when the inflation rate is 10%, so they’re borrowing funds at a real rate of −4%. In that situation, we would expect borrowing to increase, which can lead to a boom in spending. The higher spending worsens inflation.
Because Burns and the FOMC responded only slowly to rising inflation, workers, firms, and investors gradually increased their expectations of inflation. Once higher expectation inflation became embedded, or entrenched, in the U.S. economy it was difficult to reduce the actual inflation rate without increasing the target for the federal funds rate enough to cause a significant slowdown in the growth of real GDP and a rise in the unemployment rate. As we discuss in Macroeconomics, Chapter 17, Sections 17.2 and 17.3 (Economics, Chapter 27, Sections 27.2 and 27.3), the process of the expected inflation rate rising over time to equal the actual inflation rate was first described in research conducted separately by Nobel Laureates Milton Friedman and Edmund Phelps during the 1960s.
An implication of Friedman and Phelps’s work is that because a change in monetary policy takes more than a year to have its full effect on the economy, if the Fed waits until inflation has already increased, it will be too late to keep the higher inflation rate from becoming embedded in interest rates and long-term labor and raw material contracts.
Paul Volcker, appointed Fed chair by Jimmy Carter in 1979, showed that, contrary to Burns’s contention, monetary policy could, in fact, deal with inflation. By the time Volcker became chair, inflation was above 11%. By raising the target for the federal funds rate to 22%—it was 7% when Burns left office—Volcker brought the inflation rate down to below 4%, but only at the cost of a severe recession during 1981–1982, during which the unemployment rate rose above 10 percent for the first time since the Great Depression of the 1930s. Note that whereas Burns had largely failed to increase the target for the federal funds as rapidly as inflation had increased—resulting in a negative real federal funds rate—Volcker had raised the target for the federal funds rate above the inflation rate—resulting in a positive real federal funds rate.
Because the 1981–1982 recession was so severe, the inflation rate declined from above 11 percent to below 4 percent. In Chapter 17, Figure 17.10 (reproduced below), we plot the course of the inflation and unemployment rates from 1979 to 1989.
Caption: Under Chair Paul Volcker, the Fed began fighting inflation in 1979 by reducing the growth of the money supply, thereby raising interest rates. By 1982, the unemployment rate had risen to 10 percent, and the inflation rate had fallen to 6 percent. As workers and firms lowered their expectations of future inflation, the short-run Phillips curve shifted down. The adjustment in expectations allowed the Fed to switch to an expansionary monetary policy, which by 1987 brought unemployment back to the natural rate of unemployment, with an inflation rate of about 4 percent. The orange line shows the actual combinations of unemployment and inflation for each year from 1979 to 1989.
The Fed chairs who followed Volcker accepted the lesson of the 1970s that it was important to head off potential increases in inflation before the increases became embedded in the economy. For instance, in 2015, then Fed Chair Janet Yellen in explaining why the FOMC was likely to raise to soon its target for the federal funds rate noted that: “A substantial body of theory, informed by considerable historical evidence, suggests that inflation will eventually begin to rise as resource utilization continues to tighten. It is largely for this reason that a significant pickup in incoming readings on core inflation will not be a precondition for me to judge that an initial increase in the federal funds rate would be warranted.”
Between 2015 and 2018, the FOMC increased its target for the federal funds rate nine times, raising the target from a range of 0 to 0.25 percent to a range of 2.25 to 2.50 percent. In 2018, Raphael Bostic, president of the Federal Reserve Bank of Atlanta justified these rate increases by noting that “… we shouldn’t forget that [the Fed’s] credibility [with respect to keeping inflation low] was hard won. Inflation expectations are reasonably stable for now, but we know little about how far the scales can tip before it is no longer so.”
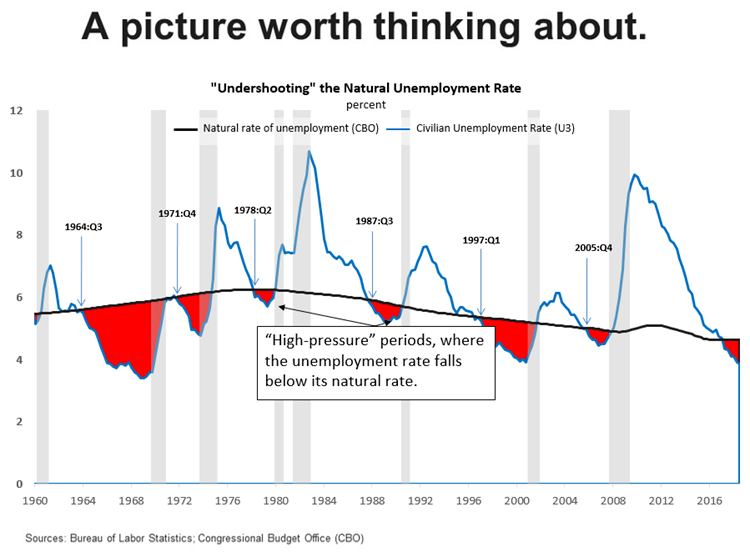
He used the following figure to illustrate his point.
Bostic interpreted the figure as follows:
“[The red areas in the figure are] periods of time when the actual unemployment rate fell below what the U.S. Congressional Budget Office now estimates as the so-called natural rate of unemployment. I refer to these episodes as “high-pressure” periods. Here is the punchline. Dating back to 1960, every high-pressure period ended in a recession. And all but one recession was preceded by a high-pressure period….
I think a risk management approach requires that we at least consider the possibility that unemployment rates that are lower than normal for an extended period are symptoms of an overheated economy. One potential consequence of overheating is that inflationary pressures inevitably build up, leading the central bank to take a much more “muscular” stance of policy at the end of these high-pressure periods to combat rising nominal pressures. Economic weakness follows [resulting typically, as indicated in the figure by the gray band, in a recession].”
By July 2019, a majority of the members of the FOMC, including Chair Powell, had come to believe that with no sign of inflation accelerating, they could safely cut the federal funds rate. But they had not yet explicitly abandoned the view that the FOMC should act to preempt increases in inflation. The formal change came in August 2020 when, as discussed earlier, the FOMC announced the new FAIT.
At the time the FOMC adopted its new monetary policy strategy, most members expected that any increase in inflation owing to problems caused by the Covid-19 pandemic—particularly the disruptions in supply chains—would be transitory. Because inflation has proven to be more persistent than Fed policymakers and many economists expected, two aspects of the FAIT approach to monetary policy have been widely discussed: First, the FOMC did not explicitly state by how much inflation can exceed the 2 percent target or for how long it needs to stay there before the Fed will react. The failure to elaborate on this aspect of the policy has made it more difficult for workers, firms, and investors to gauge the Fed’s likely reaction to the acceleration in inflation that began in the spring of 2021. Second, the FOMC’s decision to abandon the decades-long policy of preempting inflation may have made it more difficult to bring inflation down to the 2 percent target without causing a recession.
Federal Reserve Governor Lael Brainard recently remarked that “it is of paramount importance to get inflation down” and some Fed policymakers believe that the FOMC will have to begin increasing its target for the federal funds rate more aggressively. (The speech in which Governor Brainard discusses her current thinking on monetary policy can be found here.) For instance James Bullard, president of the Federal Reserve Bank of St. Louis, has argued in favor of raising the target to above 3 percent this year. With the Fed’s preferred measure of inflation running above 5 percent, it would take substantial increases int the target to achieve a positive real federal funds rate.
It is an open question whether Jerome Powell finds himself in a position similar to that of Paul Volcker in 1979: Rapid increases in interest rates may be necessary to keep inflation from accelerating, but doing so risks causing a recession. In a recent speech (found here), Powell pledged that: “We will take the necessary steps to ensure a return to price stability. In particular, if we conclude that it is appropriate to move more aggressively by raising the federal funds rate by more than 25 basis points at a meeting or meetings, we will do so.”
But Powell argued that the FOMC could achieve “a soft landing, with inflation coming down and unemployment holding steady” even if it is forced to rapidly increase its target for the federal funds rate:
“Some have argued that history stacks the odds against achieving a soft landing, and point to the 1994 episode as the only successful soft landing in the postwar period. I believe that the historical record provides some grounds for optimism: Soft, or at least softish, landings have been relatively common in U.S. monetary history. In three episodes—in 1965, 1984, and 1994—the Fed raised the federal funds rate significantly in response to perceived overheating without precipitating a recession.”
Some economists have been skeptical that a soft landing is likely. Harvard economist and former Treasury Secretary Lawrence Summers has been particularly critical of Fed policy, as in this Twitter thread. Summers concludes that: “I am apprehensive that we will be disappointed in the years ahead by unemployment levels, inflation levels, or both.” (Summers and Harvard economist Alex Domash provide an extended discussion in a National Bureau of Economic Research Working Paper found here.)
Clearly, we are in a period of great macroeconomic uncertainty.