Image of the MacBook Neo from apple.com
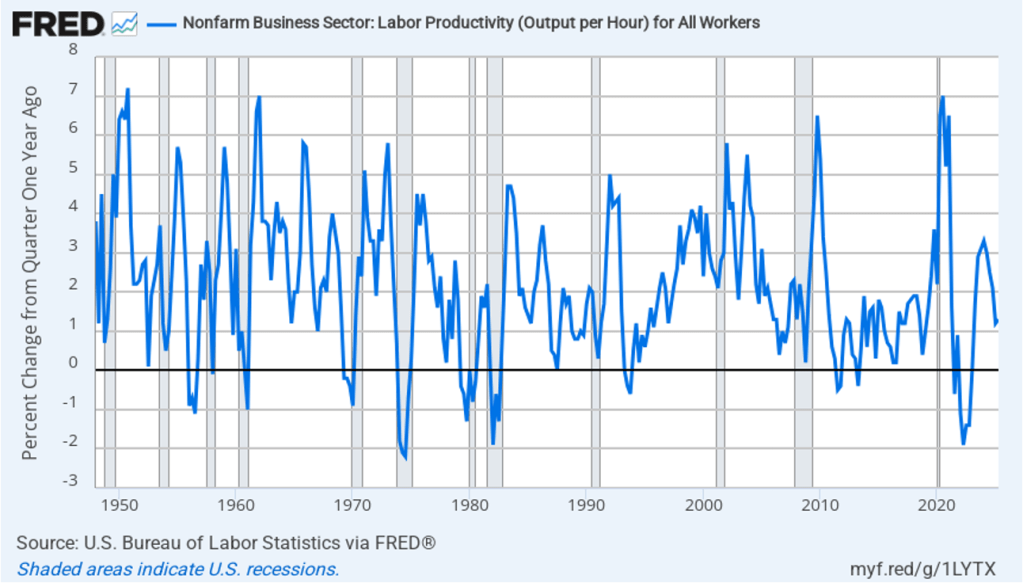
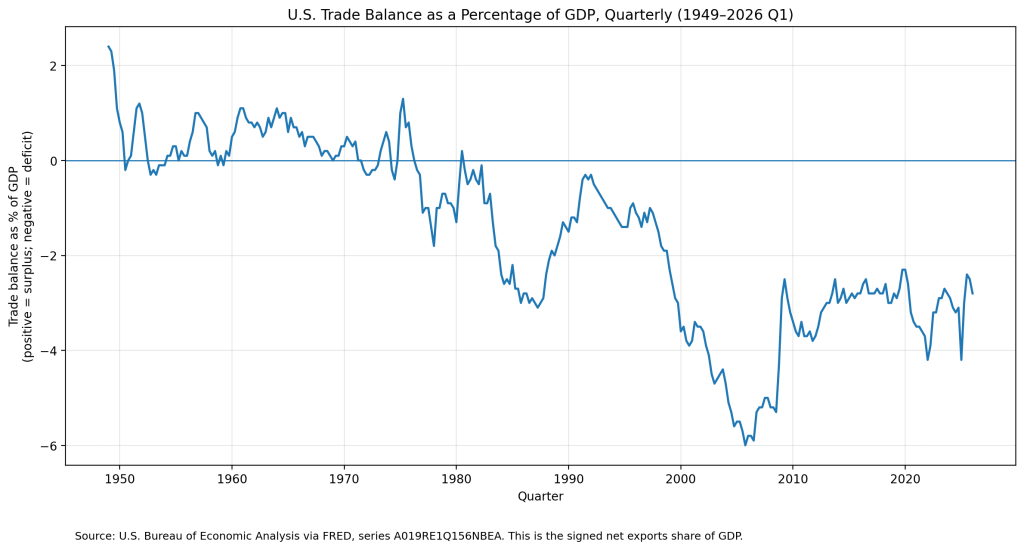
The United States hasn’t exported more goods and services than its imported since 1975. The following figure shows the U.S. trade deficits since 1949 as a percentage of GDP. (In this figure, we’re measuring the trade balance as net exports rather than the trade balance as reported in the balance of payment accounts. The two measures are highly correlated.)
As we discuss in Macroeconomics, Chapter 18 (Economics, Chapter 28), a trade deficit is driven by the relationship between a country’s national saving and domestic investment rather than by the competitiveness of a country’s exports or by the trade agreements a country has with its trading partners.
Clearly, though, many politicians see a trade deficit as a problem. Some politicians have argued that the U.S. trade deficit would shrink if more of the manufactured goods Americans consume were produced in the United States. Would it be possible, for example, to produce more consumer electronics in the United States? A few months ago, Apple stopped assembling units of the Mac Pro, its high-end, professional workstation computer, at a facility in Austin, Texas. More recently, Apple announced that it would begin assembling its Mac Mini, a compact desktop computer that lacks a keyboard and a monitor, in a new factory in Houston. These examples indicate that Apple can produce electronic products in the United States. But the number of Mac Pros or Mac Minis Apple sells each year is very small compared with the estimated 248 million iPhones it sold in 2025.
In March, Apple introduced the MacBook Neo. At a price of $599 ($499 if you are a college student or faculty member), the Neo is Apple’s first entry into the low-priced laptop market that had been dominated by the Google Chromebook. By the end of April, sales were running far above Apple’s initial forecasts and the firm was planning to double production of the Neo from 5 million units to 10 million—all of which would be assembled in China or Vietnam.
Why doesn’t Apple assemble the Neo in the United States? There are several reasons, but the most important is that the Neo is Apple’s first entry into the low-priced laptop market that is now dominated by Google’s Chromebook—all of which are assembled overseas. Apple is able to price the Neo at $599 only if it keeps its production costs very low. Workers who assemble electronic products like laptops require substantial training. Firms such as Foxconn and Quanta Computer have been assembling electronic products for many years in countries such as China and Vietnam. As a result, these countries have large numbers of workers experienced in assembling electronic products. U.S.-based firms have many fewer workers with this experience.
Assembly lines for electronic products need to be flexible to respond quickly when firms introduce new models like the Neo. So, in addition to hiring hundreds of thousands of workers to work on assembly lines, Foxconn, Quanta, and other firms operating in China, India, and Vietnam hire thousands of engineers. Typically, these engineers do not have college degrees, but they have sufficient training to rapidly redesign and reconfigure assembly lines to produce new models. In 2010, when President Barack Obama pressed Steve Jobs, the late Apple CEO, to produce iPhones in the United States, Jobs stated that he would need 30,000 such engineers if Apple were to make iPhones in the United States, but “you can’t find that many in America to hire.”
In addition, wages are much higher in the United States than in China or Vietnam. Workers assembling electronic products in China earn about $6 per hour. Workers doing the same jobs in Vietnam earn only about $2 per hour. In the United States, according to the Bureau of Labor Statistics, in April 2026, production workers in computer and electronic product manufacturing were earning $39.32 per hour.
The factories that assemble Apple products in Asia typically have many suppliers located near them—a so-called supplier ecosystem. Some suppliers make components of the products—although other components are produced outside of Asia, including in the United States—as well as providing repair, maintenance, and other services to the factories. The lack of such a supplier ecosystem would make assembling Neos in the United States very difficult. According to an article in the New York Times, when Apple started producing the Mac Pro in Austin, Texas, it had trouble finding a local firm to produce the custom screws needed in assembling the computers. According to the article, “In China, Apple relied on factories that can produce vast quantities of custom screws on short notice. In Texas, … [Apple had to rely on a] 20-employee machine shop that … could produce at most 1,000 screws a day.”
Production of some electronic goods—notably computer chips—has been expanding in the United States. In 2022, Congress passed the Creating Helpful Incentives to Produce Semiconductors (CHIPS) and Science Act. The Act authorized the federal government to pay subsidies to help firms increase chip production in the United States. Intel, TSMC, Samsung, and Micron have all constructed new chip factories in the United States. As we mentioned earlier, Apple intends to assemble its Mac Mini in a new factory in Houston.
But the United States lacks a comparative advantage in the assembly of high-volume electronic products like the iPhone or MacBook Neo. So it’s unlikely that the expansion of U.S. chip production will be followed by a similar expansion in the assembly of smartphones and computers.