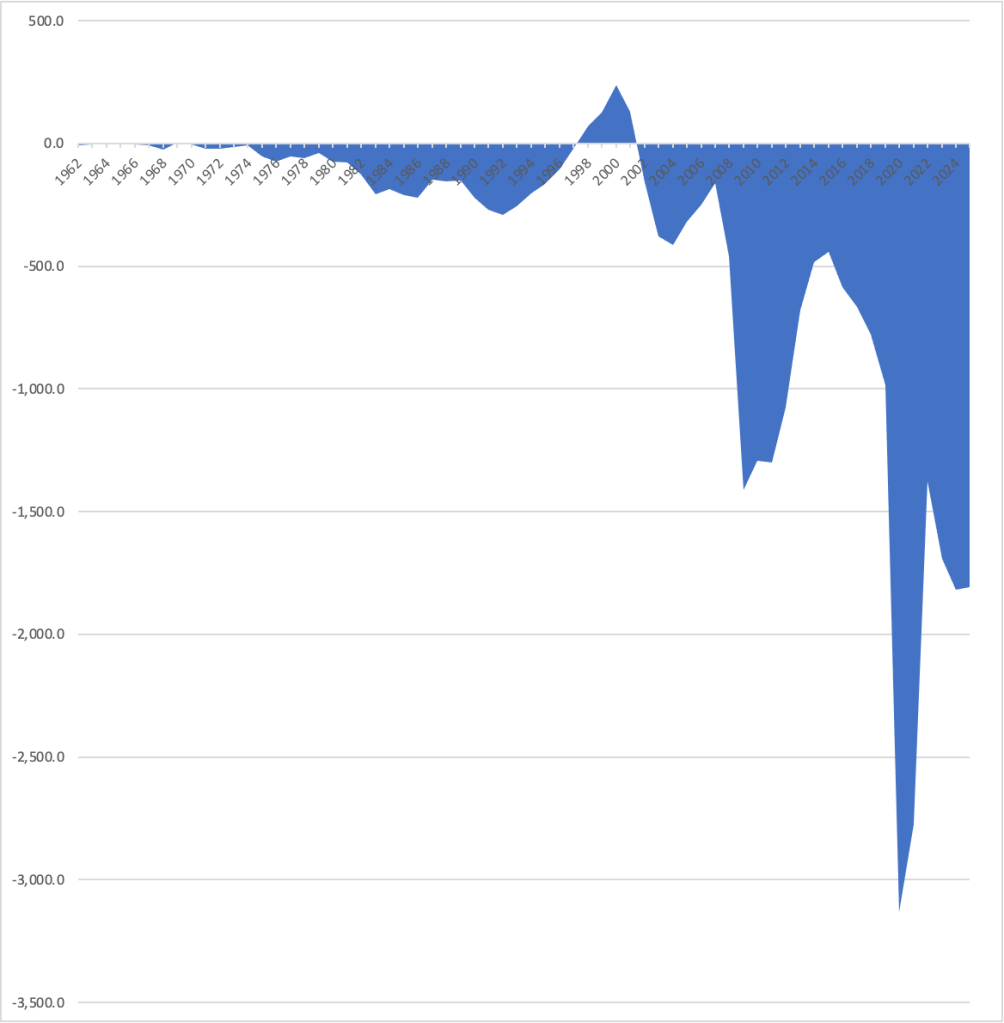
The federal government’s fiscal year runs from October 1 to September 30. Today (October 8), the Congressional Budget Office (CBO) released its estimate of the deficit for the fiscal year ending September 30, 2025. The deficit fell slightly from $1,817 billion in 2024 to $1,809 in 2025. As the following figure shows, the budget deficit in 2025 remains very large, particularly at a time when the U.S. economy is at or very close to full employment, although well below the record deficit of $3,133 billion in 2020.
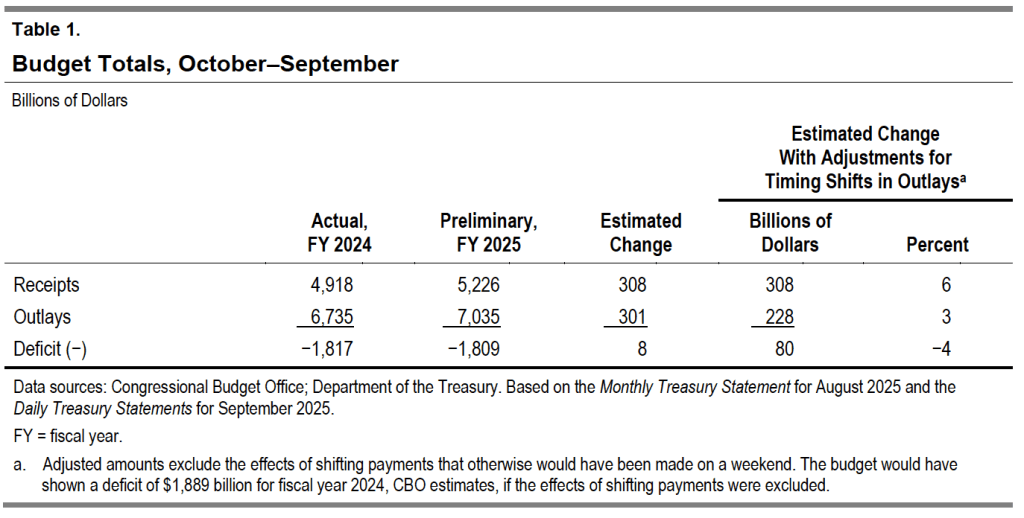
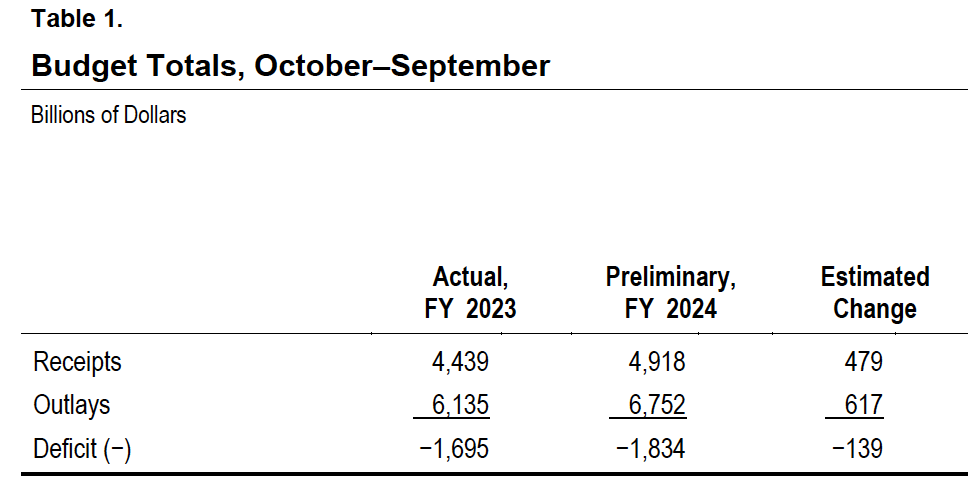
The following table from the CBO report shows that in 2025 federal receipts increased slightly more than federal outlays, leading to a slightly smaller deficit.
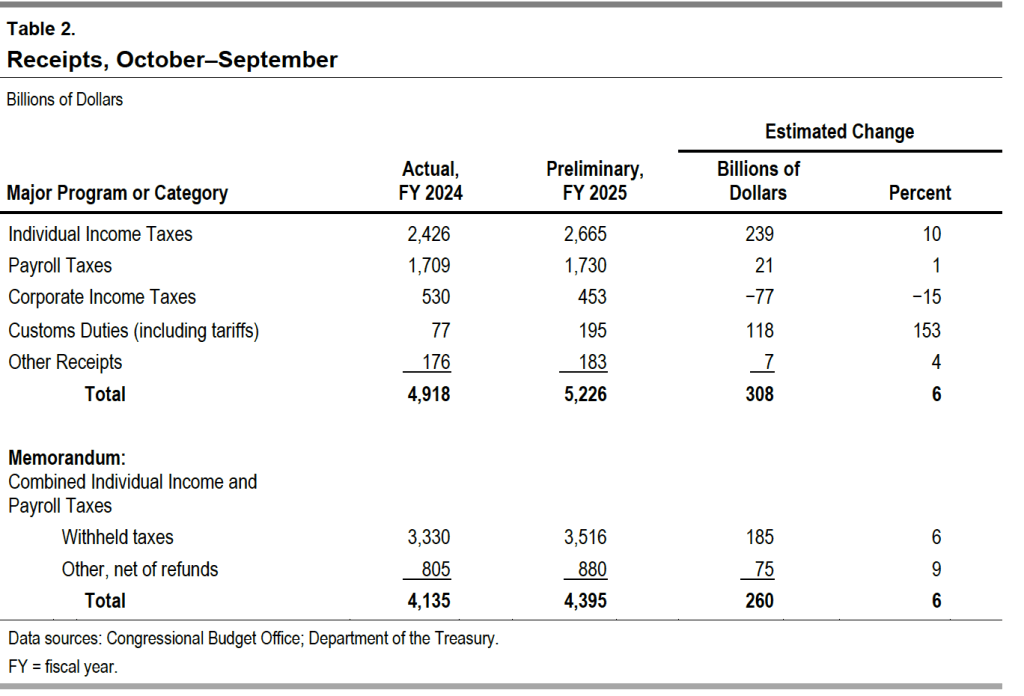
The next table shows the changes in the major categories of federal receipts. Individual income and payroll taxes—which fund the Social Security and Medicare programs, as well as the federal government’s contributions to state unemployment insurance plans—both increased, while corporate income tax receipts fell. The biggest change was in custom duties, which more than doubled following the Trump administration’s sharp increase in tariff rates beginning on April 2.
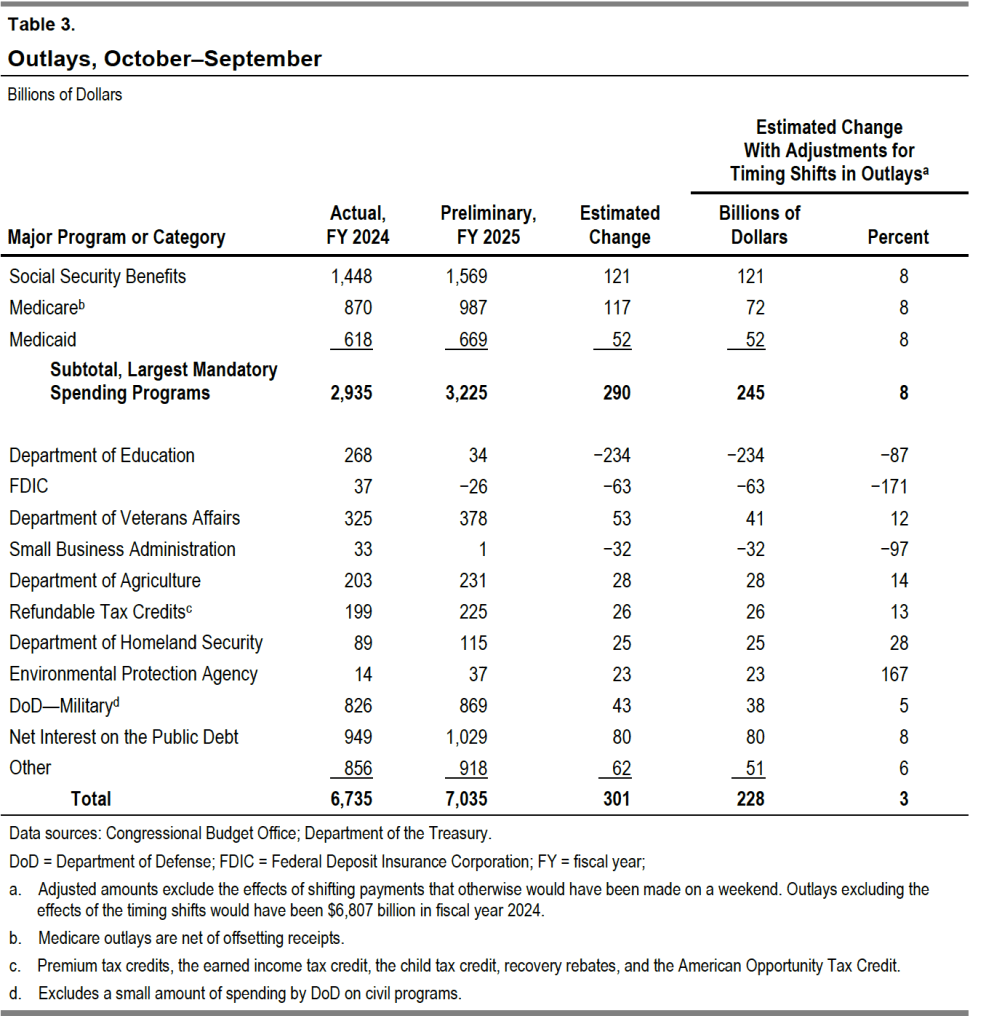
The next table shows the changes in the major categories of federal outlays. Spending on the Social Security, Medicare (health insurance for older people), and Medicaid (health insurance for lower-income people) programs continue to rapidly increase. Spending on Medicare is now more than $100 billion greater than spending on defense. Interest on the public debt continues to increase as the debt increases and interest rates remain well above their pre-2021 levels.
Logo of the Congressional Budget Office from cbo.gov.
The federal government’s fiscal year runs from October 1 to September 30 of the following calendar year. The Congressional Budget Office (CBO) estimates that the federal government’s budget deficit for fiscal 2024, which just ended, was $1.8 trillion. (The Office of Management and Budget (OMB) will release the official data on the budget later this month.)
The federal budget deficit increased by about $100 billion from fiscal 2023, although the comparison of the deficits in the two years is complicated by the question of how to account for the $333 billion in student debt cancellation that President Biden ordered (which would reduce federal revenues by that amount) but which wasn’t implemented because of a decision by the U.S. Supreme Court.
The following table from the CBO report compares federal receipts and outlays for fiscal years 2023 and 2024. Recipts increased by $479 billion from 2023 to 2024, but outlays increased by $617 billion, resulting in an increase of $139 billion in the federal budget deficit.
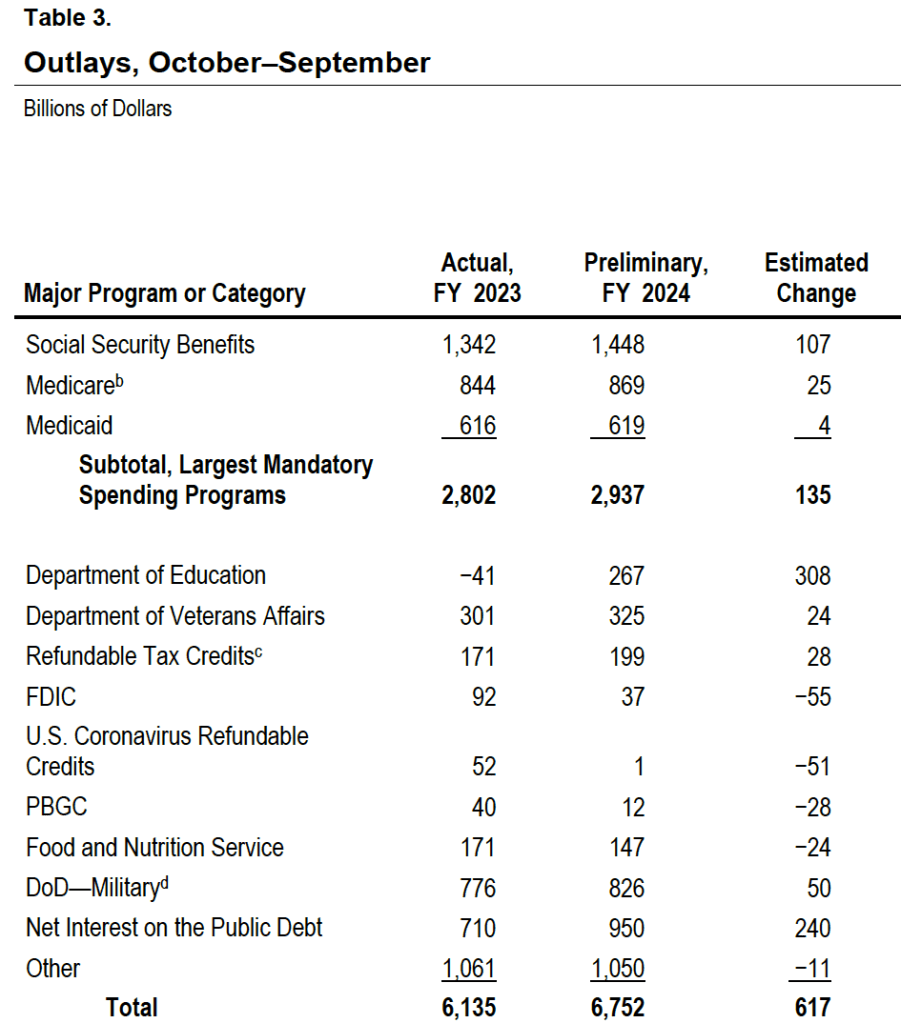
The following table shows the increases in the major spending categories in the federal budget. Spending on the Social Security, Medicare, and Medicaid programs increased by a total of $135 billion. The large increase in spending on the Department of Education is distorted by accounting for the reversal of the student debt cancellation following a Suprement Court ruling, as previously mentioned. The FDIC is the Federal Deposit Insurance Corporation, which had larger than normal expenditures in 2023 due the failure of several regional banks. (We discuss this episode in several earlier blog posts, including this one.) Interest on the public debt increased by $240 billion because of increases in the debt as a result of persistently high federal deficits and because of increases in the interest rates the Treasury has paid on new issues of bill, notes, and bonds necessary to fund those deficits. (We discuss the federal budget deficit and federal debt in Macroeconomics, Chapter 16, Section 16.6 (Economics, Chapter 26, Section 26.6).)
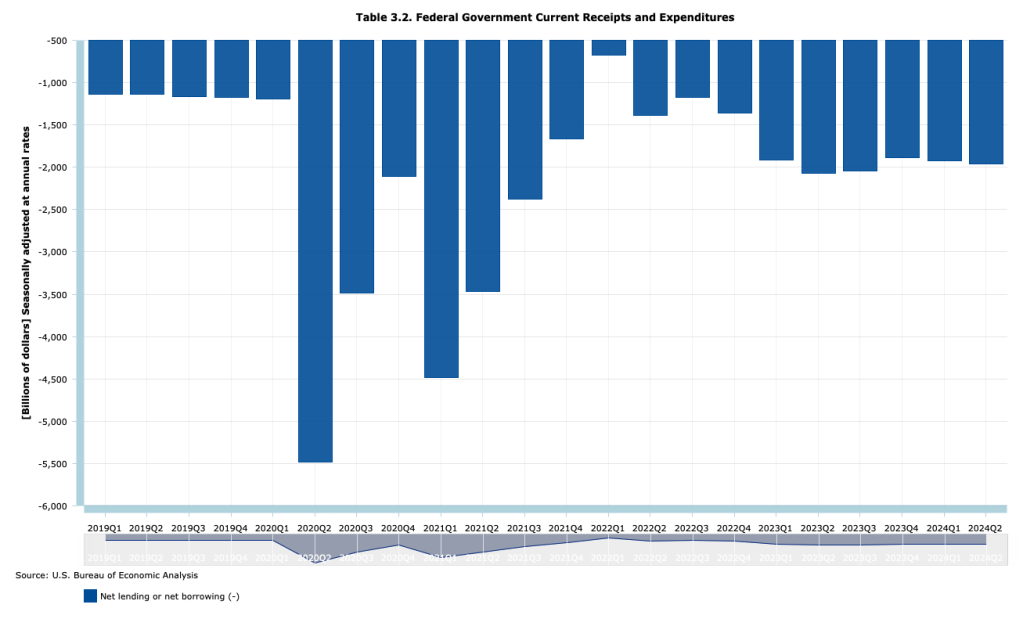
A troubling aspect of the large federal budget deficits is that they are occurring during a time of economic expansion when the economy is at full employment. The following figure, using data from the Bureau of Economic Analysis (BEA), shows that at an annual rate, the federal budget deficit has beening running between $1.9 trillion and $2.1 trillion each quarter since the first quarter of 2023, well after most of the federal spending increases to meet the Covid pandemic ended.
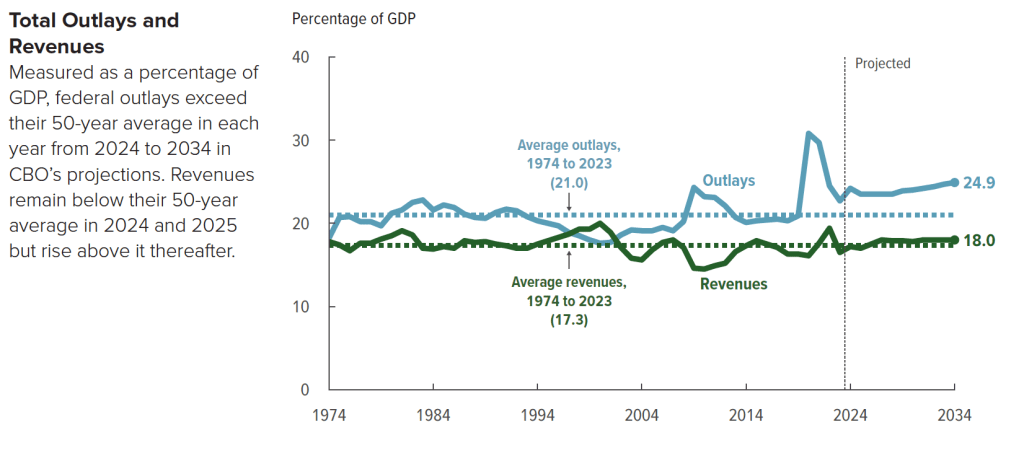
The following figure from the CBO shows trends in federal revenue and spending. From 1974 to 2023, federal spending averaged 21.o percent of GDP, but is forecast to rise to 24.9 percent of GDP by 2023. Federal revenue averaged 17.3 percent of GDP from 1974 to 2023 and is forecast to rise to 18.0 percent of GDP in 2034. As a result, the federal budget deficit, which had averaged 3.7 percent of GDP between 1974 and 2023 (already high in a longer historical context) will nearly double to 6.9 percent of GDP in 2034.
Slowing the growth of federal spending may prove difficult politically because the majority of spending increases are from manadatory spending on Social Security and Medicare, and from interest on the debt. Discretionary outlays are scheduled to decline in future years according to current law, but may well also increase if Congress and future presidents increase defense spending to meet the foreign challenges the country faces.
One possible course of future policy that would result in smaller future federal deficits is outlined in this post and the material at the included links.
Jerome Powell arriving to testify before Congress. (Photo from Bloomberg News via the Wall Street Journal.)
Each month the Bureau of Labor Statistics (BLS) releases its “Employment Situation” report. As we’ve discussed in previous blog posts, discussions of the report in the media, on Wall Street, and among policymakers center on the estimate of the net increase in employment that the BLS calculates from the establishment survey.
How should the members of the Fed’s policy-making Federal Open Market Committee interpret these data? For instance, the BLS reported that the net increases in employment in June was 206,000. (Always worth bearing in mind that the monthly data are subject to—sometimes substantial—revisions.) Does a net increase of employment of that size indicate that the labor market is still running hot—with the quantity of labor demanded by businesses being greater than the quantity of labor workers are supplying—or that the market is becoming balanced with the quantity of labor demanded roughly equal to the quantity of labor supplied?
On July 9, in testimony before the Senate Banking Committee indicated that his interpretation of labor market data indicate that: “The labor market appears to be fully back in balance.” One interpretation of the labor market being in balance is that the number of net new jobs the economy creates is enough to keep up with population growth. In recent years, that number has been estimated to be 70,000 to 100,000. The number is difficult to estimate with precision for two main reasons:
There is some uncertainty about the number of older workers who will retire. The more workers who retire, the fewer net new jobs the economy needs to create to accommodate population growth.
More importantly, estimates of population growth are uncertain, largely because of disagreements among economists and demographers over the number of immigrants who have entered the United States in recent years.
In calculating the unemployment rate and the size of the labor force, the BLS relies on estimates of population from the Census Bureau. In a January report, the Congressional Budget Office (CBO) argued that the Census Bureau’s estimate of the population of the United States is too low by about 6 million people. As the following figure from the CBO report indicates, the CBO believes that the Census Bureau has underestimated how much immigration has occurred and what the level of immigration is likely to be over the next few years. (In the figure, SSA refers to the Social Security Administration, which also makes forecasts of population growth.)
Some economists and policymakers have been surprised that low levels of unemployment and large monthly increases in employment have not resulted in greater upward pressure on wages. If the CBO’s estimates are correct, the supply of labor has been increasing more rapidly than is indicated by census data, which may account for the relative lack of upward pressure on wages. If the CBO’s estimates of population growth are correct, a net increase in employment of 200,000, as occured in June, may be about the number necessary to accommodate growth in the labor force. In other words, Chair Powell would be correct that the labor market was in balance in June.
In a recent publication, economists Nicolas Petrosky-Nadeau and Stephanie A. Stewart of the Federal Reserve Bank of San Francisco look at a related concept: breakeven employment growth—the rate of employment growth required to keep the unemployment rate unchanged. They estimate that high rates of immigration during the past few years have raised the rate of breakeven employment growth from 70,000 to 90,000 jobs per month to 230,000 jobs per month. This analysis would be consistent with the fact that as net employment increases have averaged 177,000 over the past three months—somewhat below their estimate of breakeven employment growth—the unemployment rate has increased from 3.8 percent to 4.1 percent.
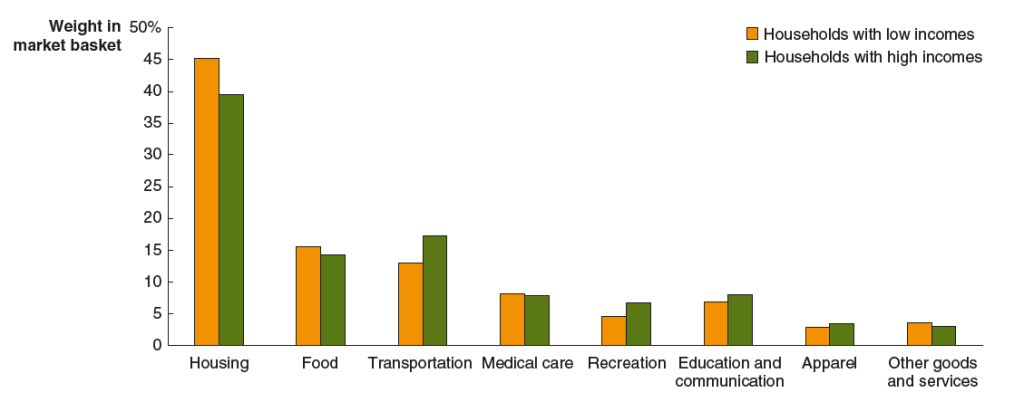
In the new 9th edition of Macroeconomics, in Chapter 9, Section 9.7 (Economics, Chapter 19, Section 19.7 and Essentials of Economics, Chapter 13, Section 13.7), we have an Apply the Concept feature that looks at research conducted by economists at the U.S. Bureau of Labor Statistics into the effects of inflation on households at different income levels. That research involved looking at the differences between the mix of goods that households at different income levels consume and at differences in increases in the wages they earn. The following figure, reproduced from this feature shows that as a percentage of their total consumption expenditures households with low incomes spend more on housing and food, and less on transportation and recreation than do households with high incomes.
During the three-year period from March 2020 to April 2023, wages increased faster than did prices for households with low incomes, while wages increased at a slower than did prices for households with high incomes. We concluded from this research that: “during this period, workers with lower incomes were hurt less by the effects of inflation than were workers with higher incomes.”
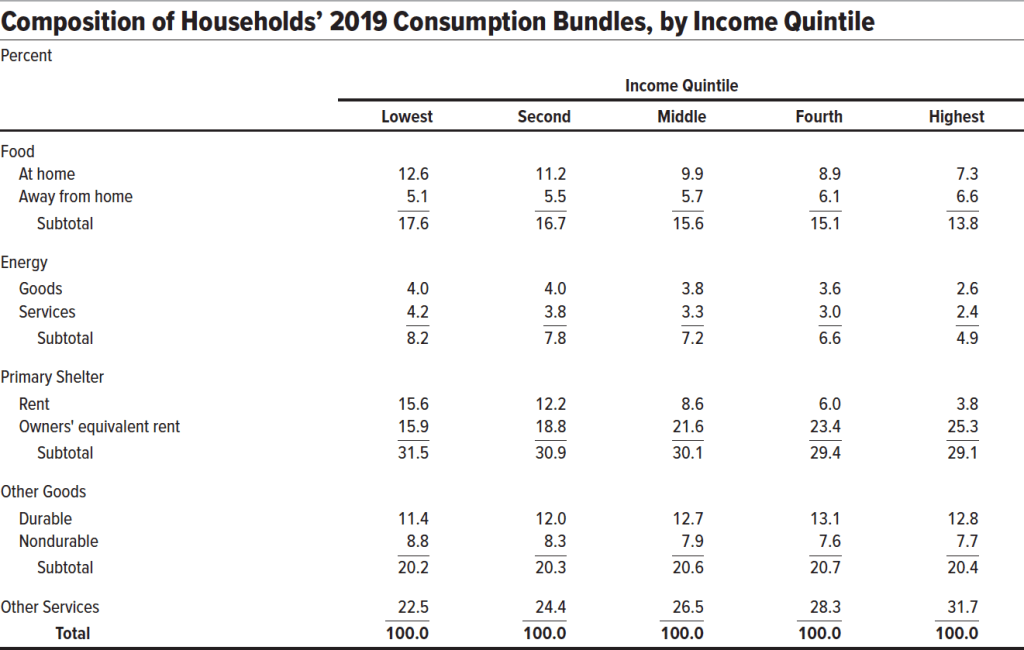
The Congressional Budget Office (CBO) has just released a new study that uses different data to arrive at a similar conclusion. The CBO divided households into five equal groups, or quintiles, from the 20 percent with the lowest incomes to the 20 percent with the highest incomes. The following table shows how income quintiles divide their consumption across different broad categories of goods and services. For example, compared with households in the highest income quintile, households in the lowest income quintile spend a much larger fraction of their budget on rent and a significantly larger fraction on food eaten at home. Households in the lowest quintile spent significantly less on “other services,” which include spending on hotels and on car maintenance and repair.
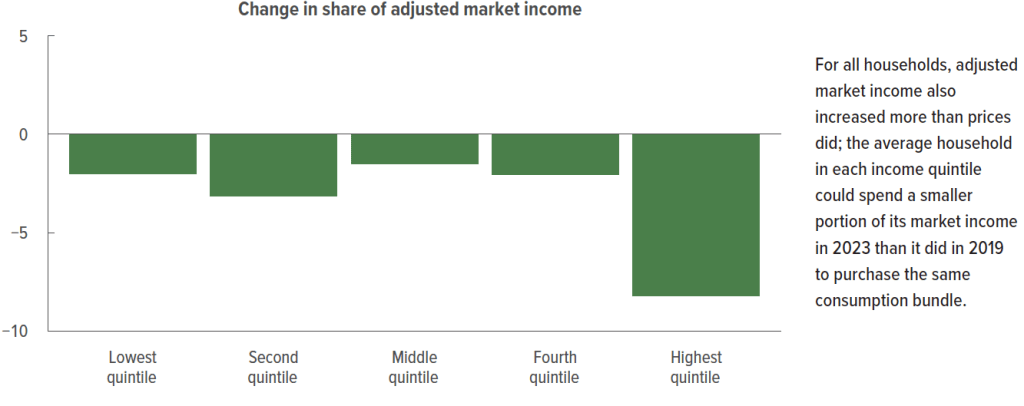
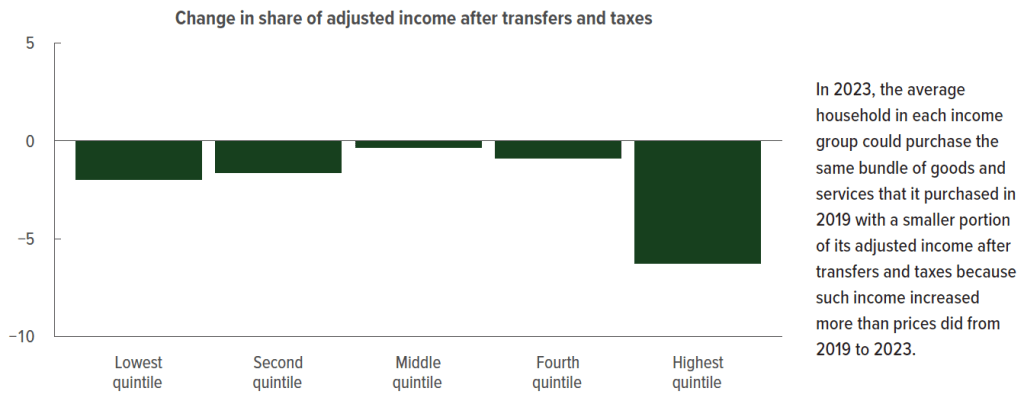
The CBO study measures the effect of inflation over the past four years on different income quintiles by comparing the change in the fraction of their incomes households needed to buy the same bundle of goods and services in 2024 that they bought in 2019. The first figure below shows the result when household income includes only market income—primarily wages and salaries. The second figure shows that result when transfer payments—such as Social Security benefits received by retired workers and unemployment benefits received by unemployed workers—are added to market income. (The values along the vertical axis are percentage points.)
The fact that, in both figures, the fraction of each quintiles’ income required to buy the same bundle of goods and services is negative means that between 2019 and 2023 income increased faster than prices for all income quintiles. Looking at the bottom figure, households in the highest income quintile could spend 6.3 percentage points less of their income in 2024 to buy the same bundle of goods and services they had bought in 2019. Households in the lowest income quintile could spend 2.0 percentage points less. Households in the middle income quintile had the smallest reduction—0.3 percentage point—of their income to buy the same bundle of goods and services.
It’s worth keeping mind that the CBO data represent averages within each quintile. There were certainly many households, particularly in the lower income quintiles, that needed to spend a larger precentage of their income in 2024 to buy the same bundle of goods and services that they had bought in 2019, even though, as a group, the quintile they were in needed a smaller percentage.
This op-ed orginally appeared in the Wall Street Journal.
Put Growth Back on the Political Agenda
In a campaign season dominated by the past, a central economic topic is missing: growth. Rapid productivity growth raises living standards and incomes. Resources from those higher incomes can boost support for public goods such as national defense and education, or can reconfigure supply chains or shore up social insurance programs. A society without growth requires someone to be worse off for you to be better off. Growth breaks that zero-sum link, making it a political big deal.
So why is the emphasis on growth fading? More than economics is at play. While progress from technological advances and trade generally is popular, the disruption that inevitably accompanies growth and hits individuals, firms and communities has many politicians wary. Such concerns can lead to excessive meddling via industrial policy.
As we approach the next election, the stakes for growth are high. Regaining the faster productivity that prevailed before the global financial crisis requires action. The nonpartisan Congressional Budget Office estimates potential gross domestic product growth of 1.8% over the coming decade, and somewhat lower after that. Those figures are roughly 1 percentage point lower than the growth rate over the three decades before the pandemic. Many economists believe productivity gains from generative artificial intelligence can raise growth in coming decades. But achieving those gains requires an openness to change that is rare in a political climate stuck in past grievances about disruption—the perennial partner of growth.
Traditionally, economic policy toward growth emphasized support for innovation through basic research. Growth also was fostered by reducing tax burdens on investment, streamlining regulation (which has proliferated during the Biden administration) and expanding markets. These important actions have flagged in recent years. But such attention, while valuable, masks inattention to adverse effects on some individuals and communities, raising concerns about whether open markets advance broad prosperity.
This opened a lane for backward-looking protectionism and industrial policy from Democrats and Republicans alike. Absent strong national-defense arguments (which wouldn’t include tariffs on Canadian steel or objections to Japanese ownership of a U.S. steel company), protectionism limits growth. According to polls by the Chicago Council on Global Affairs, roughly three-fourths of Americans say international trade is good for the economy. Finally, protectionism belies ways in which gains from openness may be preserved, such as by simultaneously offering support for training and work for communities of individuals buffeted by trade and technological change.
On industrial policy, it is true that markets can’t solve every allocation problem. But such concerns underpin arguments for greater federal support of research for new technologies in defense, climate-change mitigation, and private activity, not micromanaged subsidies to firms and industries. If a specific defense activity merits assistance, it could be subsidized. These alternatives mitigate the problems in conventional industrial policy of “winner picking” and, just as important, the failure to abandon losers. It is policymakers’ hyperattention to those buffeted by change that hampers policy effectiveness and, worse, invites rent-seeking behavior and costly regulatory micromanagement.
Examples abound. Appending child-care requirements to the Chips Act and the inaptly named Inflation Reduction Act has little to do with those laws’ industrial policy purpose. The Biden administration’s opposition to Nippon Steel’s acquisition of U.S. Steel raises questions amid the current wave of industrial policy. How is a strong American ally’s efficient operation of an American steel company with U.S. workers an industrial-policy problem? Flip-flops on banning TikTok fuel uncertainty about business operations in the name of industrial policy.
The wrongly focused hyperattention is supposedly grounded in putting American workers first. But it raises three problems. First, the interventions raise the cost of investments, and the jobs they are to create or protect, by using mandates and generating policy uncertainty. Second, they contradict the economic freedom in market economies of voluntary transactions. Absent a strong national-security foundation, why is public policy directing investment in or ownership of assets? Such policies threaten the nation’s long-term prosperity by discouraging investment and invite rent-seeking in a way that voluntary market transactions don’t. Both problems hamstring growth.
Third, and perhaps most important, such micromanagement misses the economic and political mark of actually helping individuals and communities disrupted by growth-enhancing openness. A more serious agenda would focus on training suited to current markets (through, for example, more assistance to community colleges), on work (through expanding the Earned Income Tax Credit), and on aid to communities hit by prolonged employment loss (through services that enhance business formation and job creation). The federal government could also establish research centers around the country to disseminate ideas for businesses.
Growth matters—for individual livelihoods, business opportunities and public finances. Pro-growth policies that account for disruption’s effects while encouraging innovation, saving, capital formation, skill development and limited regulation must return to the economic agenda. A shift to prospective, visionary thinking would reorient the bipartisan, backward-looking protectionism and industrial policy that weaken growth and fail to address disruption.
On Friday, April 5—the first Friday of the month—the Bureau of labor Statistics (BLS) released its “Employment Situation” report with data on the state of the labor market in March. The BLS reported a net increase in employment during March of 303,000, which was well above the increase that economists had been expecting. The previous estimates of employment in January and February were revised upward by 22,000 jobs. (We also discuss the employment report in this podcast.)
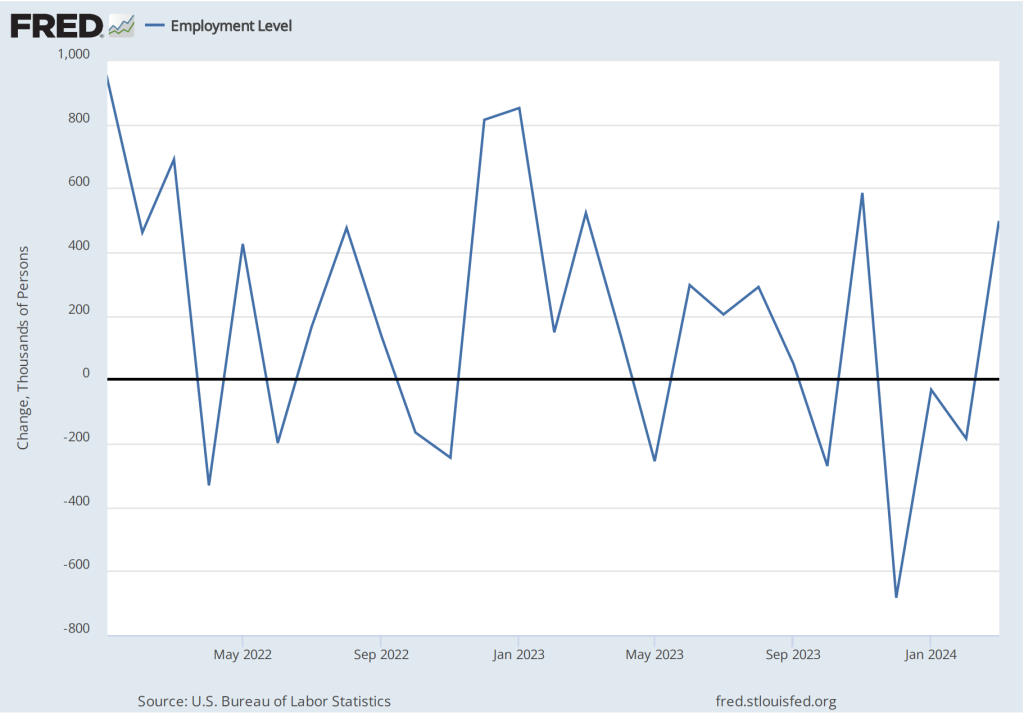
Employment increases during the second half of 2023 had slowed compared with the first half of the year. But, as the following figure from the BLS report shows, since December 2023, employment has increased by more than 250,000 in each month. These increases are far above the estimated increases of 70,000 to 100,000 new jobs needed to keep up with population growth. (But note our later discussion of this point.)
The unemployment rate had been expected to stay steady at 3.9 percent, but declined slightly to 3.8 percent. As the following figure shows, the unemployment rate has been remarkably stable for more than two years and has been below 4.0 percent each month since December 2021. The members of the Federal Open Market Committee (FOMC) expect that the unemployment rate for 2024 will be 4.0 percent, a forcast that is beginning to seem too high.
The monthly employment number most commonly reported in media accounts is from the establishment survey (sometimes referred to as the payroll survey), whereas the unemployment rate is taken from the household survey. The results of both surveys are included in the BLS’s monthly “Employment Situation” report. As we discuss in Macroeconomics, Chapter 9, Section 9.1 (Economics, Chapter 19, Section 19.1), many economists and policymakers at the Federal Reserve believe that employment data from the establishment survey provides a more accurate indicator of the state of the labor market than do either the employment data or the unemployment data from the household survey.
As we noted in a previous post, whereas employment as measured by the establishment survey has been increasing each month, employment as measured by the household surve declined each month from December 2023 through February 2024. But, as the following figure shows, this trend was reversed in March, with employment as measured by the household survey increasing 498,000—far more than the 303,000 increase in employment in establishment survey. This reversal may be another indication of the underlying strength of the labor market.
As the following figure shows, despite the substantial increases in employment, wages, as measured by the percentage change in average hourly earnings from the same month in the previous year, have been trending down. The increase in average hourly earnings declined from 4.3 percent February in to 4.1 percent in March.
The following figure shows wage inflation calculated by compounding the current month’s rate over an entire year. (The figure above shows what is sometimes called 12-month wage inflation, whereas this figure shows 1-month wage inflation.) One-month wage inflation is much more volatile than 12-month inflation—note the very large swings in 1-month wage inflation in April and May 2020 during the business closures caused by the Covid pandemic.
Wages increased by 6.1 percent in January 2024, 2.1 percent in February, and 4.2 percent in March. So, the 1-month rate of wage inflation did show an increase in March, although it’s unclear whether the increase was a result of the strength of the labor market or reflected the greater volatility in wage inflation when calculated this way.
Some economists and policymakers are surprised that low levels of unemployment and large monthly increases in employment have not resulted in greater upward pressure on wages. One possibility is that the supply of labor has been increasing more rapidly than is indicated by census data. In a January report, the Congressional Budget Office (CBO) argued that the Census Bureau’s estimate of the population of the United States is too low by about 6 million people. This undercount is attributable, according to the CBO, largely the Census Bureau having underestimated the amount of immigration that has occurred. If the CBO is correct, then the economy may need to generate about 200,000 net new jobs each month to accommodate the growth of the labor force, rather than the 80,000 to 100,000 we mentioned earlier in this post.
Federal Reserve Chair Jerome Powell noted in a press conference following the most recent meeing of the FOMC that: “Strong job creation has been accompanied by an increase in the supply of workers, reflecting increases in participation among individuals aged 25 to 54 years and a continued strong pace of immigration.” As a result:
“what you would have is potentially kind of what you had last year, which is a bigger economy where inflationary pressures are not increasing. In fact, they were decreasing. So you can have that if you have a continued supply-side activity that we had last year with—both with supply chains and also with, with growth in the size of the labor force.”
If Powell is correct, in the coming months the U.S. economy may be able to sustain rapid increases in employment without those increases leading to an increase in the rate of inflation.
Recent articles in the business press have discussed the possibility that the U.S. economy is entering a period of higher growth in labor productivity:
“US Productivity Is on the Upswing Again. Will AI Supercharge It?” (link)
“Can America Turn a Productivity Boomlet Into a Boom?” (link)
In Macroeconomics, Chapter 16, Section 16.7 (Economics, Chapter 26, Section 26.7), we highlighted the role of growth in labor productivity in explaining the growth rate of real GDP using the following equations. First, an identity:
Real GDP = Number of hours worked x (Real GDP/Number of hours worked),
where (Real GDP/Number of hours worked) is labor productivity.
And because an equation in which variables are multiplied together is equal to an equation in which the growth rates of these variables are added together, we have:
Growth rate of real GDP = Growth rate of hours worked + Growth rate of labor productivity
From 1950 to 2023, real GDP grew at annual average rate of 3.1 percent. In recent years, real GDP has been growing more slowly. For example, it grew at a rate of only 2.0 percent from 2000 to 2023. In February 2024, the Congressional Budget Office (CBO) forecasts that real GDP would grow at 2.0 percent from 2024 to 2034. Although the difference between a growth rate of 3.1 percent and a growth rate of 2.0 percent may seem small, if real GDP were to return to growing at 3.1 percent per year, it would be $3.3 trillion larger in 2034 than if it grows at 2.0 percent per year. The additional $3.3 trillion in real GDP would result in higher incomes for U.S. residents and would make it easier for the federal government to reduce the size of the federal budget deficit and to better fund programs such as Social Security and Medicare. (We discuss the issues concerning the federal government’s budget deficit in this earlier blog post.)
Why has growth in real GDP slowed from a 3.1 percent rate to a 2.0 percent rate? The two expressions on the right-hand side of the equation for growth in real GDP—the growth in hours worked and the growth in labor productivity—have both slowed. Slowing population growth and a decline in the average number of hours worked per worker have resulted in the growth rate of hours worked to slow substantially from a rate of 2.0 percent per year from 1950 to 2023 to a forecast rate of only 0.4 percent per year from 2024 to 2034.
Falling birthrates explains most of the decline in population growth. Although lower birthrates have been partially offset by higher levels of immigration in recent years, it seems unlikely that birthrates will increase much even in the long run and levels of immigration also seem unlikely to increase substantially in the future. Therefore, for the growth rate of real GDP to increase significantly requires increases in the rate of growth of labor productivity.
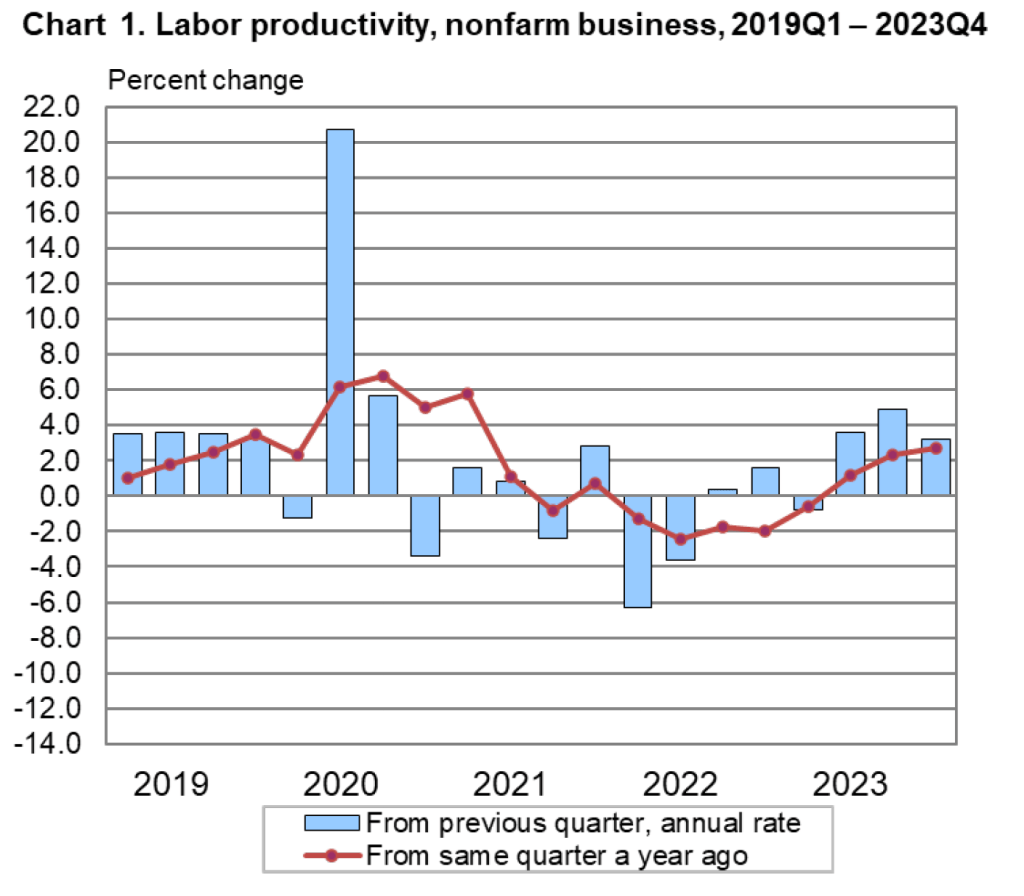
The Bureau of Labor Statistics (BLS) publishes quarterly data on labor productivity. (Note that the BLS series is for labor productivity in the nonfarm business sector rather than for the whole economy. Output of the nonfarm business sector excludes output by government, nonprofit businesses, and households. Over long periods, growth in real GDP per hour worked and growth in real output of the nonfarm business sector per hour worked have similar trends.) The following figure is taken from the BLS report “Productivty and Costs,” which was released on February 1, 2024.
Note that the growth in labor productivity increased during the last three quarters of 2023, whether we measure the growth rate as the percentage change from the same quarter in the previous year or as growth in a particular quarter expressed as anual rate. It’s this increase in labor productivity during 2023 that has led to speculation that labor productivity might be entering a period of higher growth. The following figure shows labor productivity growth, measured as the percentage change from the same quarter in the previous year for the whole period from 1950 to 2023.
The figure indicates that labor productivity has fluctuated substantially over this period. We can note, in particular, productivity growth during two periods: First, from 2011 to 2018, labor productivity grew at the very slow rate of 0.9 percent per year. Some of this slowdown reflected the slow recovery of the U.S. economy from the Great Recession of 2007-2009, but the slowdown persisted long enough to cause concern that the U.S. economy might be entering a period of stagnation or very slow growth.
Second, from 2019 through 2023, labor productivity went through very large swings. Labor productivity experienced strong growth during 2019, then, as the Covid-19 pandemic began affecting the U.S. economy, labor productivity soared through the first half of 2021 before declining for five consecutive quarters from the first quarter of 2022 through the first quarter of 2023—the first time productivity had fallen for that long a period since the BLS first began collecting the data. Although these swings were particularly large, the figure shows that during and in the immediate aftermath of recessions labor productivity typically fluctuates dramatically. The reason for the fluctuations is that firms can be slow to lay workers off at the beginning of a recession—which causes labor productivity to fall—and slow to hire workers back during the beginning of an economy recovery—which causes labor productivity to rise.
Does the recent increase in labor productivity growth represent a trend? Labor productivity, measured as the percentage change since the same quarter in the previous year, was 2.7 percent during the fourth quarter of 2023—higher than in any quarter since the first quarter of 2021. Measured as the percentage change from the previous quarter at an annual rate, labor productivity grew at a very high average rate of 3.9 during the last three quarters of 2023. It’s this high rate that some observers are pointing to when they wonder whether growth in labor productivity is on an upward trend.
As with any other economic data, you should use caution in interpreting changes in labor productivity over a short period. The productivity data may be subject to large revisions as the two underlying series—real output and hours worked—are revised in coming months. In addition, it’s not clear why the growth rate of labor productivity would be increasing in the long run. The most common reasons advanced are: 1) the productivity gains from the increase in the number of people working from home since the pandemic, 2) businesses’ increased use of artificial intelligence (AI), and 3) potential efficiencies that businesses discovered as they were forced to operate with a shortage of workers during and after the pandemic.
To this point it’s difficult to evaluate the long-run effects of any of these factors. Wconomists and business managers haven’t yet reached a consensus on whether working from home increases or decreases productivity. (The debate is summarized in this National Bureau of Economic Research Working Paper, written by Jose Maria Barrero of Instituto Tecnologico Autonomo de Mexico, and Steven Davis and Nicholas Bloom of Stanford. You may need to access the paper through your university library.)
Many economists believe that AI is a general purpose technology (GPT), which means that it may have broad effects throughout the economy. But to this point, AI hasn’t been adopted widely enough to be a plausible cause of an increase in labor productivity. In addition, as Erik Brynjolfsson and Daniel Rock of MIT and Chad Syverson of the University of Chicago argue in this paper, the introduction of a GPT may initially cause productivity to fall as firms attempt to use an unfamiliar technology. The third reason—efficiency gains resulting from the pandemic—is to this point mainly anecdotal. There are many cases of businesses that discovered efficiencies during and immediately after Covid as they struggled to operate with a smaller workforce, but we don’t yet know whether these cases are sufficiently common to have had a noticeable effect on labor productivity.
So, we’re left with the conclusion that if the high labor productivity growth rates of 2023 can be maintained, the growth rate of real GDP will correspondingly increase more than most economists are expecting. But it’s too early to know whether recent high rates of labor productivty growth are sustainable.
During 2023, GDP and employment have continued to expand. Between the second quarter of 2022 and the second quarter of 2023, nominal GDP increased by 6.1 percent. From July 2022 to July 2023, total employment increased by 3.3 million as measured by the establishment (or payroll) survey and by 3.0 as measured by the household survey. (In this post, we discuss the differences between the employment measures in the two surveys.)
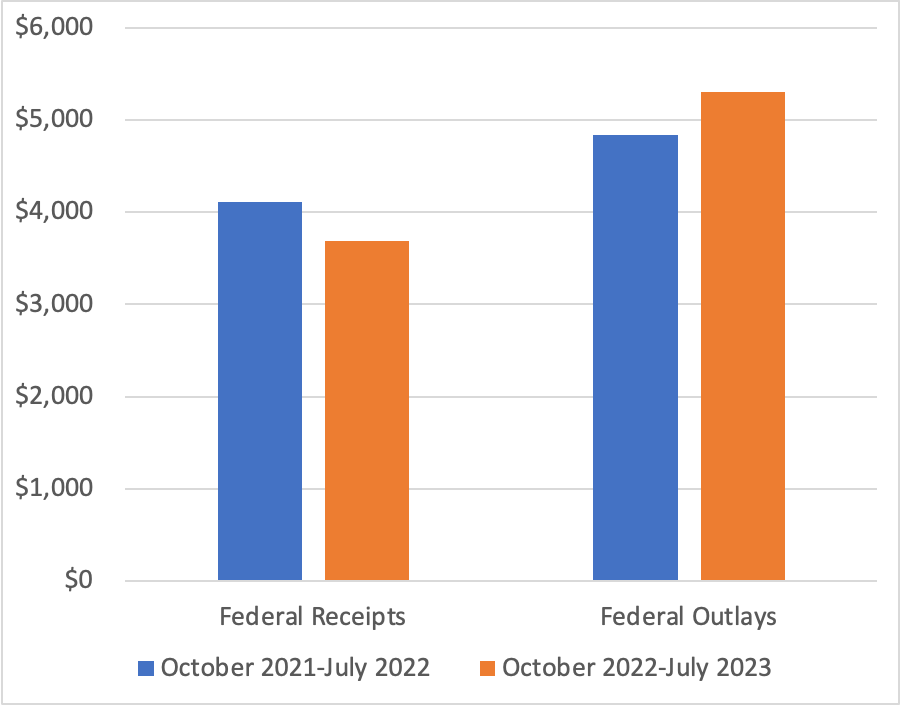
We would expect that with an expanding economy, federal tax revenues would rise and federal expenditures on unemployment insurance and other transfer programs would decline, reducing the federal budget deficit. (We discuss the effects of the business cycle on the federal budget deficit in Macroeconomics, Chapter 16, Section 16.6, Economics, Chapter 26, Section 26.6, and Essentials of Economics, Chapter 18, Section 18.6.) In fact, though, as the figure from the Congressional Budget Office (CBO) at the top of this post shows, the federal budget deficit actually increased substantially during 2023 in comparison with 2022. The federal budget deficit from the beginning of government’s fiscal year on October 1, 2022 through July 2023 was $1,617 billion, more than double the $726 billion deficit during the same period in fiscal 2022.
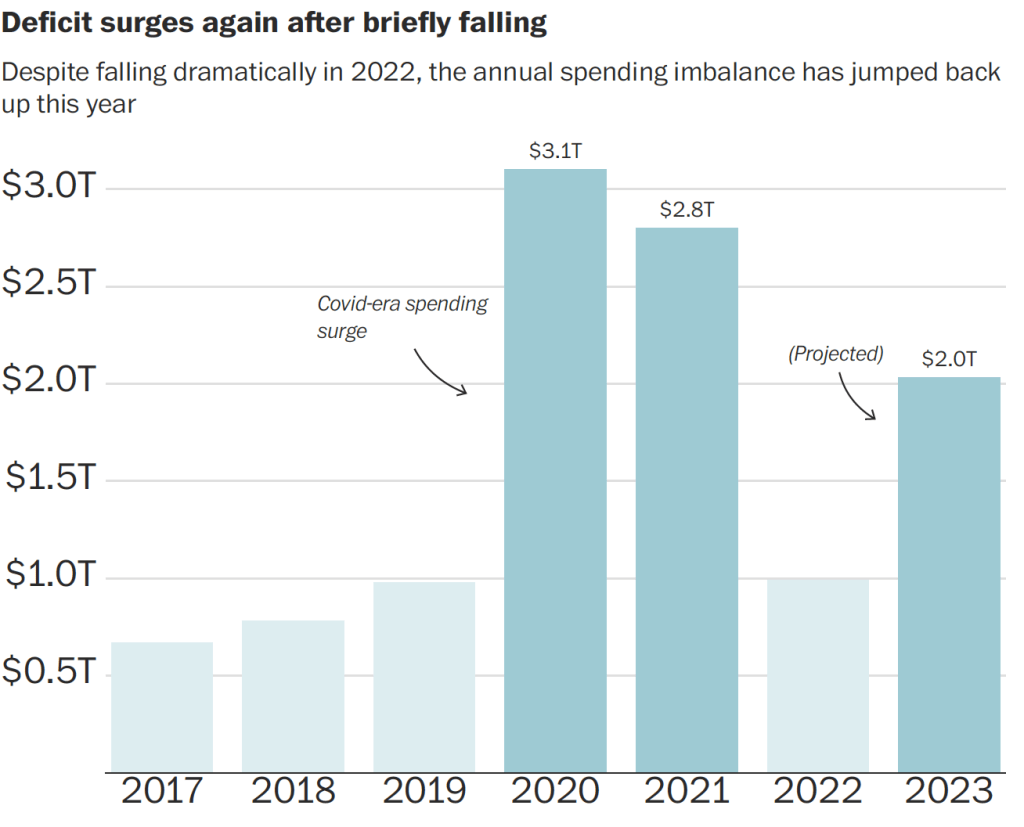
The following figure from an article in the Washington Post uses data from the Committee for a Responsible Federal Budget to illustrate changes in the federal budget deficit in recent years. The figure shows the sharp decline in the federal budget deficit in 2022 as the economic recovery from the Covid–19 pandemic increased federal tax receipts and reduced federal expenditures as emergency spending programs ended. Given the continuing economic recovery, the surge in the deficit during 2023 was unexpected.
As the following figure shows, using CBO data, federal receipts—mainly taxes—are 10 percent lower this year than last year, and federal outlays—including transfer payments—are 11 percent higher. For receipts to fall and outlays to increase during an economic expansion is very unusual. As an article in the Wall Street Journal put it: “Something strange is happening with the federal budget this year.”
Note: The values on the vertical axis are in billions of dollars.
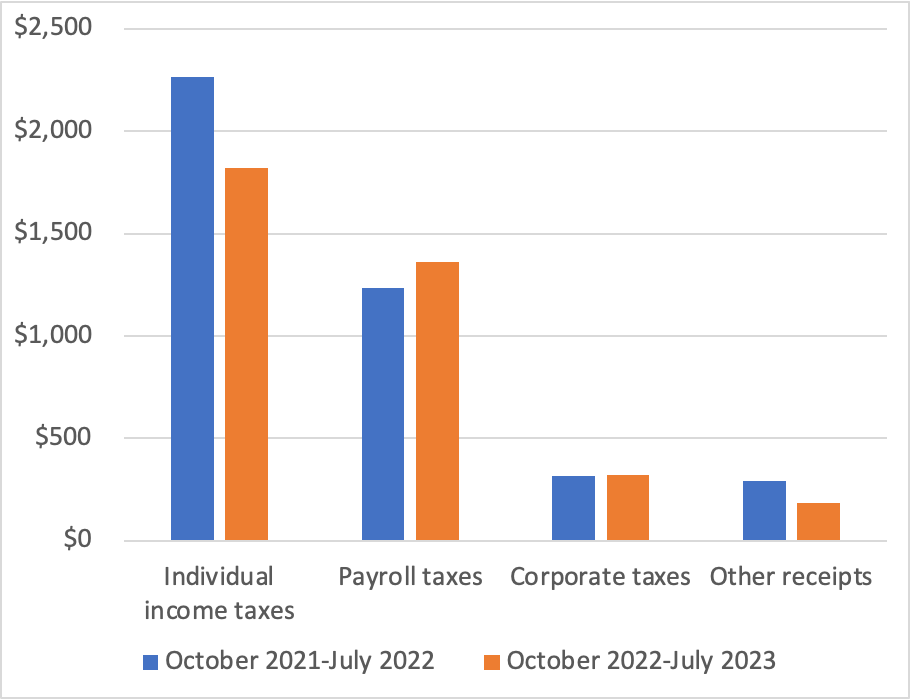
The following figure shows a breakdown of the decline in federal receipts. While corporate taxes and payroll taxes (primarily used to fund the Social Security and Medicare systems) increased, personal income tax receipts fell by 20 percent, and “other receipts” fell by 37 percent. The decline in other receipts is largely the result of a decline in payments from the Federal Reserve to the U.S. Treasury from $99 billion in 2022 to $1 billion in 2023. As we discuss in Macroeconomics, Chapter 17, Section 17.4 (Economics, Chapter 27, Section 27.4), Congress intended the Federal Reserve to be independent of the rest of the government. Unlike other federal agencies and departments, the Fed is self-financing rather than being financed by Congressional appropriations. Typically, the Fed makes a profit because the interest it earns on its holdings of Treasury securities is more than the interest it pays banks on their reserve deposits. After paying its operating costs, the Fed pays the rest of its profit to the Treasury. But as the Fed increased its target for the federal funds rate beginning in March 2022, it also increased the interest rate it pays banks on their reserve deposits. Because most of the securities it holds pay low interest rates, the Fed has begun running a deficit, reducing the payments it makes to the Treasury.
Note: The values on the vertical axis are in billions of dollars.
The reasons for the sharp decline in individual income taxes are less clear. The decline was in the “nonwithheld category” of individual income taxes; federal income taxes withheld from worker paychecks increased. People who are self-employed or who receive substantial income from sources such as capital gains from selling stocks, make quarterly estimated income tax payments. It’s these types of personal income taxes that have been unexpectedly low. Accordingly, smaller capital gains may be one explanation for the shortfall in federal revenues, but a more complete explanation won’t be possible until more data become available later in the year.
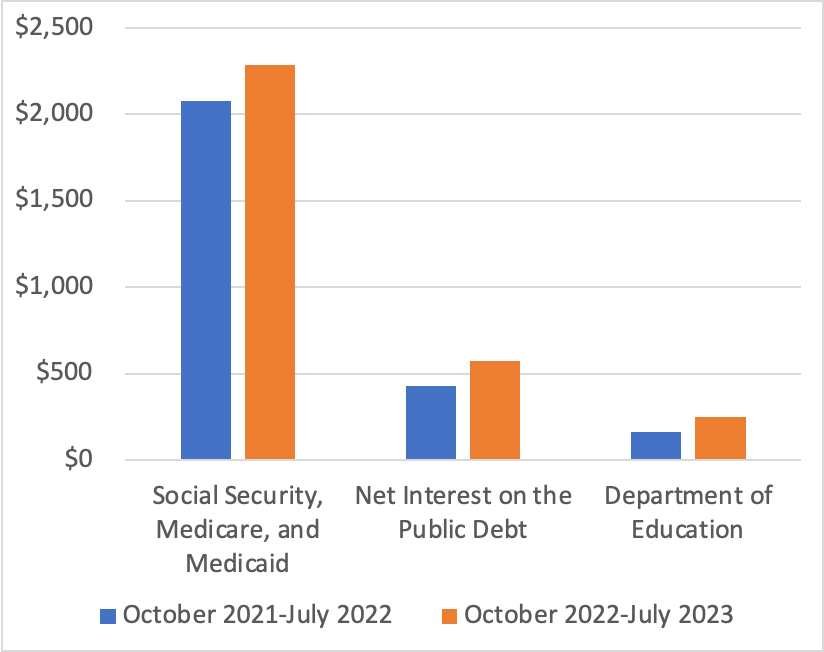
The following figure shows the categories of federal outlays that have increased the most from 2022 to 2023. The largest increase is in spending on Social Security, Medicare, and Medicaid, with spending on Social Security alone increasing by $111 billion. This increase is due partly to an increase in the number of retired workers receiving benefits and partly to the sharp rise in inflation, because Social Security is indexed to changes in the consumer price index (CPI). Spending on Medicare increased by $66 billion or a surprisingly large 18 percent. Interest payments on the public debt (also called the federal government debt or the national debt) increased by $146 billion or 34 percent because interest rates on newly issued Treasury securities rose as nominal interest rates adjusted to the increase in inflation and because the public debt had increased significantly as a result of the large budget deficits of 2020 and 2021. The increase in spending by the Department of Education reflects the effects of the changes the Biden administration made to student loans eligible for the income-driven repayment plan. (We discuss the income-driven repayment plan for student loans in this blog post.)
Note: The values on the vertical axis are in billions of dollars.
The surge in federal government outlays occurred despite a $120 billion decline in refundable tax credits, largely due to the expiration of the expansion of the child tax credit Congress enacted during the pandemic, a $98 billion decline in Treasury payments to state and local governments to help offset the financial effects of the pandemic, and $59 billion decline in federal payments to hospitals and other medical facilities to offset increased costs due to the pandemic.
In this blog post from February, we discussed the challenges posed to Congress and the president by the CBO’s forecasts of rising federal budget deficits and corresponding increases in the federal government’s debt. The unexpected expansion in the size of the federal budget deficit for the current fiscal year significantly adds to the task of putting the federal government’s finances on a sound basis.
In 1974, Congress created the Congressional Budget Office (CBO). The CBO was given the responsibility of providing Congress with impartial economic analysis as it makes decisions about the federal government’s budget. One of the most widely discussed reports the CBO issues is the Budget and Economic Outlook. The report provides forecasts of future federal budget deficits and changes in the federal government’s debt that the budget deficits will cause. The CBO’s budget and debt forecasts rely on the agency’s forecasts of future economic conditions and assumes that Congress will make no changes to current laws regarding taxing and spending. (We discuss this assumption further below.)
On February 15, the CBO issued its latest forecasts. The forecasts showed a deterioration in the federal government’s financial situation compared with the forecasts the CBO had issued in May 2022. (You can find the full report here.) Last year, the CBO forecast that the federal government’s cumulative budget deficit from 2023 through 2032 would be $15.7 trillion. The CBO is now forecasting the cumulative deficit over the same period will be $18.8 trillion. The three main reason for the increase in the forecast deficits are:
1. Congress has increased spending—particularly on benefits for military veterans.
2) Cost-of-living adjustments for Social Security and other government programs have increased as a result of higher inflation.
3) Interest rates on Treasury debt have increased as a result of higher inflation.
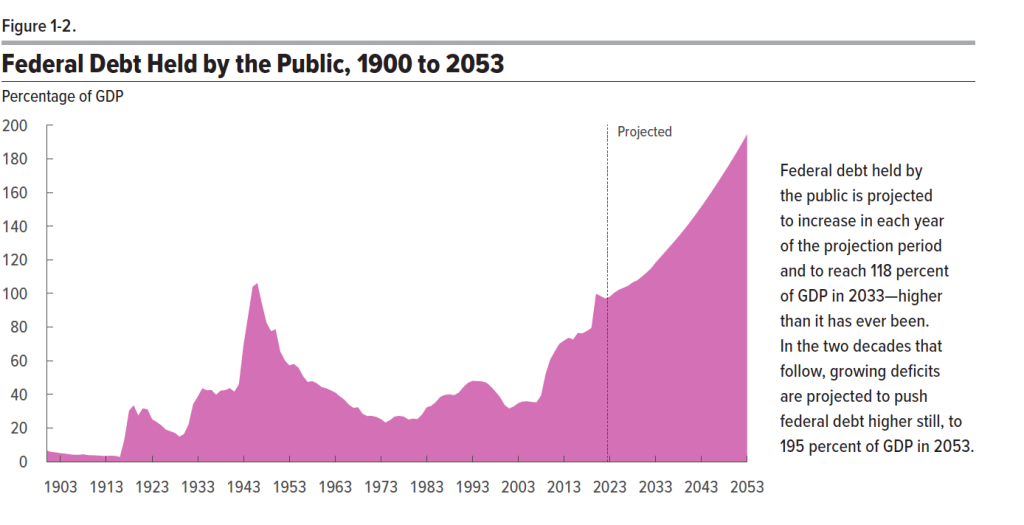
The CBO forecasts that federal debt held by the public will increase from 98 percent of GDP in 2023 to 118 percent in 2033 and eventually to 198 percent in 2053. Note that economists prefer to measure the size of the debt relative to GDP rather than in as absolute dollar amounts for two main reasons: First, measuring debt relative to GDP makes it easier to see how debt has changed over time in relation to the growth of the economy. Second, the size of debt relative to GDP makes it easier to gauge the burden that the debt imposes on the economy. When debt grows more slowly than the economy, as measured by GDP, crowding effects are likely to be relatively small. We discuss crowding out in Macroeconomics, Chapter 10, Section 10.2 and Chapter 16, Section 16. 5 (Economics, Chapter 20, Section 20.2 and Chapter 26, Section 26.5). The two most important factors driving increases in the ratio of debt to GDP are increased spending on Social Security, Medicare, and Medicaid, and increased interest payments on the debt.
The following figure is reproduced from the CBO report. It shows the ratio of debt to GDP with actual values for the period 1900-2022 and projected values for the period 2023-2053. Note that the only other time the ratio of debt to GDP rose above 100 percent was in 1945 and 1946 as a result of the large increases in federal government spending required to fight World War II.
The increased deficits and debt over the next 10 years are being driven by government spending increasing as a percentage of GDP, while government revenues (which are mainly taxes) are roughly stable as a percentage of GDP. The following figure from the report shows actual federal outlays and revenues as a percentage of GDP for the period 1973-2022 and projected outlays and revenues for the period 2023-2033. Note that from 1973 to 2022, outlays averaged 21.0 percent of GDP and revenues averaged 17.4 percent of GDP, resulting in an average deficit of 3.6 percent of GDP. By 2033, outlays are forecast to rise to 24.9 percent of GDP–well above the 1973-2022 average–whereas revenues are forecast to be only 18.1 percent, for a forecast deficit of 6.8 percent of GDP.
The increase in outlays is driven primarily by increases in mandatory spending, mainly spending on Social Security, Medicare, Medicaid, and veterans’ benefits and increases in interest payments on the debt. The CBO’s forecast assumes that discretionary spending will gradually decline over the next 10 years as percentage of GDP. Discretionary spending includes federal spending on defense and all other government programs apart from those, like Social Security, where spending is mandated by law.
To avoid the persistent deficits, and increasing debt that results, Congress would need to do one (or a combination) of the following:
1. Reduce the currently scheduled increases in mandatory spending (in political discussions this alternative is referred to as entitlement reform because entitlements is another name for manadatory spending).
2. Decrease discretionary spending, the largest component of which is defense spending.
3. Increases taxes.
There doesn’t appear to be majority support in Congress for taking any of these steps.
The CBO’s latest forecast seems gloomy, but may actually understate the likely future increases in the federal budget deficit and federal debt. The CBO’s forecast assumes that future outlays and taxes will occur as indicated in current law. For example, the forecast assumes that many of the tax cuts Congress passed in 2017 will expire in 2025 as stated in current law. Many political observers doubt that Congress will allow the tax cuts to expire as scheduled because to do so would result in increases in individual income taxes for most people. (Here is a recent article in the Washington Post that discusses this point. A subscription may be required to access the full article.) The CBO also assumes that defense spending will not increase beyond what is indicated by current law. Many political observers believe that, in fact, Congress may feel compelled to substantially increase defense spending as a result of Russia’s invasion of Ukraine in February 2022 and the potential military threat posed by China.
The CBO forecast also assumes that the U.S. economy won’t experience a recession between 2023 and 2033, which is possible but unlikely. If the economy does experience a recession, federal outlays for unemployment insurance and other programs will increase and federal personal and corporate income tax revenues will fall. The CBO’s forecast also assumes that the interest rate on the 10-year Treasury note will be under 4 percent and that the federal funds rate will be under 3 percent (interest rates on short-term Treasury debt move closely with changes in the federal funds rate). If interest rates turn out to be higher than these forecasts, the federal government’s interest payments will increase, further increasing the deficit and the debt.
In short, the federal government is clearly facing the most difficult budgetary situation since World War II.
There are many macroeconomic forecasts. Some forecasts are made by private economists, including those who work for Wall Street Investment firms. Other forecasts are made by economists who work for the government. Perhaps the most widely used macroeconomic forecasts are those published by economists who work for the Congressional Budget Office (CBO). The CBO is a nonpartisan agency within the federal government that provides estimates of the economic effects of government policies as part of the process by which Congress prepares the federal budget. One important aspect of the CBO’s work is to estimate future federal government budget deficits.
To forecast the size of future deficits, the CBO needs to forecast growth in key macroeconomic variables, including GDP. Faster growth in the U.S. economy should result in faster growth in federal tax revenues and slower growth in federal government transfer payments, including payments the federal government makes under the unemployment insurance system, the Temporary Assistance for Needy Families program, and the Supplemental Nutrition Assistance Program. When revenues grow faster than expenditures, the federal budget deficit shrinks.
The CBO’s forecasts of potential GDP provide perhaps the most best known projections of the future economic growth of the U.S. economy. The CBO calculates its forecasts of potential GDP by forecasting the variables that potential GDP depends on. As we’ve seen in Macroeconomics, Chapters 10 (Economics, Chapters 20), the two key variables in determining the growth in real GDP are the growth in labor productivity—the ratio of real GDP to the quantity of labor—and the growth of the labor force.
How well has the CBO forecast future U.S. economic growth? Or, equivalently, how well has the CBO forecast potential GDP. Each year the CBO publishes forecasts of potential GDP for the following 10 years and for longer periods—typically 40 or 50 years. Claudia Sahm, an economic consultant and opinion writer and formerly an economist at the Federal Reserve and the White House, has noted that the CBO’s 10-year forecasts of potential GDP have not been good forecasts of the actual growth of real GDP. Over the past 15 years, the CBO has also carried out surprisingly large downward revisions of its forecasts of potential GDP.
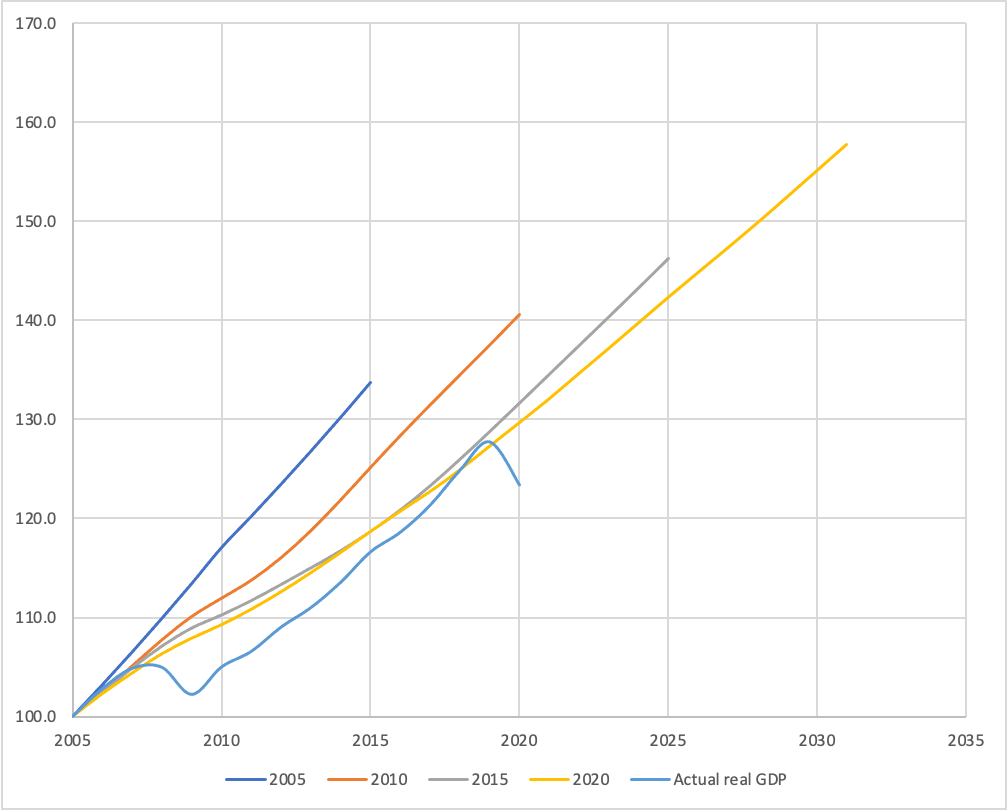
The figure below is similar to one prepared by Sahm and shows the forecasts of potential GDP the CBO published in 2005, 2010, 2015, and 2020 for the following 10 years. (For Sahm’s Twitter thread discussing her figure, click HERE.) That is, in 2005, the CBO issued a forecast of potential GDP for the years 2005–2015. In 2010, the CBO issued a forecast of potential GDP for the years 2010–2020, and so on. Note that for ease of comparison, all GDP values in the figure are set equal to a value of 100 in 2005.
Each straight line on the chart represents the CBO’s forecast of potential GDP over the 10 years following the year in which the forecast was published. For example, the top blue line represents the forecasts the CBO made in 2005 of the values of potential GDP for the years 2005 to 2015. The bottom blue line shows the actual values of real GDP for the years from 2005 to 2020. Note how at each five year interval, the CBO’s forecasts of potential GDP shifted down.
We can look at a few examples of how far off the CBO’s projections were. For instance, if the economy had grown as rapidly between 2005 and 2015 as the CBO forecast it would in 2005, real GDP would have been about 15 percent higher than it actually was. In other words, the U.S. economy would have produced about $2.5 trillion more in goods and services than it actually did. Similarly, if the economy had grown as rapidly between 2010 and 2019 as the CBO forecast it would in 2010, real GDP in 2019 would have been about 7.5 percent (or about $1.5 trillion) higher than it actually was.
Why has the CBO persistently overestimated the future growth rate of the U.S. economy? The main source of error has been the CBO’s overestimation of the growth in labor force productivity. They have also slightly overestimated the growth of the labor force. Claudia Sahm has a more basic criticism of the CBO’s approach to estimating potential GDP. She argues that if real GDP grows slowly during a period, perhaps because monetary and fiscal policies are insufficiently expansionary, the CBO will incorporate the lower actual real GDP values when it updates its forecasts of potential GDP. This approach can raise questions as to whether the CBO is actually measuring potential GDP as most economist’s define it (and as we define it in the textbook): The level real GDP attains when all firms are producing at capacity. Other economists share these concerns. For instance, Daan Struyven, Jan Hatzius, and Sid Bhushan of the Goldman Sachs investment bank, argue that the CBO’s estimate of potential GDP understates the true capacity of the U.S. economy by 3 to 4 percent.
The CBO’s substantial adjustments to its forecasts of potential GDP are another indication of how volatile the U.S. economy has been since the beginning of the 2007–2009 recession.
Sources: Tyler Powell, Louise Sheiner, and David Wessel, “What Is Potential GDP, and Why Is It So Controversial Right Now,” brookings.edu, February 22, 2021; and Congressional Budget Office, “Budget and Economic Data,” various years.