Photo from Reuters via the Wall Street Journal.
On Friday, April 5—the first Friday of the month—the Bureau of labor Statistics (BLS) released its “Employment Situation” report with data on the state of the labor market in March. The BLS reported a net increase in employment during March of 303,000, which was well above the increase that economists had been expecting. The previous estimates of employment in January and February were revised upward by 22,000 jobs. (We also discuss the employment report in this podcast.)
Employment increases during the second half of 2023 had slowed compared with the first half of the year. But, as the following figure from the BLS report shows, since December 2023, employment has increased by more than 250,000 in each month. These increases are far above the estimated increases of 70,000 to 100,000 new jobs needed to keep up with population growth. (But note our later discussion of this point.)

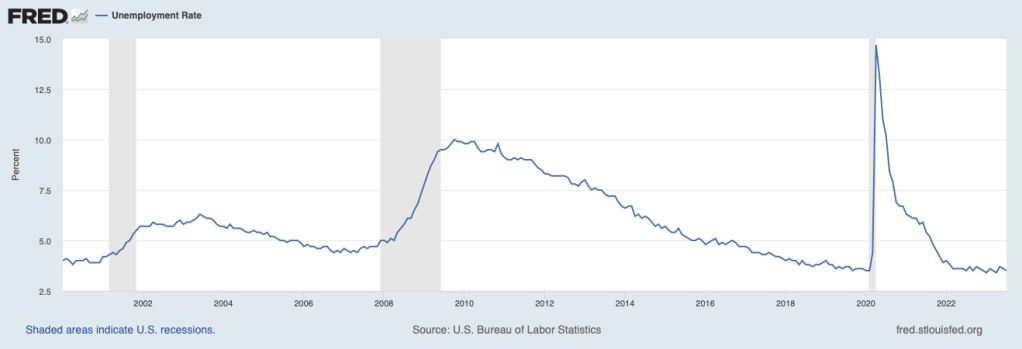
The unemployment rate had been expected to stay steady at 3.9 percent, but declined slightly to 3.8 percent. As the following figure shows, the unemployment rate has been remarkably stable for more than two years and has been below 4.0 percent each month since December 2021. The members of the Federal Open Market Committee (FOMC) expect that the unemployment rate for 2024 will be 4.0 percent, a forcast that is beginning to seem too high.

The monthly employment number most commonly reported in media accounts is from the establishment survey (sometimes referred to as the payroll survey), whereas the unemployment rate is taken from the household survey. The results of both surveys are included in the BLS’s monthly “Employment Situation” report. As we discuss in Macroeconomics, Chapter 9, Section 9.1 (Economics, Chapter 19, Section 19.1), many economists and policymakers at the Federal Reserve believe that employment data from the establishment survey provides a more accurate indicator of the state of the labor market than do either the employment data or the unemployment data from the household survey.
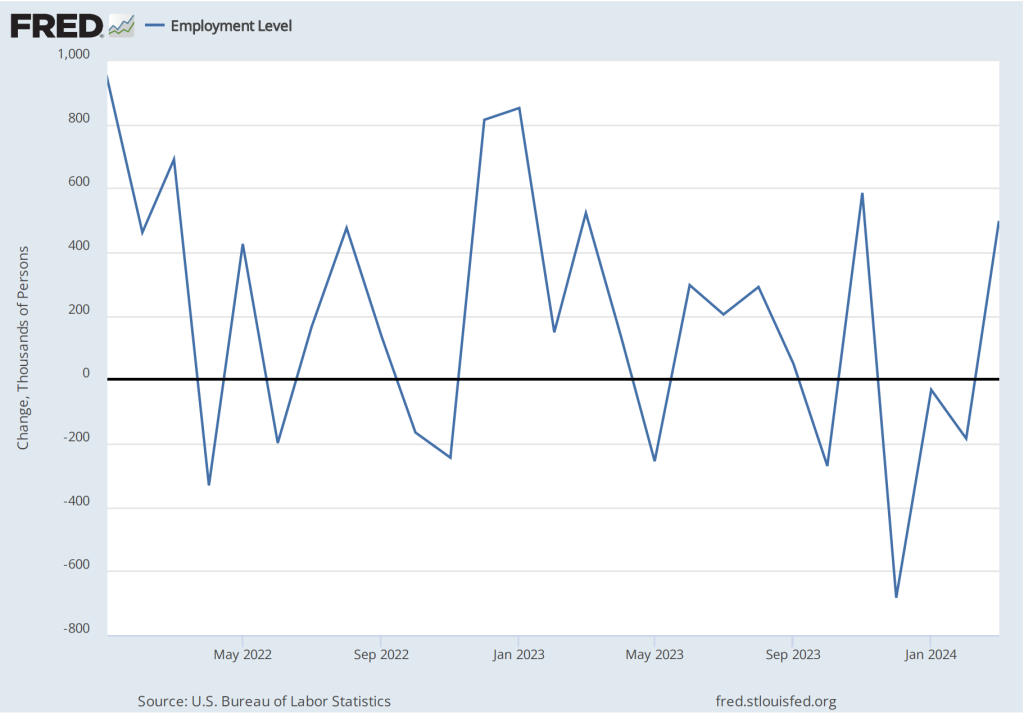
As we noted in a previous post, whereas employment as measured by the establishment survey has been increasing each month, employment as measured by the household surve declined each month from December 2023 through February 2024. But, as the following figure shows, this trend was reversed in March, with employment as measured by the household survey increasing 498,000—far more than the 303,000 increase in employment in establishment survey. This reversal may be another indication of the underlying strength of the labor market.
As the following figure shows, despite the substantial increases in employment, wages, as measured by the percentage change in average hourly earnings from the same month in the previous year, have been trending down. The increase in average hourly earnings declined from 4.3 percent February in to 4.1 percent in March.

The following figure shows wage inflation calculated by compounding the current month’s rate over an entire year. (The figure above shows what is sometimes called 12-month wage inflation, whereas this figure shows 1-month wage inflation.) One-month wage inflation is much more volatile than 12-month inflation—note the very large swings in 1-month wage inflation in April and May 2020 during the business closures caused by the Covid pandemic.
Wages increased by 6.1 percent in January 2024, 2.1 percent in February, and 4.2 percent in March. So, the 1-month rate of wage inflation did show an increase in March, although it’s unclear whether the increase was a result of the strength of the labor market or reflected the greater volatility in wage inflation when calculated this way.

Some economists and policymakers are surprised that low levels of unemployment and large monthly increases in employment have not resulted in greater upward pressure on wages. One possibility is that the supply of labor has been increasing more rapidly than is indicated by census data. In a January report, the Congressional Budget Office (CBO) argued that the Census Bureau’s estimate of the population of the United States is too low by about 6 million people. This undercount is attributable, according to the CBO, largely the Census Bureau having underestimated the amount of immigration that has occurred. If the CBO is correct, then the economy may need to generate about 200,000 net new jobs each month to accommodate the growth of the labor force, rather than the 80,000 to 100,000 we mentioned earlier in this post.
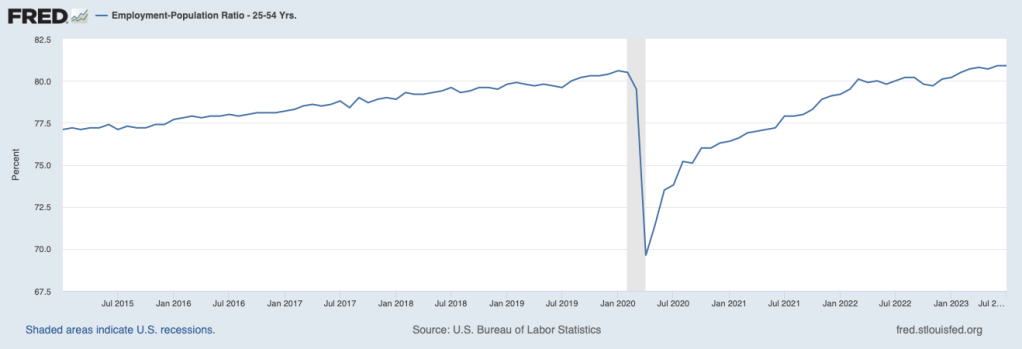
Federal Reserve Chair Jerome Powell noted in a press conference following the most recent meeing of the FOMC that: “Strong job creation has been accompanied by an increase in the supply of workers, reflecting increases in participation among individuals aged 25 to 54 years and a continued strong pace of immigration.” As a result:
“what you would have is potentially kind of what you had last year, which is a bigger economy where inflationary pressures are not increasing. In fact, they were decreasing. So you can have that if you have a continued supply-side activity that we had last year with—both with supply chains and also with, with growth in the size of the labor force.”
If Powell is correct, in the coming months the U.S. economy may be able to sustain rapid increases in employment without those increases leading to an increase in the rate of inflation.