What’s Going on in the Bond Market?

Image created by ChatGPT

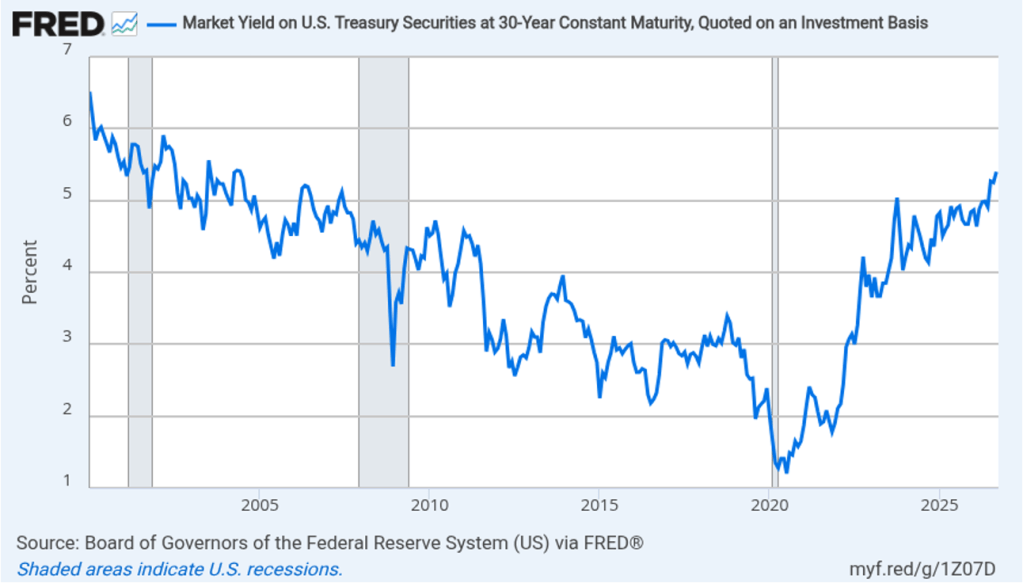
As the following figure show, as of yesterday, the yield on the 30-year U.S. Treasury bond is the highest it’s been since 2004, before the Global Financial Crisis.
The following figure (created by ChatGPT using data from this Treasury website) shows that Treasury bonds at all maturities have risen this year. Recall that the maturity of a bond is the amount of time until the seller of the bond repays the principal to the buyer of the bond. Formally, a Treasury security with a maturity of 1 year or less is a Treasury bill, a Treasury security with with a maturity of 2 years to 10 years is a Treasury note, and a Treasury security with of more than 10 years is a Treasury bond. For simplicity, in this post we’ll usually refer to all Treasury securities as bonds. We’ll refer interchangeably to the interest rate on a bond and the yield on the bond. Formally, the relevant interest rate in this post is the yield to maturity. (We discuss the bond market in Money, Banking, and the Financial System, Chapters 3-5. A new edition is available now.)
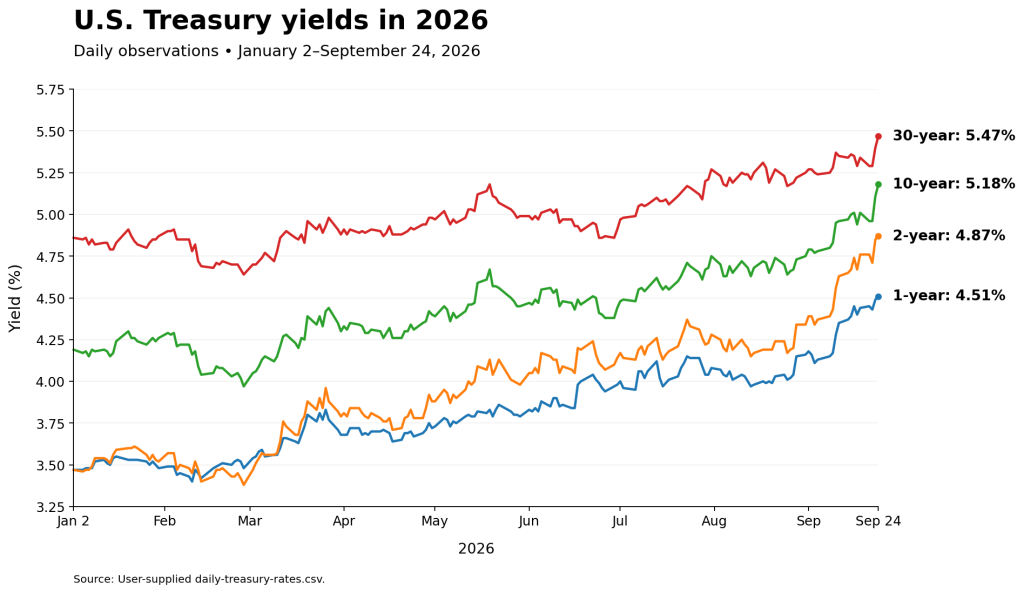
Rising yields on Treasury securities have a substantial effect on the economy. On most days, nearly all of the buying and selling in the Treasury bond market is of existing bonds that the U.S. Treasury may have issued decades earlier. Because the federal government has been running large budget deficits, the Treasury has to issue billions of new Treasury bonds each year. Investors will only buy newly issued Treasury bonds if their yields are competitive with the yields on existing bonds. As a result, interest payments have been a rising fraction of total federal spending, which contributes to the federal budget deficit.

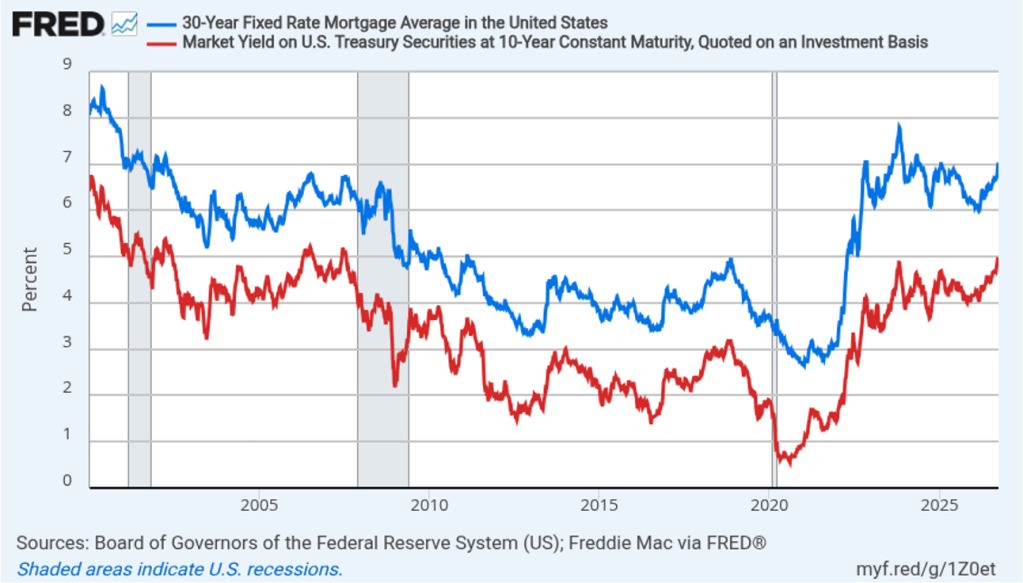
Firms that grant mortgage loans typically adjust the interest rates they charge as the yield on the 10-year Treasury changes. The difference between the interest rate on mortgages and the interest rate on the 10-year Treasury is called the mortgage spread. The following figure shows the close relationship between movements in the mortgage interest rate (the blue line) and movements in the interest rate on 10-year Treasurys (the red line). The recent increase in the yields on 10-year Treasurys has caused an increase in the mortgage interest rate.
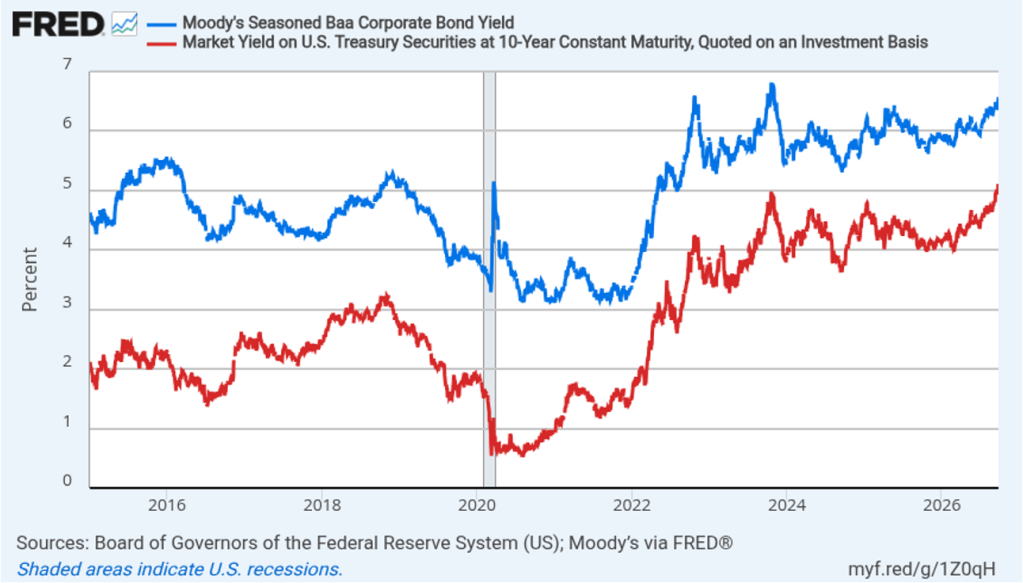
Many investors hold both Treasury bonds and bonds issued by corporations. If the yields on Treasury bonds rise, to attract investors the yields on corporate bonds also have to rise. The following figure shows that there is a close relationship between the yield on 10-year Treasurys and the yield on corporate bonds. The interest rate on corporate bonds is higher than the interest rate on Treasurys for two key reasons: First, corporate bonds have a higher default risk, which is the risk that a bond issuer will fail to make payments of interest or principal. Second., corporate bonds are less liquid than Treasurys, which means that because the market for Treasurys is much larger than the market for any corporate bond, an investor can more easily sell a Treasury bond. Investors need to be compensated with a higher interest rate on corporate bonds for the greater default risk and lower liquidity of these bonds.
What’s caused the increases in interest rates? Several factors are involved. First, in part because of rising oil prices resulting from conflict in the Middle East, since the middle of 2026 there has been an increase in the inflation rate that investors in bond markets expect to prevail over the next few years. Inflation reduces the purchasing power of the payments investors receive from owning a bond. The Fisher effect refers to the argument by Irving Fisher, who was an economist at Yale University, that the nominal interest rate on a bond will rise point-for-point with changes in the expected inflation rate. (Recall from Macroeconomics, Chapter 9 (Economics, Chapter 19) that the nominal interest rate is the stated interest rate on a bond. We can approximate the real interest rate by subtracting the expected inflation rate from the nominal interest rate.) The following figure from Chapter 4 of Money, Banking, and the Financial System, illustrates the Fisher effect.
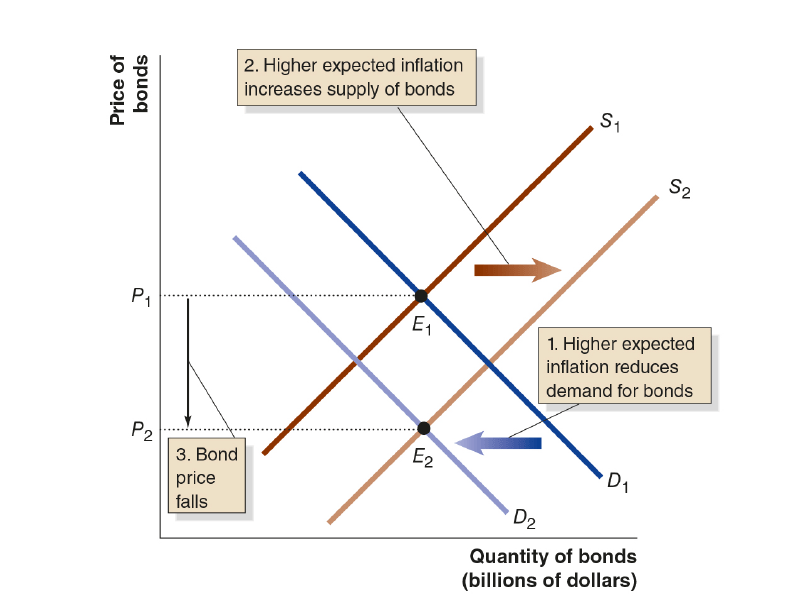
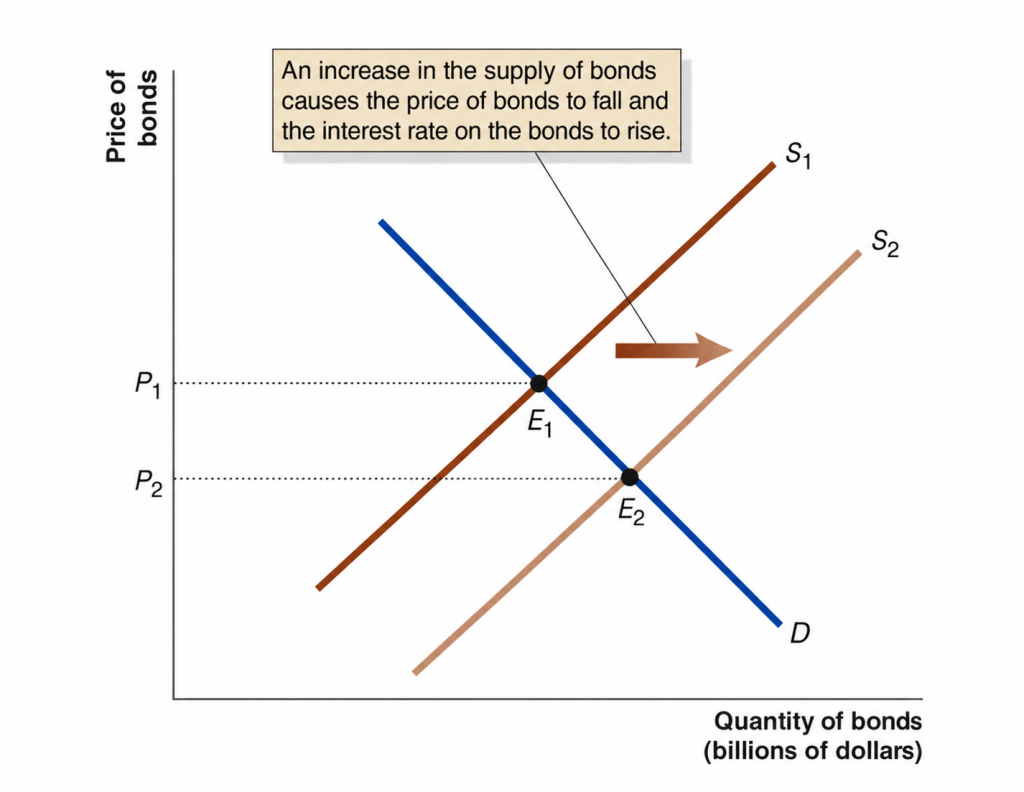
A higher expected inflation rate increases the quantity of bonds supplied at any given bond price because inflation reduces the real value of the payments that bond issuers have to make. In the figure, the supply curve for bonds shifts to the right from S1 to S2. A higher expected inflation rate decreases the quantity of bonds demand at any given bond price because inflation reduces the real value of the payments that bond buyers receive. The demand curve for bonds shift to the left from D1 to D2. Note that because the equilibrium price of bonds declines from P1 to P2, the interest rate—which moves inversely with the price—increases. In practice, economists have found that various real-world frictions result in nominal interest rates not always increasing or decreasing by exactly the amount of a change in expected inflation. But the basic point holds that changes in the expected inflation rate lead to changes in the interest rates on bonds.

The second reason that interest rates have been rising is related to the first reason. As we discuss in this blog post, because the inflation rate has been running persistently higher than the Federal Reserve’s 2 percent annual target, at its September meeting the Fed’s Federal Open Market Committee (FOMC) raised its target for the federal funds rate. Investors in the federal funds futures market expect that the committee will raise its federal funds rate target further in coming meetings. The following figure shows that the interest rate on 1-year Treasury bills tracks closely movements in the federal funds rate.
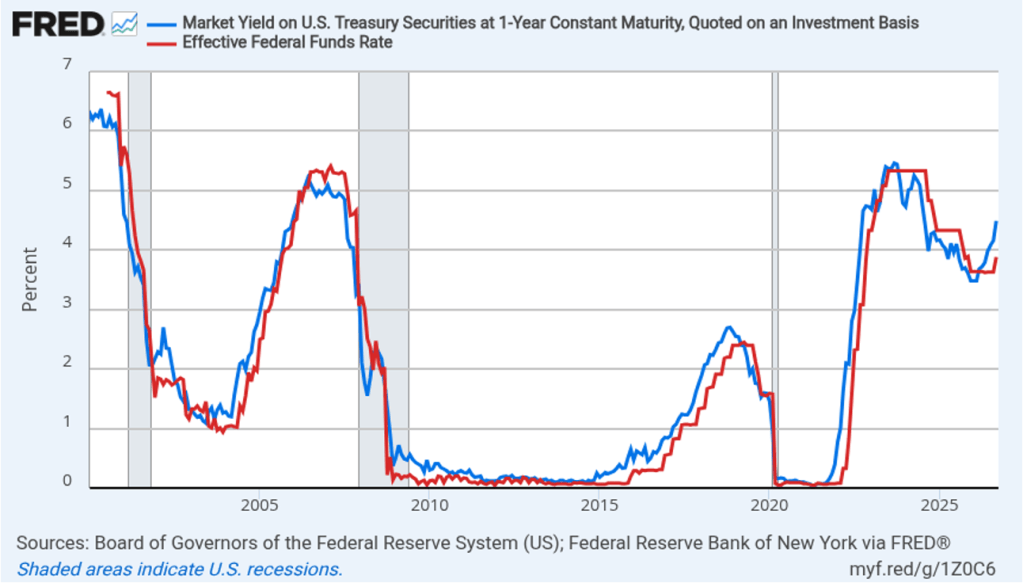
Changes in expected future short-term interest rates, such as the expected interest rate on the 1-year Treasury bill one year from now, can affect longer-term interest rates. For example, someone who wants to invest in Treasurys for two years could either buy a 2-year Treasury or buy a 1-year Treasury today and another 1-year Treasury in a year. We would expect that buying and selling in the bond market would make the return from these two ways of investing equal—a process called arbitrage. If investors expect that the FOMC will raise its target for the federal funds rate in the future, the expected interest on the 1-year Treasury bill a year from now will increase, which will also increase the interest rate today on a 2-year Treasury. The same process will also cause interest rates on longer-maturity bonds to increase.

Third, the supply of bonds has been increasing rapidly. As we’ve seen, high federal government budget deficits will cause the Treasury to issue close to $2 trillion in bonds this year. In addition, technology firms, such as as Meta, Alphabet (the parent company of Google), Amazon, and Oracle, have been increasing their bond sales to obtain the funds to build out the infrastructure, such as data centers, necessary to power the AI build out. According to data from the Securities Industry and Financial Markets Association, through August of 2026, corporate bond issuance was nearly 30 percent greater than in 2025.

(Note that most other high income countries, including Japan, Canada, and the countries of Western Europe, have also been running large government budget deficits and issuing large quantities of bonds. Because investors can buy and sell bonds across countries, higher interest rates in one country can put upward pressure on interest rates in other countries.)

As the following figure shows, an increase in the supply of bonds, holding other factors that can affect the demand or supply of bonds constant, causes the price of bonds to fall and, therefore, the interest rate on bonds to rise.
Following the Global Financial Crisis of 2007–2009, low inflation rates and a federal funds rate close to zero resulted in low interest rates on most bonds. For example, the 10-year Treasury note was below 4 percent—and typically below 3 percent—from late 2008 to late 2022. Some economists believed that interest rates would remain low for the foreseeable future. But the sharp increase in inflation rates that began in the spring of 2021, following the Covid pandemic, continuing high federal budget deficits, and tech firms demand for funds to build data centers and other AI infrastructure has led to the highest interest rates in more than 20 years. Whether these high interest rates will persist depends primarily on future inflation rates and future federal budget deficits.
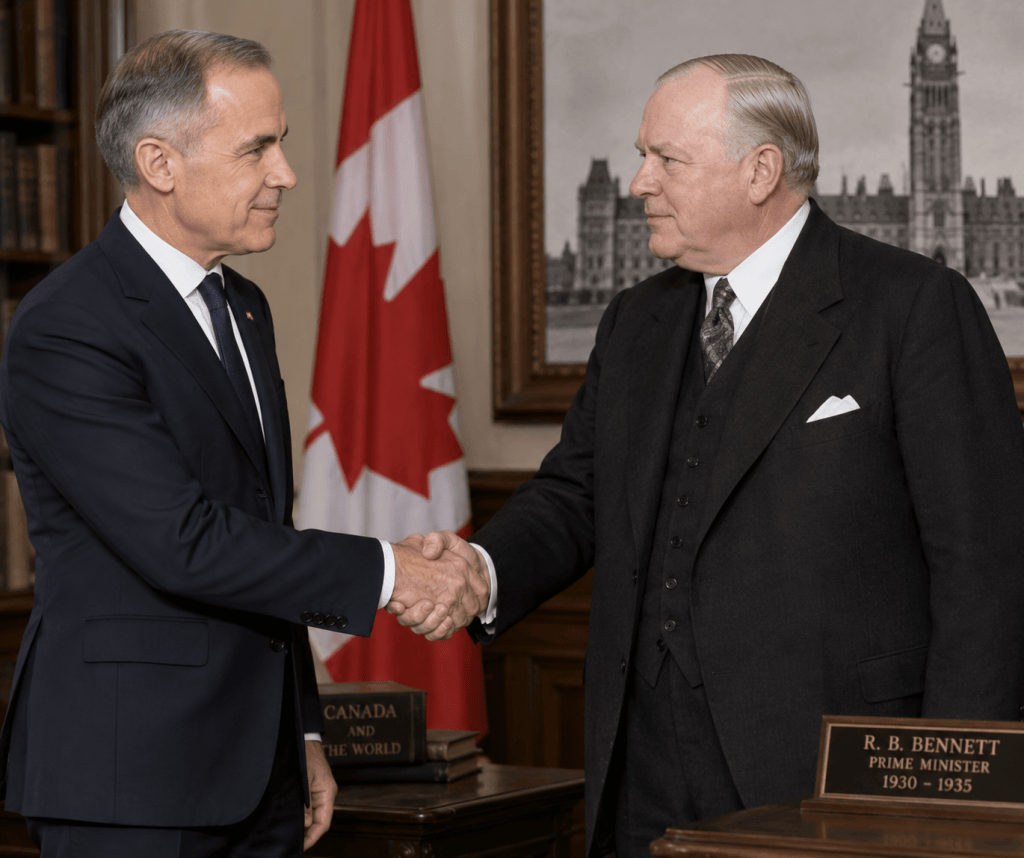

Canadian Prime Minster Mark Carney, Meet Canadian Prime Minister R. B. Bennett

Image created by ChatGPT

The United States and Canada have a long history of friendly relations and, famously, share the longest undefended border in the world. Trade in goods and services has also linked the two countries with substantial economic benefits to both. By and large, trade flows reflect each country’s comparative advantage in producing goods and services. (We discuss the important role of comparative advantage in international trade in Microeconomics, Chapter 9 (Economics, Chapter 9 and Macroeconomics, Chapter 7).)

Image created by ChatGPT

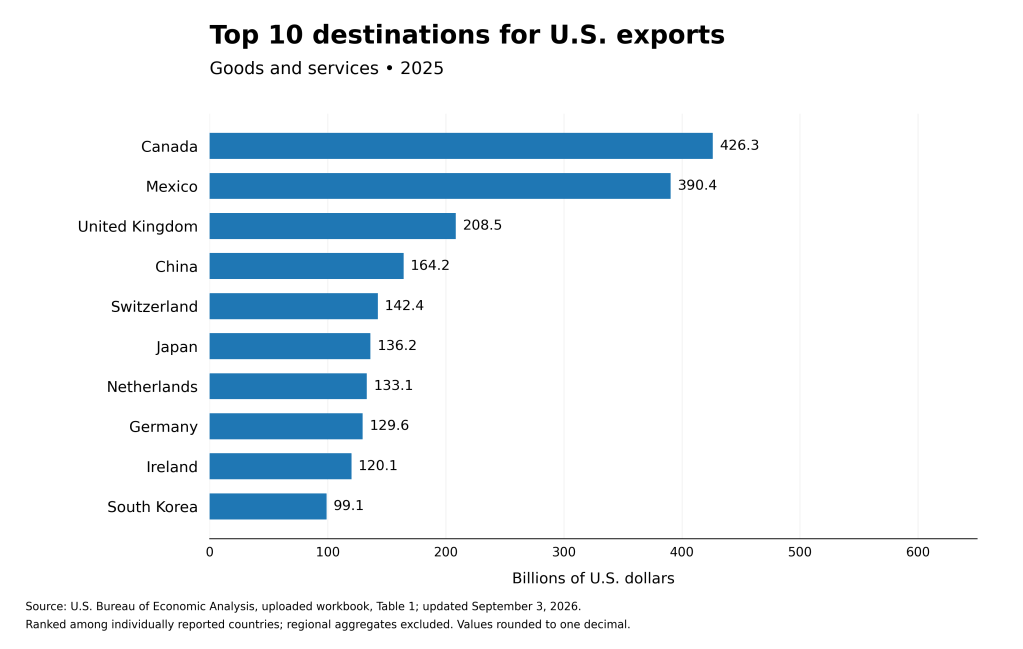
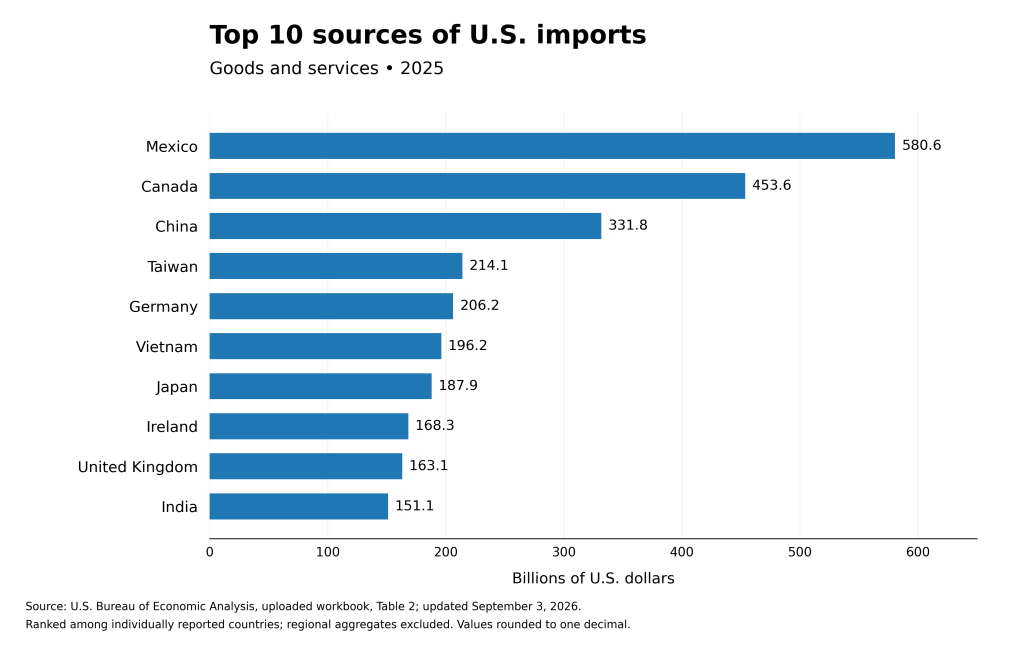
The following figures show that in 2025, Canada was the leading market for U.S. exports and the second leading source of U.S. imports, behind only Mexico.

The two figures were prepared by ChatGPT using data from the U.S. Bureau of Economic Analysis.

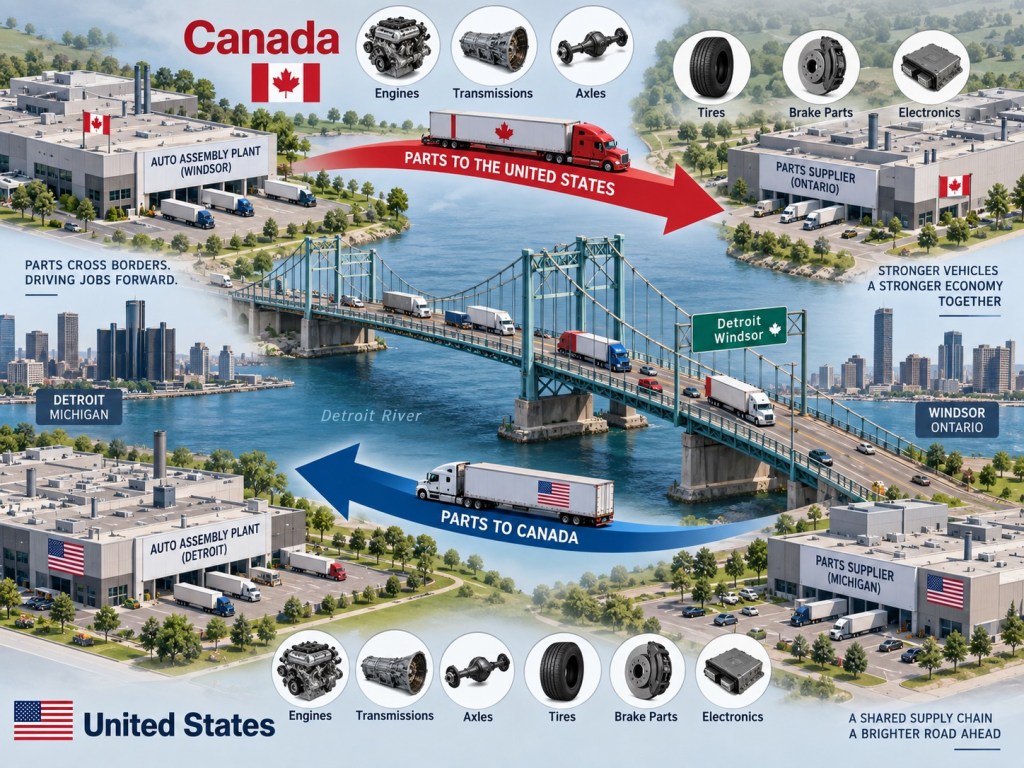
Beyond trade in final goods and services, a number of U.S. and Canadian firms rely on capital goods and intermediate goods produced in the other country. For instance, in 2025, U.S. automobile manufacturers imported auto parts worth $19.5 billion from Canada. In other words, the supply chains of these firms rely on Canadian-produced parts.

Image created by ChatGPT

Economic relations between the United States and Canada have not always been smooth, however. In particular, the substantial increases in U.S. tariff rates in 1930 and during the second Trump administration resulted in sharp reactions from the Canadian government.

In 1930, Congress passed and President Herbert Hoover signed into law the Smoot-Hawley Tariff. In retaliation, Canadian Prime Minister William Lyon Mackenzie King and the Liberal Party significantly raised tariffs on U.S. imports. (We discussed the Smoot-Hawley Tariff in this blog post last year.) In the July 1930 Canadian elections, as the effects of the Great Depression began to be felt, Richard Bedford Bennett, the leader of the Conservative Party campaigned on using tariff increases to increase production and reduce unemployment. In a campaign speech, Bennett argued, “You have
been taught to mock at tariffs and applaud free trade. Tell me, when did free
trade fight for you? You say our tariffs are only for the manufacturers; I will
make them fight for you as well. I will use them to blast a way into the markets
that have been closed to you.”

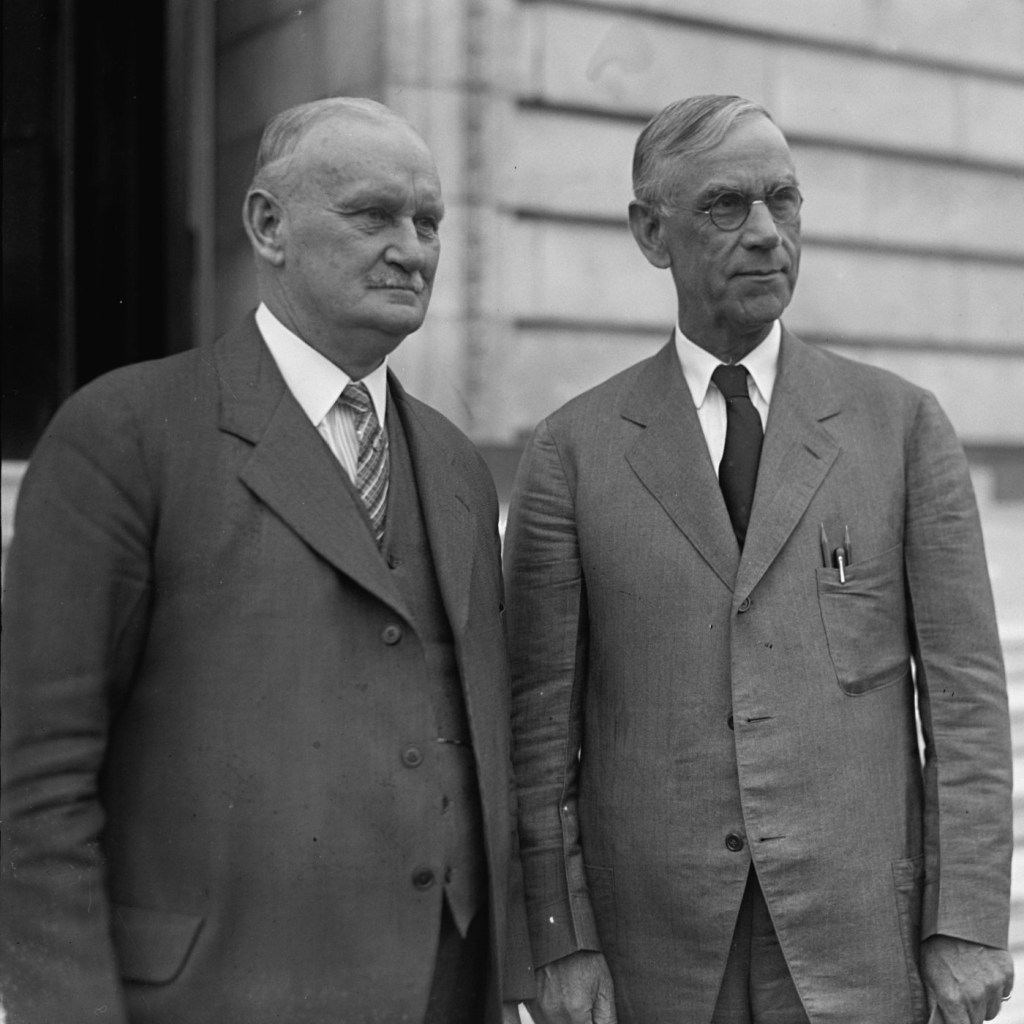
Photo of Congressman Willis Hawley of Oregon and Senator Reed Smoot from the U.S. Library of Congress via the Wall Street Journal.

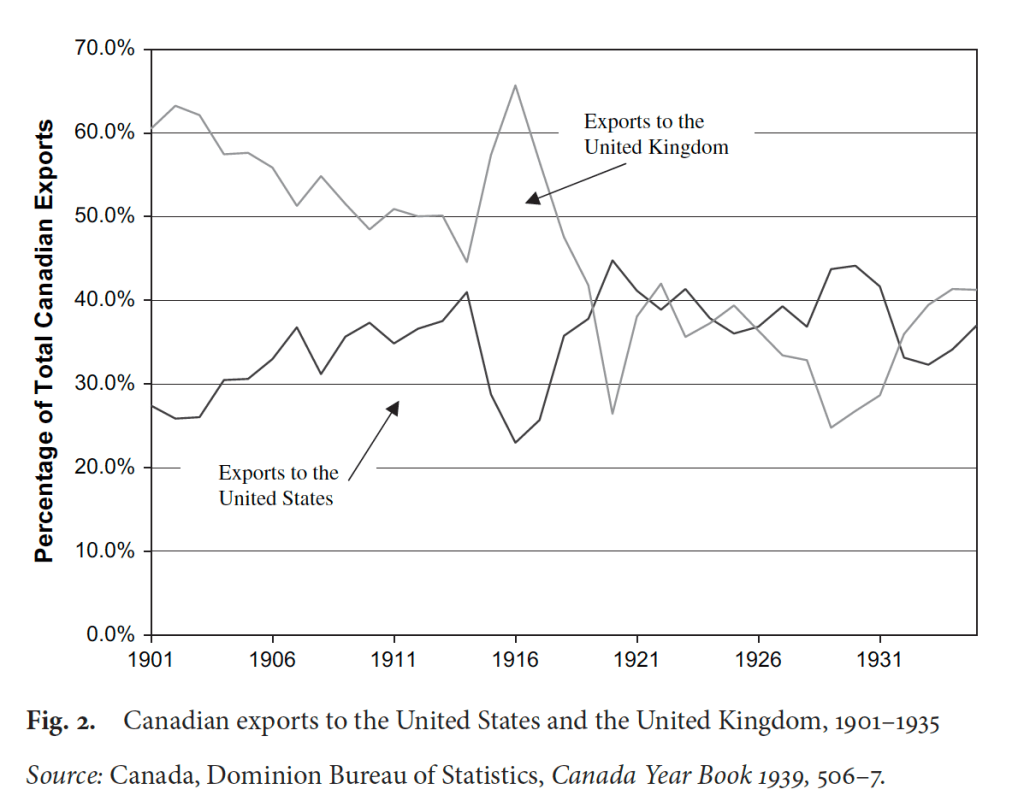
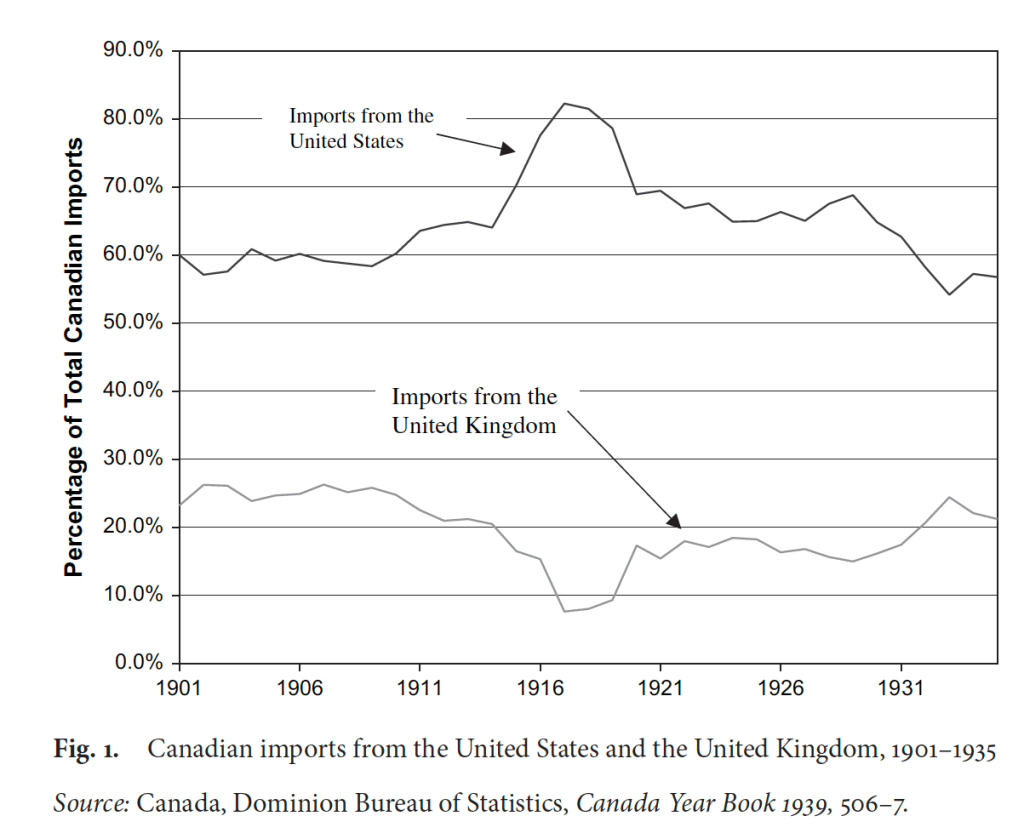
The Conservatives won an overwhelming victory in the 1930 election, and the Canadian Parliament passed legislation that raised Canadian tariff rates on U.S. imports to the highest levels in history. Bennett hoped that Canada could replace the decline in exports to the United States with an increase in exports to the United Kingdom. The following two figures, from an academic paper Tony published with his Lehigh colleague Judith MacDonald, indicate the unlikelihood of Bennett’s plan succeeding. For most of the twentieth century up to 1930 (with the exception of the World War I period), the share of Canadian exports that went to the United Kingdom had been declining, while the share that went to the United States had been increasing. In addition, in 1930, more than 60 percent of Canadian imports came from the United States as opposed to less than 20 percent coming from the United Kingdom.

For reasons of geography and the long-established trading relations between U.S. and Canadian firms, a major reorienting of Canada’s trade away from the United States and toward the United Kingdom wasn’t feasible. By 1935, near the end of his five-term, Bennett pivoted to attempting to negotiate a reciprocal trade agreement with the United States that would result in both countries reducing their tariffs on each other’s products. An agreement was reached in November 1935, but that was too late for Bennett who had been voted out of office in July.

The higher tariffs that the Trump administration has imposed on Canadian imports has placed Canadian Prime Minister Mark Carney in a situation similar to that Bennett faced in 1930. Like Bennett, Carney has responded to the higher tariffs by increasing tariffs on imports from the United States. And like Bennett, Carney has tried to find new markets outside of the United States for Canadian exports. According to an article in the Wall Street Journal:

“Carney has instructed his special envoy to Europe to scope out the most ambitious possibilities short of full membership in the [European Union] or its common market, according to people familiar with the matter. The details are still being sketched by technical working groups for what the prime minister has told his aides will be the reorienting of an economy and a society that for half a century has been dominated by the U.S.”

ChatGPT generated this image of the European Parliament building in Brussels, Belgium.

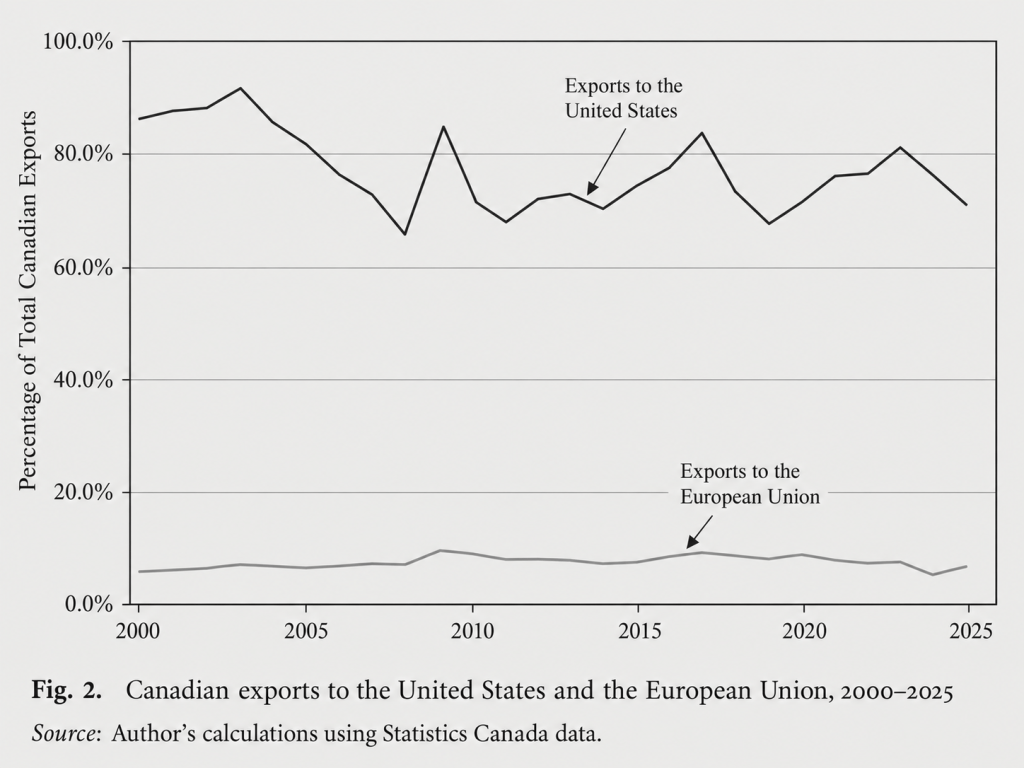
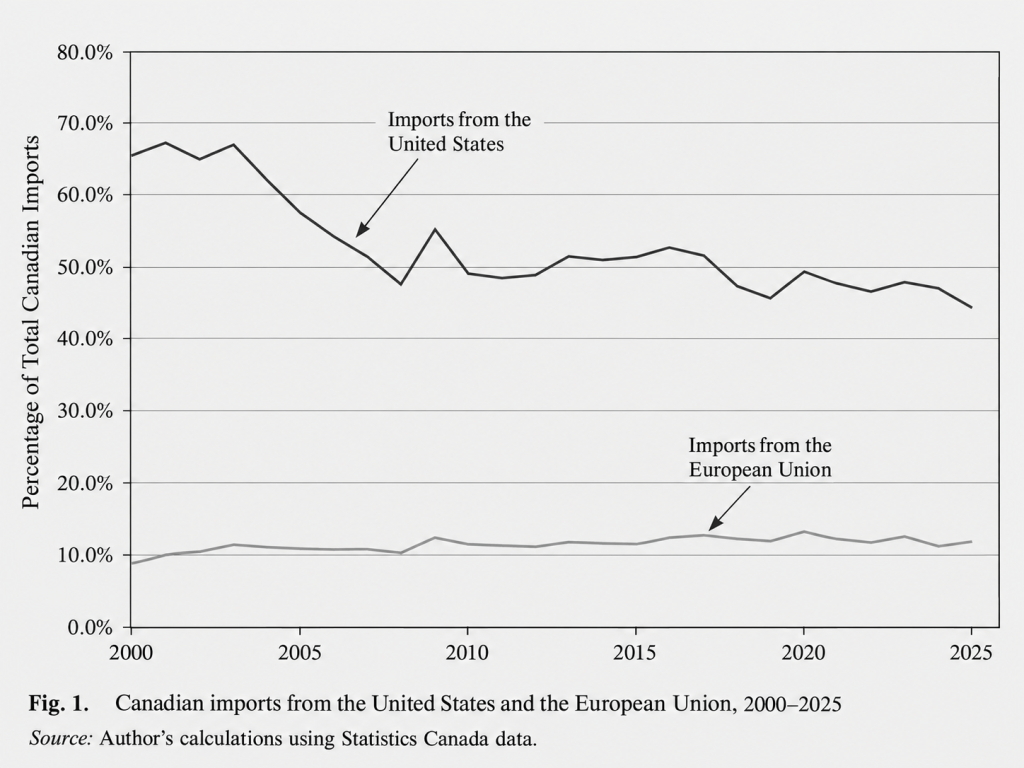
Carney’s plan of shifting Canadian exports from the United States to the European Union (EU) faces obstacles similar to those faced by Bennett as he attempted to substitute markets in the United Kingdom for markets in the United States. As the following figures show, in 2025, more than 70 percent of Canadian exports of goods went to the United States, while less than 6 percent went to the EU. Similarly, about 45 percent of the Canadian imports of goods were from the United States, while less than 12 percent were from the EU.

It may well be that Carney’s negotiations with officials in the EU are an attempt to push the United States into agreeing to reduce tariffs on Canadian imports. As a practical matter, though, it seems unlikely that Canada can reorient its trading relationships from the United Sates to the EU to any significant degree.

Why Doesn’t Apple Manufacture the MacBook Neo in the United States?

Image of the MacBook Neo from apple.com

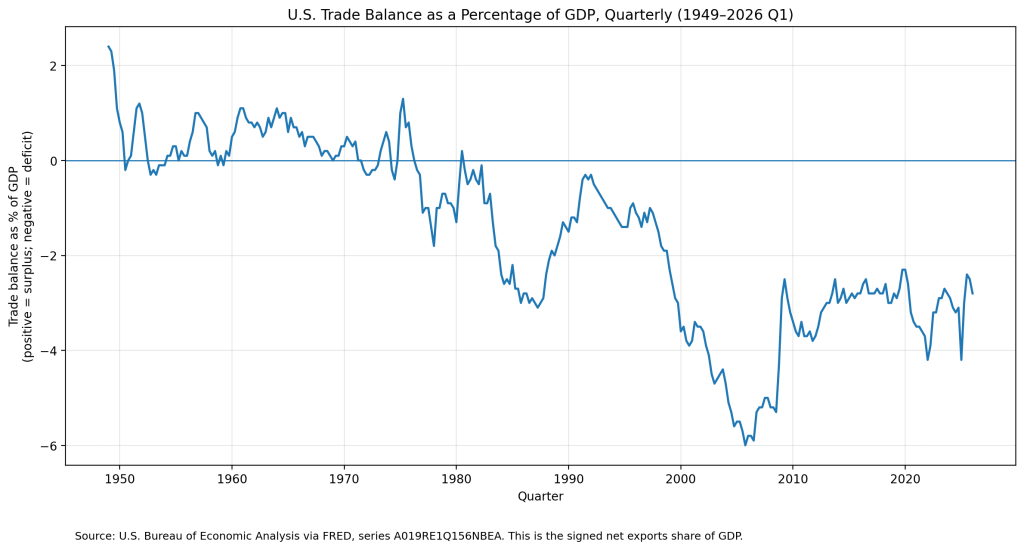
The United States hasn’t exported more goods and services than its imported since 1975. The following figure shows the U.S. trade deficits since 1949 as a percentage of GDP. (In this figure, we’re measuring the trade balance as net exports rather than the trade balance as reported in the balance of payment accounts. The two measures are highly correlated.)

As we discuss in Macroeconomics, Chapter 18 (Economics, Chapter 28), a trade deficit is driven by the relationship between a country’s national saving and domestic investment rather than by the competitiveness of a country’s exports or by the trade agreements a country has with its trading partners.

Clearly, though, many politicians see a trade deficit as a problem. Some politicians have argued that the U.S. trade deficit would shrink if more of the manufactured goods Americans consume were produced in the United States. Would it be possible, for example, to produce more consumer electronics in the United States? A few months ago, Apple stopped assembling units of the Mac Pro, its high-end, professional workstation computer, at a facility in Austin, Texas. More recently, Apple announced that it would begin assembling its Mac Mini, a compact desktop computer that lacks a keyboard and a monitor, in a new factory in Houston. These examples indicate that Apple can produce electronic products in the United States. But the number of Mac Pros or Mac Minis Apple sells each year is very small compared with the estimated 248 million iPhones it sold in 2025.

In March, Apple introduced the MacBook Neo. At a price of $599 ($499 if you are a college student or faculty member), the Neo is Apple’s first entry into the low-priced laptop market that had been dominated by the Google Chromebook. By the end of April, sales were running far above Apple’s initial forecasts and the firm was planning to double production of the Neo from 5 million units to 10 million—all of which would be assembled in China or Vietnam.  

Why doesn’t Apple assemble the Neo in the United States? There are several reasons, but the most important is that the Neo is Apple’s first entry into the low-priced laptop market that is now dominated by Google’s Chromebook—all of which are assembled overseas. Apple is able to price the Neo at $599 only if it keeps its production costs very low. Workers who assemble electronic products like laptops require substantial training. Firms such as Foxconn and Quanta Computer have been assembling electronic products for many years in countries such as China and Vietnam. As a result, these countries have large numbers of workers experienced in assembling electronic products. U.S.-based firms have many fewer workers with this experience.

Assembly lines for electronic products need to be flexible to respond quickly when firms introduce new models like the Neo. So, in addition to hiring hundreds of thousands of workers to work on assembly lines, Foxconn, Quanta, and other firms operating in China, India, and Vietnam hire thousands of engineers. Typically, these engineers do not have college degrees, but they have sufficient training to rapidly redesign and reconfigure assembly lines to produce new models. In 2010, when President Barack Obama pressed Steve Jobs, the late Apple CEO, to produce iPhones in the United States, Jobs stated that he would need 30,000 such engineers if Apple were to make iPhones in the United States, but “you can’t find that many in America to hire.”

In addition, wages are much higher in the United States than in China or Vietnam. Workers assembling electronic products in China earn about $6 per hour. Workers doing the same jobs in Vietnam earn only about $2 per hour. In the United States, according to the Bureau of Labor Statistics, in April 2026, production workers in computer and electronic product manufacturing were earning $39.32 per hour.

The factories that assemble Apple products in Asia typically have many suppliers located near them—a so-called supplier ecosystem. Some suppliers make components of the products—although other components are produced outside of Asia, including in the United States—as well as providing repair, maintenance, and other services to the factories. The lack of such a supplier ecosystem would make assembling Neos in the United States very difficult. According to an article in the New York Times, when Apple started producing the Mac Pro in Austin, Texas, it had trouble finding a local firm to produce the custom screws needed in assembling the computers. According to the article, “In China, Apple relied on factories that can produce vast quantities of custom screws on short notice. In Texas, … [Apple had to rely on a] 20-employee machine shop that … could produce at most 1,000 screws a day.”

Production of some electronic goods—notably computer chips—has been expanding in the United States. In 2022, Congress passed the Creating Helpful Incentives to Produce Semiconductors (CHIPS) and Science Act. The Act authorized the federal government to pay subsidies to help firms increase chip production in the United States. Intel, TSMC, Samsung, and Micron have all constructed new chip factories in the United States. As we mentioned earlier, Apple intends to assemble its Mac Mini in a new factory in Houston. 

 But the United States lacks a comparative advantage in the assembly of high-volume electronic products like the iPhone or MacBook Neo. So it’s unlikely that the expansion of U.S. chip production will be followed by a similar expansion in the assembly of smartphones and computers.


Glenn’s Advice for Kevin Warsh

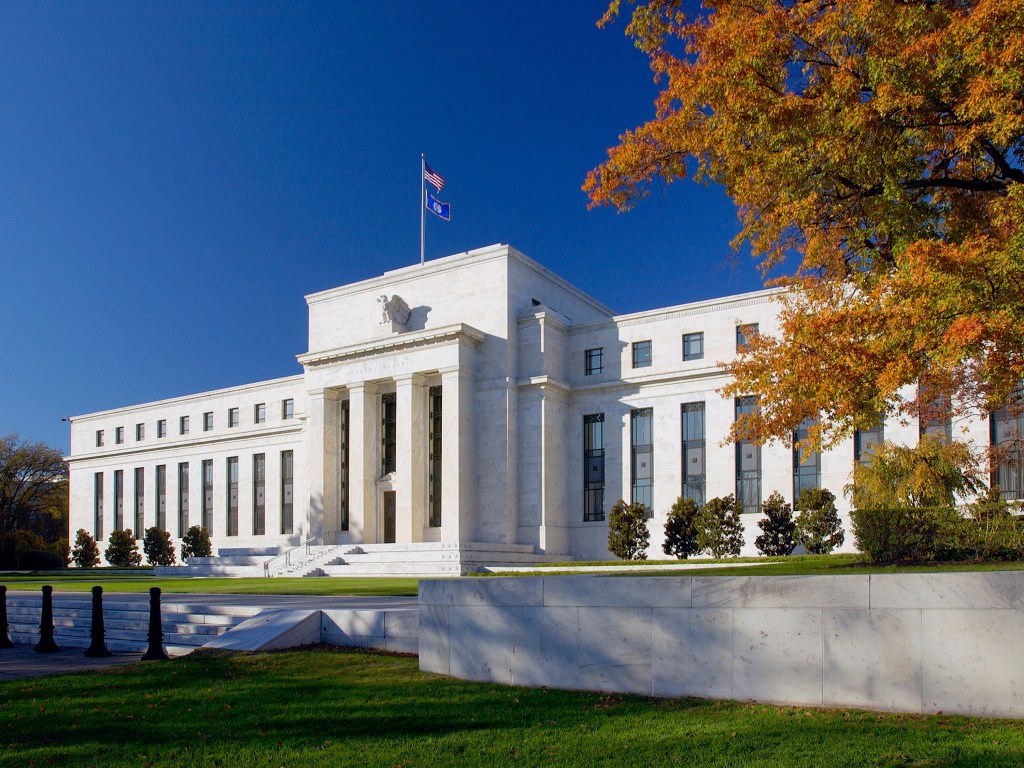
The Marriner S. Eccles building, headquarters of the Federal Reserve in Washington, DC. Image from federalreserve.gov.

The following opinion column appeared in the Financial Times.

What Warsh Should Do at the Fed

Donald Trump’s nomination of Kevin Warsh as chair of the Federal Reserve comes at a pivotal time for the American economy and for the US central bank. A pall has been cast by the administration’s unforced error of trumped-up charges against Jay Powell, the current Fed chair, and the president’s renewed threats to fire him if he does not leave by the end of his term. But the nominee’s credentials and experience ought to ensure a smooth confirmation. The question now should be what happens next.

The Fed faces three challenges. In the short term, the potential impact of the Iran war on employment calls for a careful assessment of the direction of the US economy. In the medium term, inflation continuing to run above the 2 per
cent target will limit the central bank’s room for maneuver, and also call its
credibility into question. In the longer term, questions remain about the
effectiveness of quantitative easing, the size of the Fed’s balance sheet, errors
made in the aftermath of the Covid pandemic, and the central bank’s forays
into areas better left to fiscal or regulatory policy.

All of which means that when Warsh eventually takes up the post, he should
launch an evaluation of the purpose, strategy and structure of the Fed straight
away.

First, purpose. The Federal Reserve was established as a lender of last resort
designed to mitigate financial crises. After it struggled to discharge that role
during the Great Depression, it turned to managing aggregate demand and
inflation. In 1978, Congress used the Humphrey-Hawkins Act to codify its
focus on inflation and employment, while giving the Fed leeway on how to
achieve those objectives. It also required the Fed chair to report to Congress on
its outcomes and outlook.

Warsh should now offer justifications for each of these objectives, set out
clearly what trade-offs they entail and how progress will be communicated.
This clarity focuses markets and elected officials on the importance of low and
steady inflation for US economic performance. And the advent of a new chair
provides an opportunity to make the Fed’s lender-of-last-resort decision-making clearer. Such explanations would be helpful in the present
environment of economic and public policy uncertainty.

Next comes strategy. This is about choosing a set of activities that deliver
objectives consistently. For the Fed, independence in monetary policy and the
ability to flex its balance sheet enable it to keep inflation low and manage
financial turmoil. Political assaults on its independence, of the type we have
recently seen, or restrictions on its balance sheet as a lender of last resort put
these strategic advantages at risk.

To deliver on purpose and strategy, the incoming chair should optimize the
Fed’s structure. The arrangement of a board of governors in Washington,
district banks led by district presidents, a Federal Open Market Committee of
the board and (a rotation of) five district presidents is set by law. But there are
three practical steps Warsh could take to improve the effectiveness of this setup.

First, the central bank should cast a wider net to gather insights from
economists, business leaders and financial market participants, with Fed
conferences reopened to members of these communities. Second, decisions
and direction should be communicated to financial markets and the public
consistently by the chair and by other officials.

Third, replace the notorious “dot plots”, which map FOMC members’
projections for the federal funds rate, with scenarios. Dot plots can be
misinterpreted as signals about the future path of interest rates. By contrast,
scenario analysis models how policy would respond to important changes, such
as shifts in AI investment, supply constraints, the natural rate of
unemployment, and medium-run effects on inflation, the dollar and US
economic activity from the conflict in Iran.

Such a comprehensive evaluation of purpose, strategy and structure would give
Warsh and the Fed both renewed organizational cohesion—and, more
importantly, a game plan.

On the perennial question of interest rates, the US economy’s near-term
momentum and elevated inflation are likely to tilt the balance of risks against
further cuts, despite Trump’s enthusiasm for an immediate cut. And while
Warsh is right to point out that the Fed should learn more about the economic
effects of AI, over the medium run a high-productivity-growth economy is
associated with a higher, not lower, real rate of interest.

Over this crucial period, the ability of the new chair to communicate clearly to
the public the value of low and steady inflation will be vital. The rules
governing the Fed’s role as lender of last resort should also be made clearer.
Finally, Warsh is correct that the Fed should take care to avoid engaging in the
kind of backdoor fiscal policy it has practiced in recent years.

Warsh is smart, informed, experienced in crisis management and an excellent
communicator. If the president allows him a free hand as chair, the American
economy should reap the benefits. Stay tuned.
The United States Typically Runs Surpluses in Services as Well as Deficits in Goods

Image created by ChatGPT

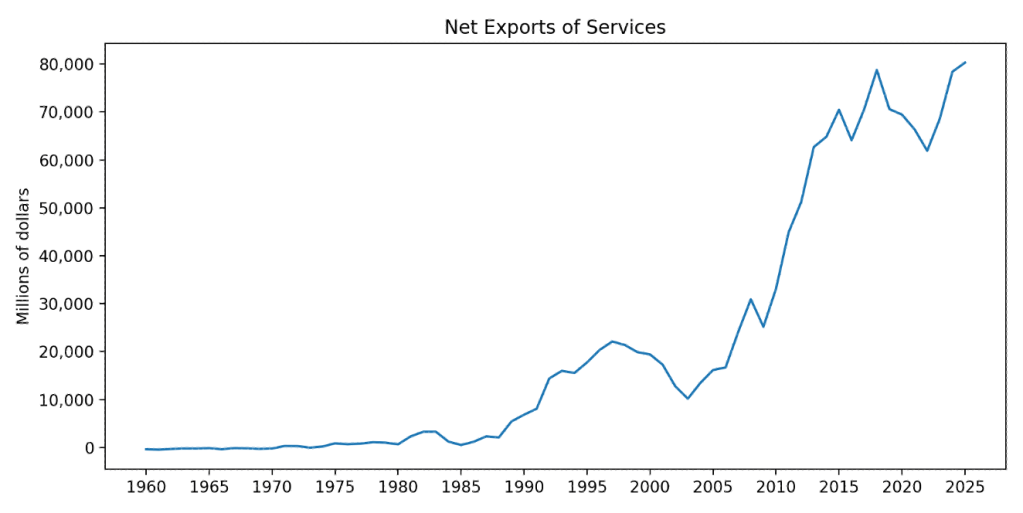
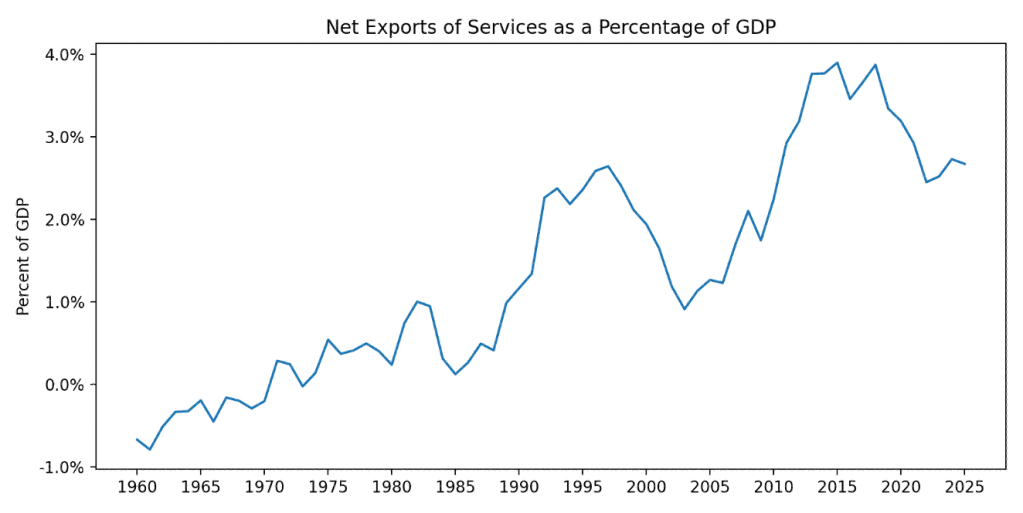
A recent post on the blog of the Federal Reserve Bank of St. Louis reminds us that although the media and some policymakers tend to focus on the fact that the United States typically runs a deficit in trade in goods, it also typically runs a surplus in trade in services. We discuss these points in Economics, Chapter 9, Section 9.1 and Chapter 28, Section 28.1 (Macroeconomics, Chapter 7, Section 7.1 and Chapter 18, Section 18.1, and Microeconomics, Section 9.1). The first of the following figures shows U.S. net exports in services in dollar terms for the period from the first quarter of 1960 through the second quarter of 2025. The second figure show U.S. net exports in services as a percentage of U.S. GDP.

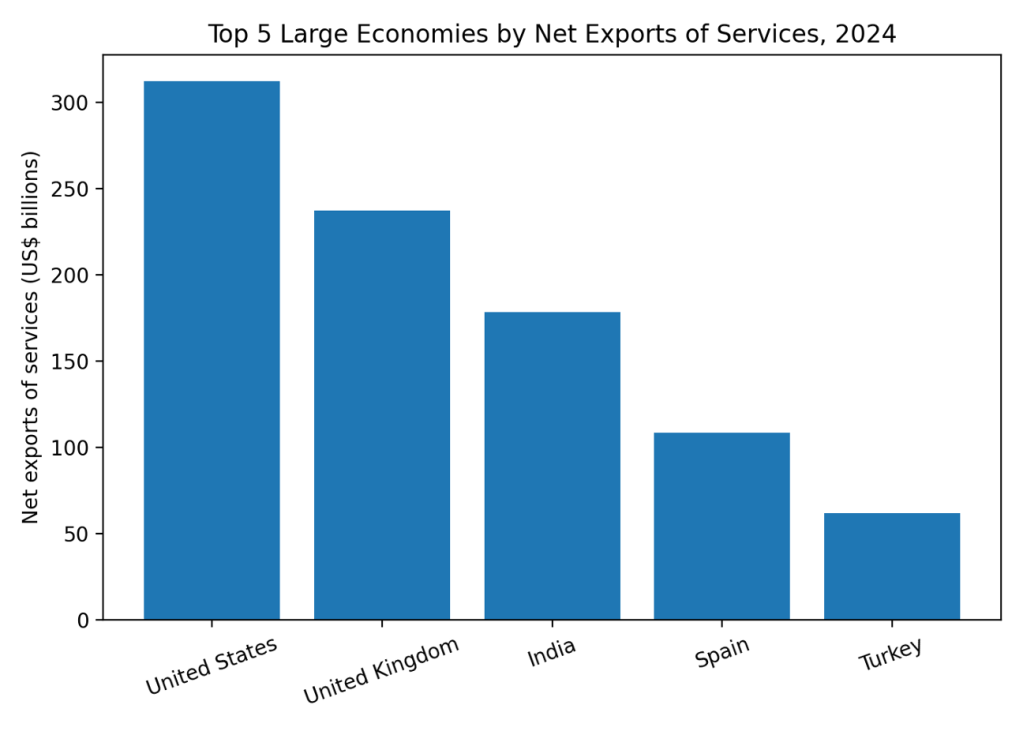
How does the United States compare to other countries? The following figure shows for 2024 the leaders in net exports of services for large economies (those with GDP of $1 trillion or more). The United States has largest value for net exports of services followed by the United Kingdom. China had negative net exports of services in 2024.

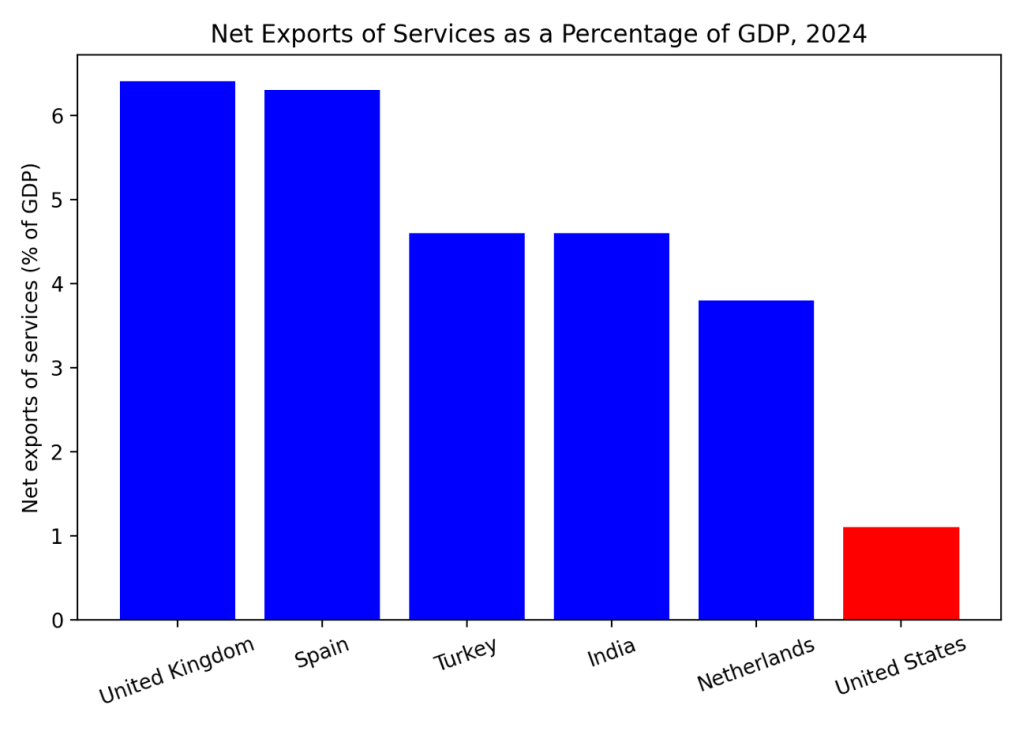
The following figure shows net exports in services as percentage of GDP among large economies. Measured this way, the largest net exporter of services is the United Kingdom, followed by Spain. The United States is included in graph (in red) for comparison and ranks ninth.

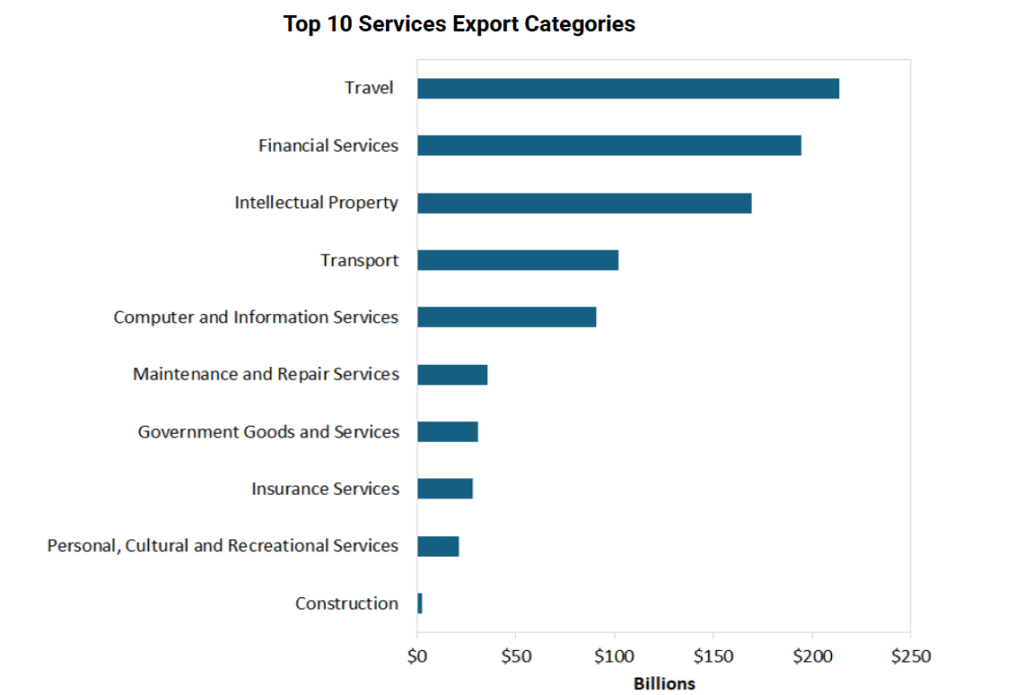
The following table from the St. Louis Fed’s blog posts shows the U.S. industries that export the most services.

The export of travel services represents largely foreign tourism in the United States. For example, if a family from France visits Walt Disney World in Florida, their spending would be included as an export of travel services.

October and November Jobs Data Give Mixed Picture of the Labor Market

Image created by ChatGPT

Because of the federal government shutdown from October 1 to November 12, the regular release by the Bureau of Labor Statistics (BLS) of its monthly “Employment Situation” report (often called the “jobs report”) has been disrupted. The jobs report usually has two estimates of the change in employment during the month: one estimate from the establishment survey, often referred to as the payroll survey, and one from the household survey. As we discuss in Macroeconomics, Chapter 9, Section 9.1 (Economics, Chapter 19, Section 19.1), many economists and Federal Reserve policymakers believe that employment data from the establishment survey provide a more accurate indicator of the state of the labor market than do the household survey’s employment data and unemployment data. (The groups included in the employment estimates from the two surveys are somewhat different, as we discuss in this post.)

Today, the BLS released a jobs report that has data from the payroll survey for both October and November, but data from the household survey only for November. Because of the government shutdown, the household survey for October wasn’t conducted.

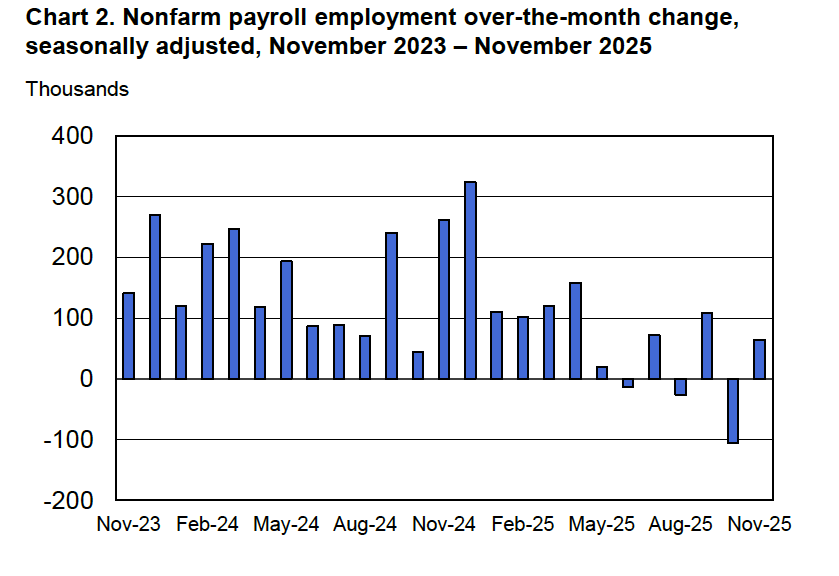
According to the establishment survey, there was a net decrease of 105,000 nonfarm jobs in October and a net increase of 64,000 nonfarm jobs in November. The increase for November was above the increase of 40,000 that economists surveyed by FactSet had forecast.  Economists surveyed by the Wall Street Journal had forecast a net increase of 45,000 jobs. The BLS revised downward by a combined 33,000 jobs its previous estimates of employment in August and September. (The BLS notes that: “Monthly revisions result from additional reports received from businesses and government agencies since the last published estimates and from the recalculation of seasonal factors.”)

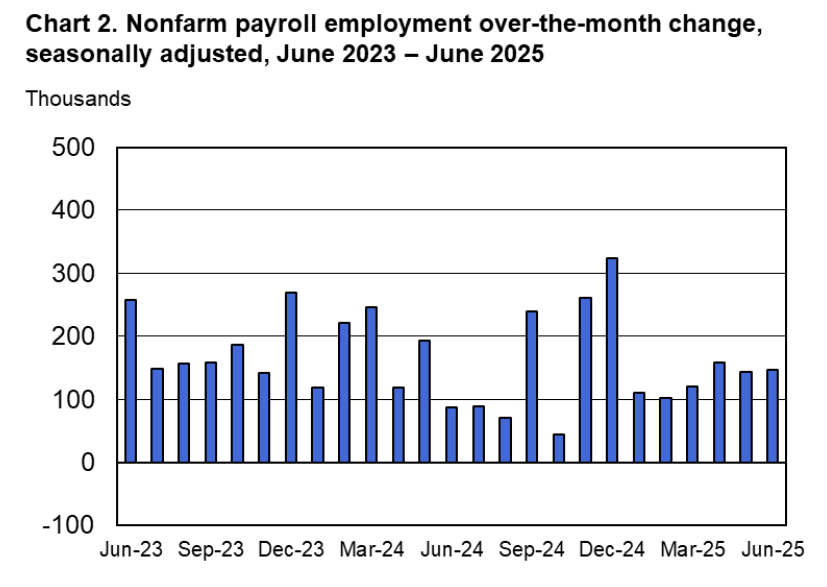
The following figure from the jobs report shows the net change in nonfarm payroll employment for each month in the last two years. The figure illustrates that, as the BLS notes in the report, nonfarm payroll employment “has shown little net change since April.” The Trump administration announced sharp increases in U.S. tariffs on April 2. Media reports indicate that some firms have slowed hiring due to the effects of the tariffs or in anticipation of those effects. In addition, a sharp decline in immigration has slowed growth in the labor force.
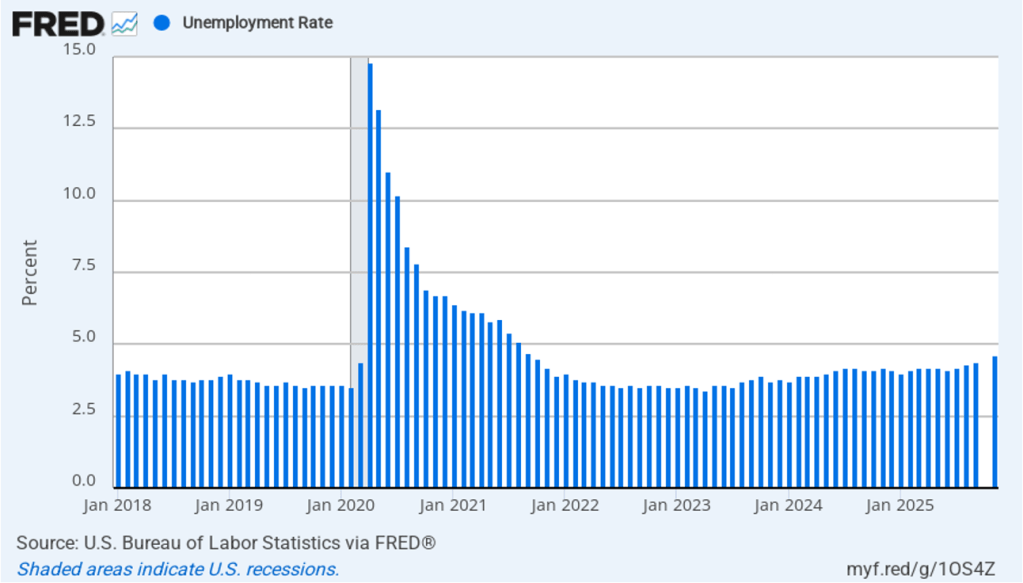
The unemployment rate estimate relies on data collected in the household survey, so there id no unemployment estimate for October. As shown in the following figure, the unemployment rate increased from 4.4 percent in September to 4.6 percent in November, the highest rate since September 2021. The unemployment rate is above the 4.4 percent rate economists surveyed by FactSet had forecast. The unemployment rate had been remarkably stable, staying between 4.0 percent and 4.2 percent in each month from May 2024 to July 2025, before breaking out of that range in August. The Federal Open Market Committee’s current estimate of the natural rate of unemployment—the normal rate of unemployment over the long run—is 4.2 percent. So, unemployment is now well above the natural rate. (We discuss the natural rate of unemployment in Macroeconomics, Chapter 9 and Economics, Chapter 19.)

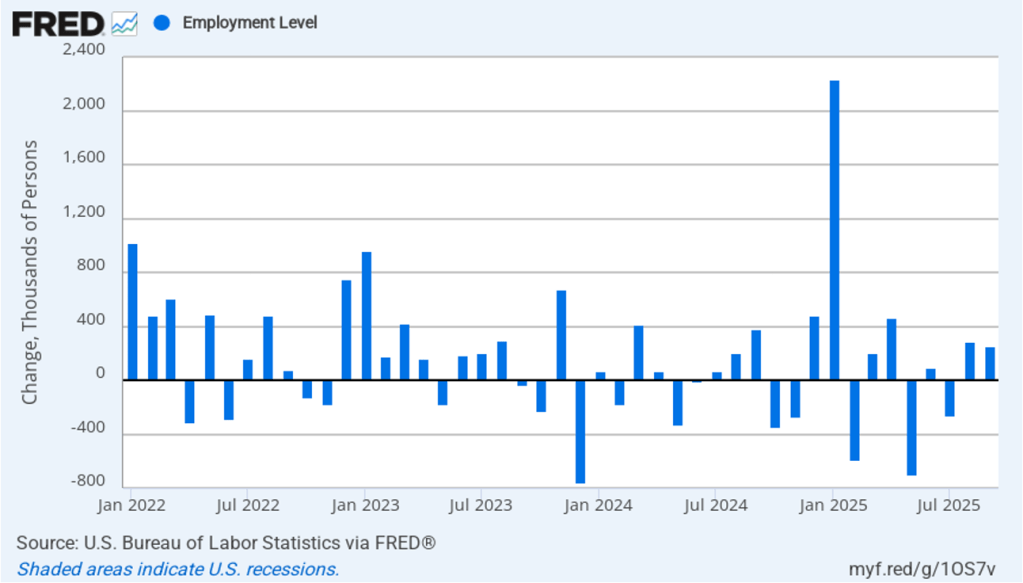
As the following figure shows, the monthly net change in jobs from the household survey moves much more erratically than does the net change in jobs from the establishment survey. As measured by the household survey, there was a net increase of 96,000 jobs from September to November. In the payroll survey, there was a net decrease in of 41,000 jobs from September to November. In any particular month, the story told by the two surveys can be inconsistent. In this case, we are measuring the change in jobs over a two month interval because there is no estimate from the household survey of employment in October. Over that two month period the household survey is showing more strength in the labor market than is the payroll survey. (In this blog post, we discuss the differences between the employment estimates in the two surveys.)

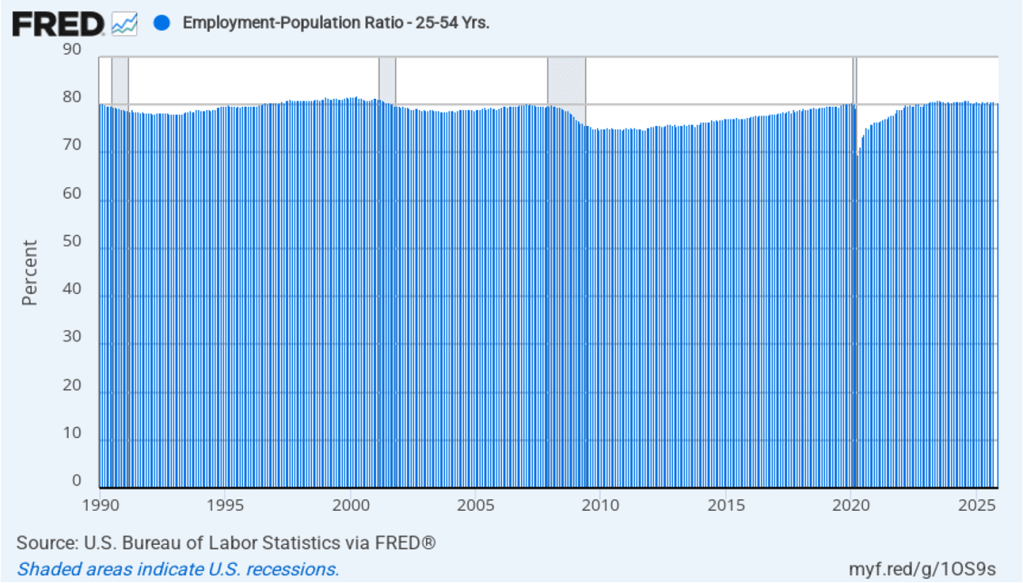
The household survey has another important labor market indicator: the employment-population ratio for prime age workers—those workers aged 25 to 54. In November the ratio was 80.6 percent, down slightly from 80.7 in September. (Again, there is no estimate for October.) The prime-age employment-population ratio is somewhat below the high of 80.9 percent in mid-2024, but is still above what the ratio was in any month during the period from January 2008 to February 2020. The continued high levels of the prime-age employment-population ratio indicates some continuing strength in the labor market.

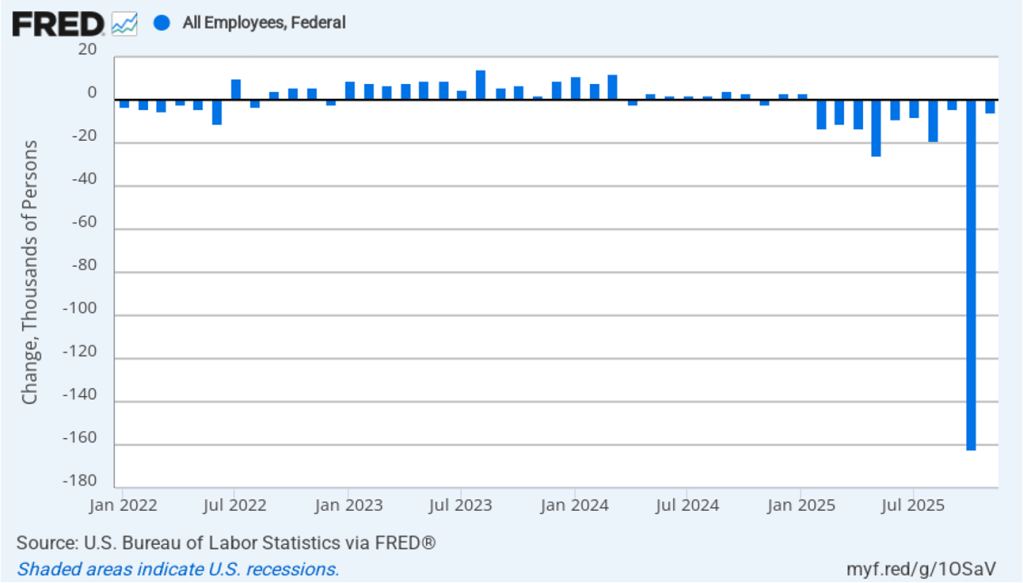
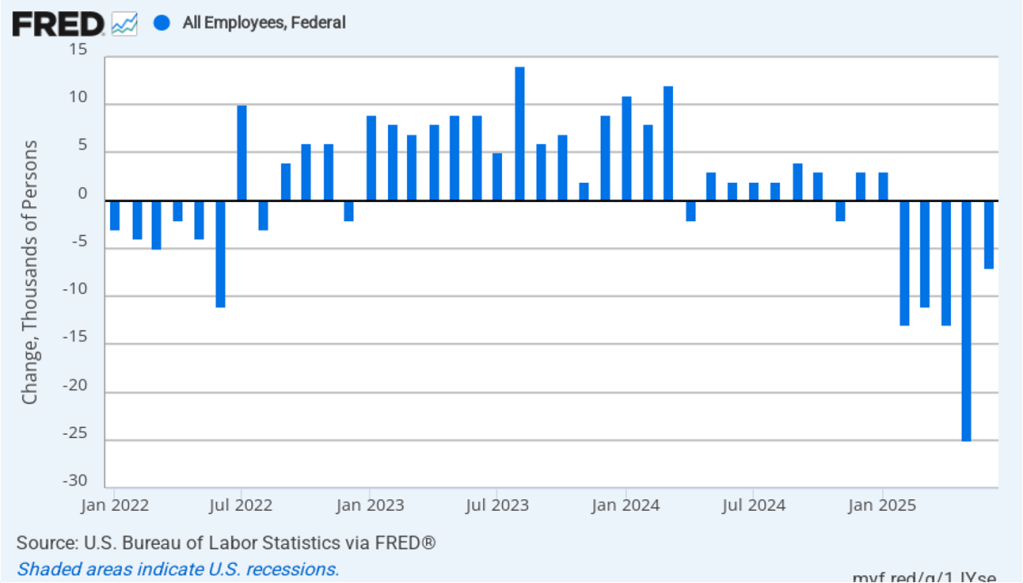
The Trump Administration’s layoffs of some federal government workers are clearly shown in the estimate of total federal employment for October, when many federal government employees exhausted their severance pay. (The BLS notes that: “Employees on paid leave or receiving ongoing severance pay are counted as employed in the establishment survey.”) As the following figure shows, there was a decline federal government employment of 162,000 in October, with an additional decline of 6,000 In November. The total decline since the beginning of February 2025 is 271,000. At this point, we can say that the decline in federal employment has had a significant effect on the overall labor market and may account for some of the rise in the unemployment rate.

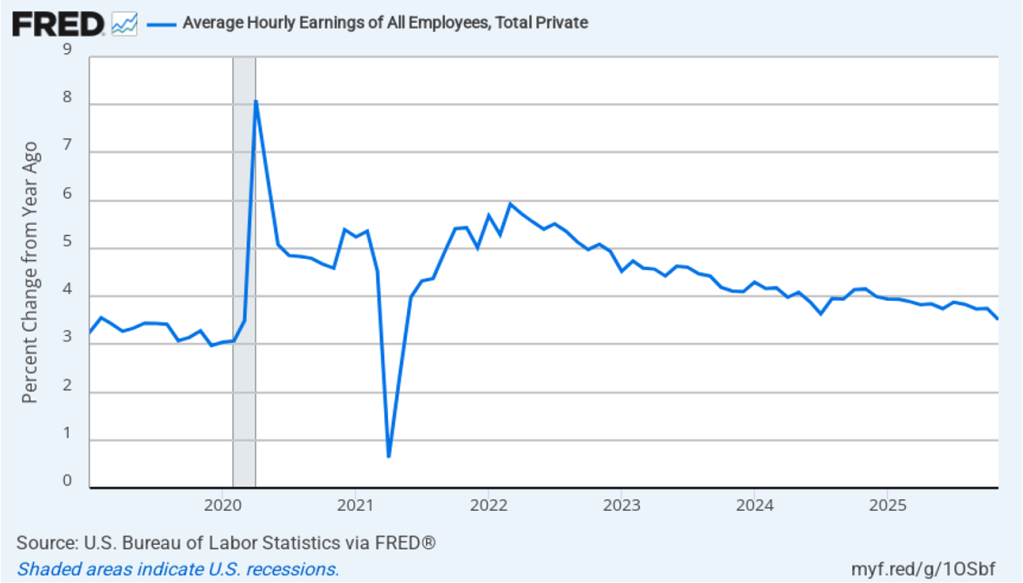
The establishment survey also includes data on average hourly earnings (AHE). As we noted in this post, many economists and policymakers believe the employment cost index (ECI) is a better measure of wage pressures in the economy than is the AHE. The AHE does have the important advantage of being available monthly, whereas the ECI is only available quarterly. The following figure shows the percentage change in the AHE from the same month in the previous year. The AHE increased 3.5 percent in November, down from 3.7 percent in October.

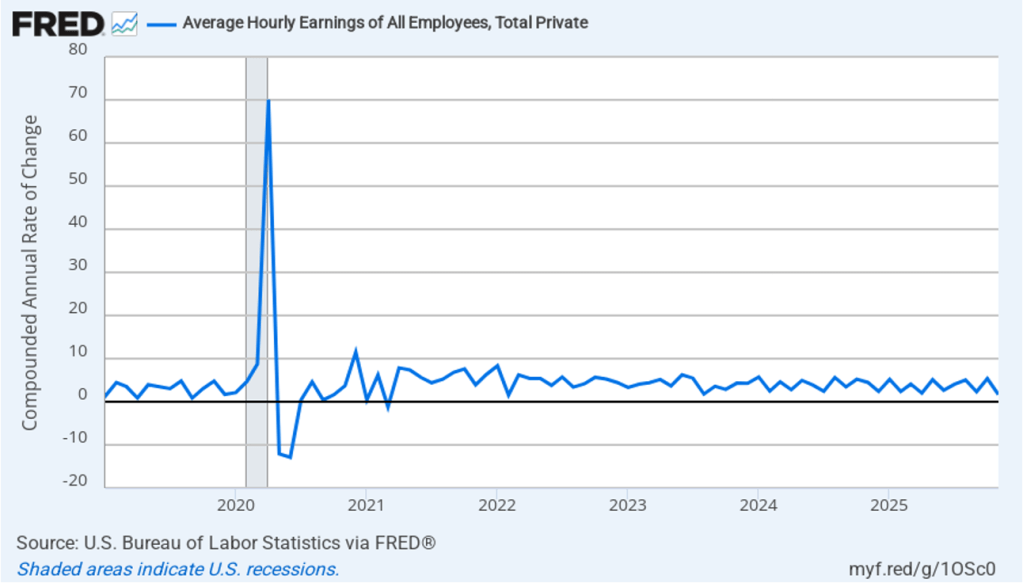
The following figure shows wage inflation calculated by compounding the current month’s rate over an entire year. (The figure above shows what is sometimes called 12-month wage inflation, whereas this figure shows 1-month wage inflation.) One-month wage inflation is much more volatile than 12-month wage inflation—note the very large swings in 1-month wage inflation in April and May 2020 during the business closures caused by the Covid pandemic. In November, the 1-month rate of wage inflation was 1.6 percent, down from 5.4 percent in October. This slowdown in wage growth may be an indication of a weakening labor market. But one month’s data from such a volatile series may not accurately reflect longer-run trends in wage inflation.

What effect might today’s jobs report have on the decisions of the Federal Open Market Committee (FOMC) with respect to setting its target range for the federal funds rate?  Today’s jobs report provides a mixed take on the state of the labor market with very slow job growth—although the large decline in federal employment is a confounding factor—a continued high employment-population ratio for prime age workers, and slowing wage growth.

One indication of expectations of future changes in the FOMC’s target for the federal funds rate comes from investors who buy and sell federal funds futures contracts. (We discuss the futures market for federal funds in this blog post.) This morning, investors assigned a 75.6 percent probability to the committee leaving its target range unchanged at 3.50 percent to 3.75 percent at its next meeting on January 27–28. That probability is unchanged from the probability yesterday before the release of the jobs report. Investors apparently don’t see today’s report as providing much new information on the current state of the economy.
Glenn’s Questions for the Fed

Photo from federalreserve.gov

This opinion column originally ran at Project Syndicate.

While recent media coverage of the US Federal Reserve has tended to focus on when, and by how much, interest rates will be cut, larger issues loom. The selection of a new Fed chair to succeed Jerome Powell, whose term ends next May, should focus not on short-term market considerations, but on policies and processes that could improve the Fed’s overall performance and accountability.

By demanding that the Fed cut the federal funds rate sharply to boost economic activity and lower the government’s borrowing costs, US President Donald Trump risks pushing the central bank toward an overly inflationary monetary policy. And that, in turn, risks increasing the term premium in the ten-year Treasury yield—the very financial indicator that Treasury Secretary Scott Bessent has emphasized. A higher premium would raise, not lower, borrowing costs for the federal government, households, and businesses alike. Moreover, concerns about the Fed’s independence in setting monetary policy could undermine confidence in US financial markets and further weaken the dollar’s exchange rate. 

But this does not imply that Trump should simply seek continuity at the Fed. The Fed, under Powell, has indeed made mistakes, leading to higher inflation, sometimes inept and uncoordinated communications, and an unclear strategy for monetary policy.

I do not share the opinion of Trump and his advisers that the Fed has acted from political or partisan motives. Even when I have disagreed with Fed officials or Powell on matters of policy, I have not doubted their integrity. However, given their mistakes, I do believe that some institutional introspection is warranted. The next chair—along with the Board of Governors and the Federal Open Market Committee—will have many policy questions to address beyond the near-term path for the federal funds rate. 

Three issues are particularly important. The first is the Fed’s dual mandate: to ensure stable prices and maximum employment. Many economists (including me) have been critical of the Fed for exhibiting an inflationary bias in 2021 and 2022. The highest inflation rate in 40 years raised pressing questions about whether the Fed has assigned the right weights to inflation and employment. 

Clearly, the strategy of pursuing a flexible average inflation target (implying that inflation can be permitted to rise above 2% if it had previously been below 2%) has not been successful. What new approach should the Fed adopt to hit its inflation target? And how can the Fed be held more accountable to Congress and the public? Should it issue a regular inflation report? 

The second issue concerns the size and composition of the Fed’s balance sheet. Since the global financial crisis of 2008, the Fed has had a much larger balance sheet and has evolved toward an “ample reserves model” (implying a perpetually high level of reserves). But how large must the balance sheet be to conduct monetary policy, and how important should long-term Treasury debt and mortgage-backed securities be, relative to the rest of the balance sheet? If such assets are to play a central role, how can the Fed best separate the conduct of monetary policy from that of fiscal policy? 

The third issue is financial regulation. What regulatory changes does the Fed believe are needed to avoid the kind of costly stresses in the Treasury market we have witnessed in recent years? How can bank supervision be improved? Given that regulation is an inherently political subject, how can the Fed best separate these activities from its monetary policymaking (where independence is critical)? 

Addressing these policy questions requires a rethink of process, too. The Fed would be more effective in dealing with a changing economic environment if it acknowledged and debated more diverse viewpoints about the roles of monetary policy and financial regulation in how the economy works.

The Fed’s inflation mistakes, overconfidence in financial regulation, and other errors partly reflect the “groupthink” to which all organizations are prone. Regional Fed presidents’ views traditionally have reflected their own backgrounds and local conditions, but that doesn’t translate easily into a diversity of economic views. Instead of choosing Fed officials based on how they are likely to vote at the next rate-setting meeting, Trump should put more weight on intellectual and experiential diversity. Equally, the Fed itself could more actively seek and listen to dissenting views from academic and business leaders. 

Raising questions about policy and process offers guidance about the characteristics that the next Fed chair will need to succeed. These obviously include knowledge of monetary policy and financial regulation and mature, independent judgment; but they also include diverse leadership experience and an openness to new ideas and perspectives that might enhance the institution’s performance and accountability. One hopes that Trump’s selection of the next Fed chair, and the Senate’s confirmation process, will emphasize these attributes.

Surprisingly Strong Jobs Report

Image generated by ChatGTP-4o

This morning (July 3), the Bureau of Labor Statistics (BLS) released its “Employment Situation” report (often called the “jobs report”) for June. The data in the report show that the labor market was stronger than expected in June. There have been many stories in the media about businesspeople becoming pessimistic as a result of the large tariff increases the Trump Administration announced on April 2—some of which have since been reduced—and some large firms—including Microsoft and Walt Disney—have announced layoffs. In addition, yesterday payroll processing firm ADP estimated that private sector employment had declined by 33,000 in June. But despite these signs of weakness in the labor market, as the headline in the Wall Street Journal put it “Hiring Defied Expectations in June.”

The jobs report has two estimates of the change in employment during the month: one estimate from the establishment survey, often referred to as the payroll survey, and one from the household survey. As we discuss in Macroeconomics, Chapter 9, Section 9.1 (Economics, Chapter 19, Section 19.1), many economists and Federal Reserve policymakers believe that employment data from the establishment survey provide a more accurate indicator of the state of the labor market than do the household survey’s employment data and unemployment data. (The groups included in the employment estimates from the two surveys are somewhat different, as we discuss in this post.)

According to the establishment survey, there was a net increase of 147,000 nonfarm jobs during June. This increase was above the increase of 1115,000 that economists surveyed had forecast. In addition, the BLS revised upward its previous estimates of employment in April and May by a combined 16,000 jobs. (The BLS notes that: “Monthly revisions result from additional reports received from businesses and government agencies since the last published estimates and from the recalculation of seasonal factors.”) The following figure from the jobs report shows the net change in nonfarm payroll employment for each month in the last two years.

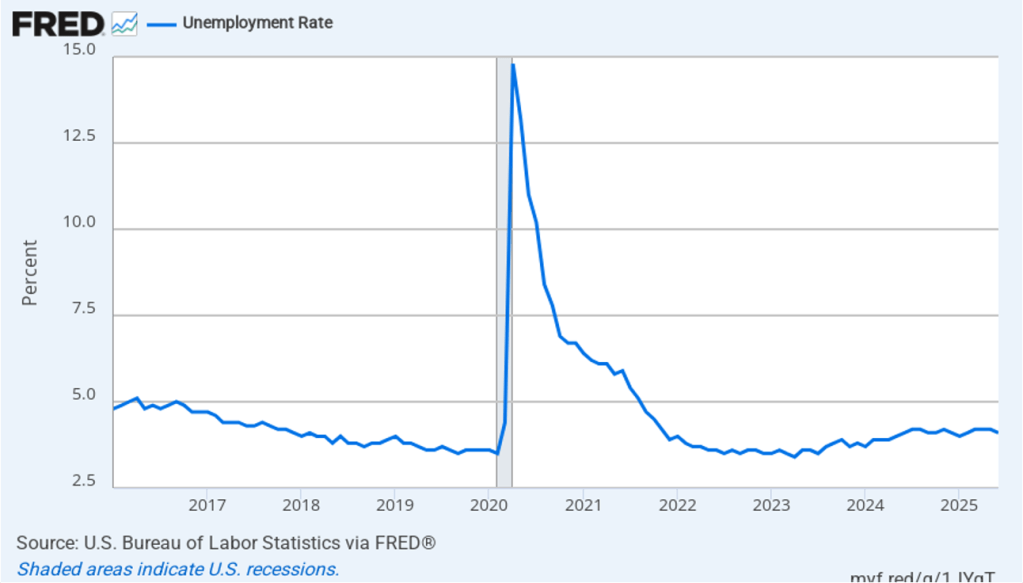
The unemployment rate declined from 4.2 in May to 4.1 percent in June. Economists surveyed had forecast an increase in the unemployment rate to 4.3 percent. As the following figure shows, the unemployment rate has been remarkably stable over the past year, staying between 4.0 percent and 4.2 percent in each month since May 2024. In June, the members of the Federal Open Market Committee (FOMC) forecast that the unemployment rate for 2025 would average 4.5 percent. The unemployment rate would have to rise significantly in the second half of the year for that forecast to be accurate.

Each month, the Federal Reserve Bank of Atlanta estimates how many net new jobs are required to keep the unemployment rate stable. Given a slowing in the growth of the working-age population due the aging of the U.S. population and a sharp decline in immigration, the Atlanta Fed currently estimates that the economy would have to create 113,500 net new jobs each month to keep the unemployment rate stable at 4.1 percent.

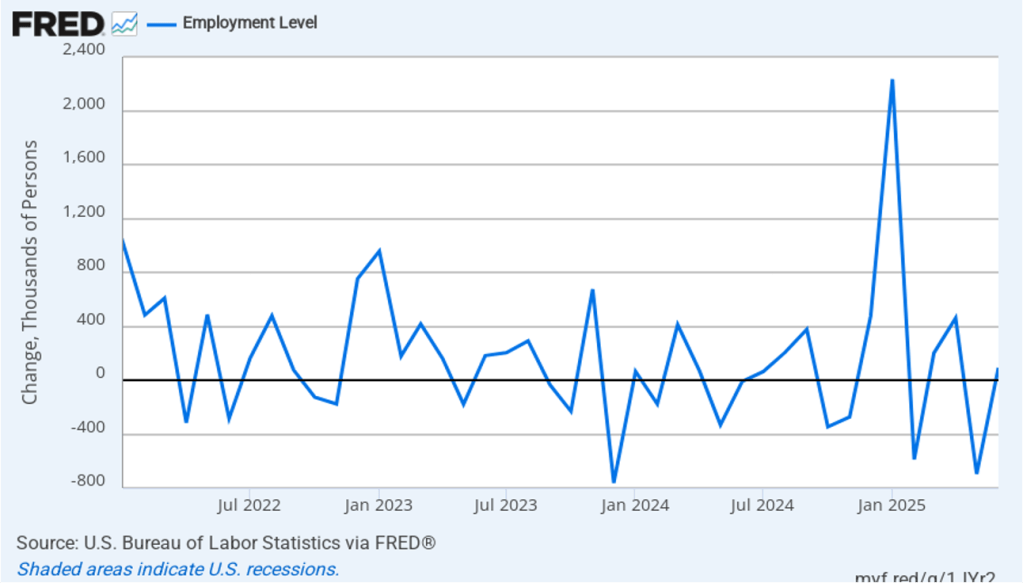
As the following figure shows, the monthly net change in jobs from the household survey moves much more erratically than does the net change in jobs from the establishment survey. As measured by the household survey, there was a net increase of 93,000 jobs in June, following a decrease of 696,000 jobs in May. As an indication of the volatility in the employment changes in the household survey note the very large swings in net new jobs in January and February. In any particular month, the story told by the two surveys can be inconsistent with employment increasing in one survey while falling in the other. This month, the two surveys were consistent in both showing a net increase in employment. (In this blog post, we discuss the differences between the employment estimates in the two surveys.)

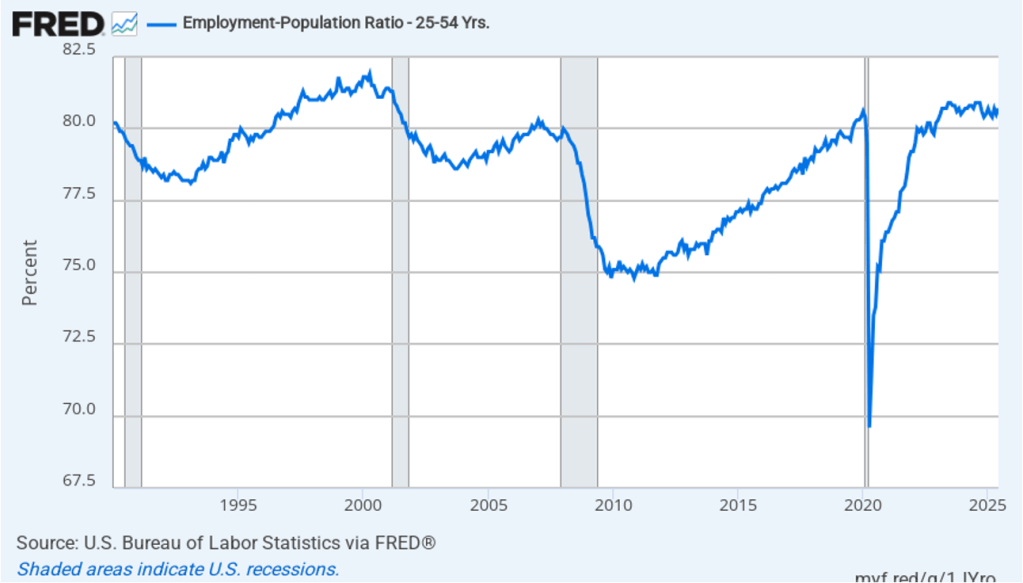
The household survey has another important labor market indicator. The employment-population ratio for prime age workers—those aged 25 to 54—rose from 80.5 percent in May to 80.7 percent in June. The prime-age employment-population ratio is somewhat below the high of 80.9 percent in mid-2024, but is above what the ratio was in any month during the period from January 2008 to January 2020.

It is still unclear how many federal workers have been laid off since the Trump Administration took office. The establishment survey shows a decline in total federal government employment of 7,000 in June and a total decline of 69,000 since the beginning of February. However, the BLS notes that: “Employees on paid leave or receiving ongoing severance pay are counted as employed in the establishment survey.” It’s possible that as more federal employees end their period of receiving severance pay, future jobs reports may report a larger decline in federal employment. To this point, the decline in federal employment has been too small to have a significant effect on the overall labor market.

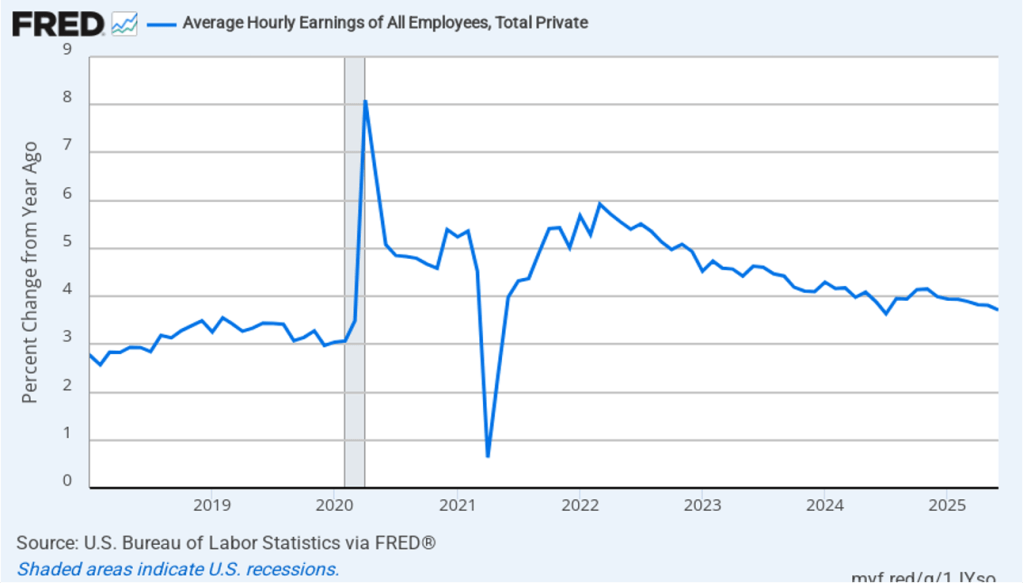
The establishment survey also includes data on average hourly earnings (AHE). As we noted in this post, many economists and policymakers believe the employment cost index (ECI) is a better measure of wage pressures in the economy than is the AHE. The AHE does have the important advantage of being available monthly, whereas the ECI is only available quarterly. The following figure shows the percentage change in the AHE from the same month in the previous year. The AHE increased 3.7 percent in June, down from an increase of 3.8 percent in May.

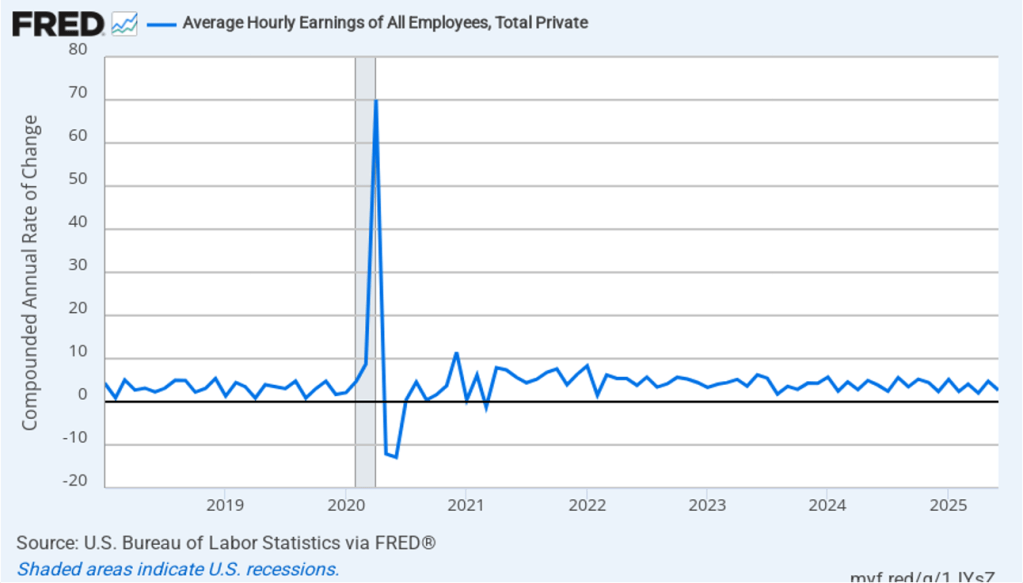
The following figure shows wage inflation calculated by compounding the current month’s rate over an entire year. (The figure above shows what is sometimes called 12-month wage inflation, whereas this figure shows 1-month wage inflation.) One-month wage inflation is much more volatile than 12-month wage inflation—note the very large swings in 1-month wage inflation in April and May 2020 during the business closures caused by the Covid pandemic. In June, the 1-month rate of wage inflation was 2.7 percent, down significantly from 4.8 percent in May. If the 1-month increase in AHE is sustained, it would indicate that the Fed may have an easier time achieving its 2 percent target rate of price inflation. But one month’s data from such a volatile series may not accurately reflect longer-run trends in wage inflation.

Before today’s jobs reports the signs that the labor market was weakening, which we discussed earlier, had led some economists and policymakers to speculate that a weak jobs report would lead the FOMC to cut its target range for the federal funds rate at its next meeting on July 29–30. That now seems very unlikely.

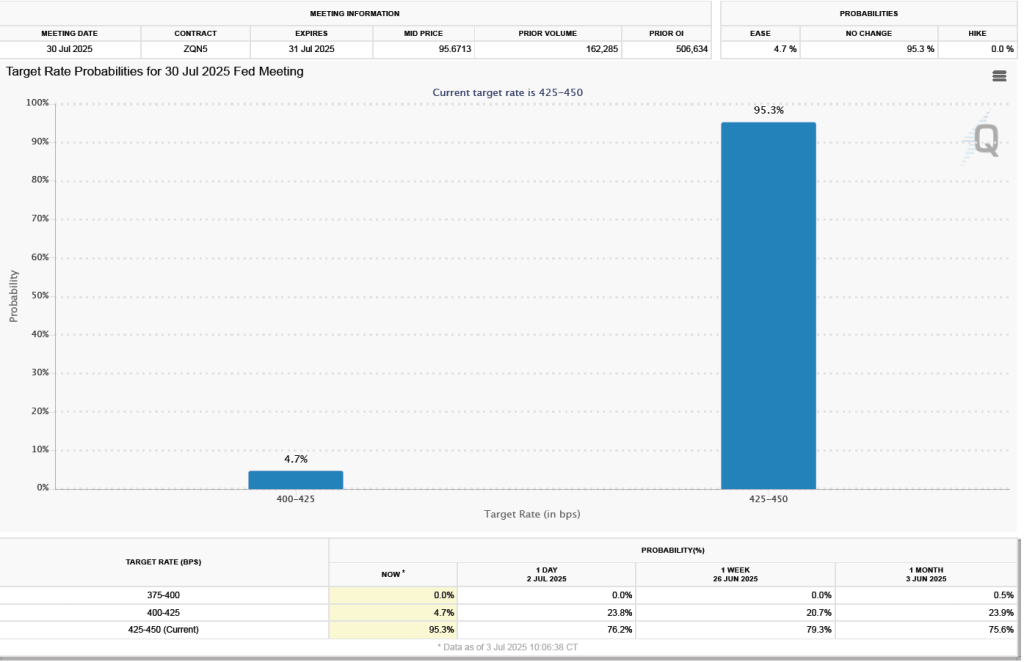
One indication of expectations of future changes in the FOMC’s target for the federal funds rate comes from investors who buy and sell federal funds futures contracts. (We discuss the futures market for federal funds in this blog post.) As shown in the following figure, today investors assign a 95.3 percent probability to the committee keeping its target unchanged at 4.25 percent to 4.50 percent at the July meeting.