What Can We Conclude from a Weaker than Expected Employment Report?

(AP Photo/Lynne Sladky, File)

This morning (May 3), the Bureau of Labor Statistics (BLS) released its “Employment Situation” report for April. The report has two estimates of the change in employment during the month: one estimate from the establishment survey, often referred to as the payroll survey, and one from the household survey. As we discuss in Macroeconomics, Chapter 9, Section 9.1 (Economics, Chapter 19, Section 19.1), many economists and policymakers at the Federal Reserve believe that employment data from the establishment survey provides a more accurate indicator of the state of the labor market than do either the employment data or the unemployment data from the household survey. (The groups included in the employment estimates from the two surveys are somewhat different, as we discuss in this post.)

According to the establishment survey, there was a net increase of 175,000 jobs during April. This increase was well below the increase of 240,000 that economists had forecast in a survey by the Wall Street Journal and well below the net increase of 315,000 during March. The following figure, taken from the BLS report, shows the monthly net changes in employment for each month during the past to years.

As the following figure shows, the net change in jobs from the household survey moves much more erratically than does the net change in jobs in the establishment survey. The net increase in jobs as measured by the household survey fell from 498,000 in March to 25,000 in April.

The unemployment rate, which is also reported in the household survey, ticked up slightly from 3.8 percent to 3.9 percent. It has been below 4 percent every month since February 2022.

The establishment survey also includes data on average hourly earnings (AHE). As we note in this recent post, many economists and policymakers believe the employment cost index (ECI) is a better measure of wage pressures in the economy than is the AHE. The AHE does have the important advantage that it is available monthly, whereas the ECI is only available quarterly. The following figure show the percentage change in the AHE from the same month in the previous year. The 3.9 percent value for April continues a downward trend that began in February.

The following figure shows wage inflation calculated by compounding the current month’s rate over an entire year. (The figure above shows what is sometimes called 12-month wage inflation, whereas this figure shows 1-month wage inflation.) One-month wage inflation is much more volatile than 12-month inflation—note the very large swings in 1-month wage inflation in April and May 2020 during the business closures caused by the Covid pandemic.

The 1-month rate of wage inflation of 2.4 percent in April is a significant decrease from the 4.2 percent rate in March, although it’s unclear whether the decline was a sign that the labor market is weakening or reflected the greater volatility in wage inflation when calculated this way.

The macrodata released during the first three months of the year had, by and large, indicated strong economic growth, with the pace of employment increases being particularly rapid. Wages were also increasing at a pace above that during the pre-Covid period. Inflation appeared to be stuck in the range of 3 percent to 3.5 percent, above the Fed’s target inflation rate of 2 percent.

Today’s “Employment Situation” report may be a first indication that growth is slowing sufficiently to allow the inflation rate to fall back to 2 percent. This is the outcome that Fed Chair Jerome Powell indicated in his press conference on Wednesday that he expected to occur at some point during 2024. Financial markets reacted favorably to the release of the report with stock prices jumping and the interest rate on the 10-year Treasury note falling. Many economists and Wall Street analysts had concluded that the Fed’s policy-making Federal Open Market Committee (FOMC) was likely to keep its target for the federal funds rate unchanged until late in the year and might not institute a cut in the target at all this year. Today’s report caused some Wall Street analysts to conclude, as the headline of an article in the Wall Street Journal put it, “Jobs Data Boost Hopes of a Late-Summer Rate Cut.”

This reaction may be premature. Data on employment from the establishment survey can be subject to very large revisions, which reinforces the general caution against putting too great a weight one month’s data. Its most likely that the FOMC would need to see several months of data indicating a slowing in economic growth and in the inflation rate before reconsidering whether to cut the target for the federal funds rate earlier than had been expected.

NEW! 4/5/24 Podcast – Authors Glenn Hubbard & Tony O’Brien react to the newest Friday Jobs Report for March & discuss next steps for the Economy.

Join authors Glenn Hubbard & Tony O’Brien as they react to the jobs report of over 300K jobs created which was way over expectations of about 200K. They consider the impact of this report as the Fed considers the next steps for the economy. Are we on a glide path for a soft landing at 2% inflation or will the Fed reconsider its long-standing target by adopting a higher 3% target? Glenn and Tony offer interesting viewpoints on where this is headed.

Upward Revision of 2023 Fourth Quarter Real GDP Growth May Add to Fed’s Hesitancy to Raise Fed Funds Target

(Photo courtesy of Lena Buonanno)

The Bureau of Economic Analysis (BEA) has issued its third estimate of real GDP for the fourth quarter of 2023. The BEA now estimates that real GDP increased in the fourth quarter of 2023 at an annual rate of 3.4 percent, an increase from the BEA’s second estimate of 3.2 percent. The BEA noted that: “The update primarily reflected upward revisions to consumer spending and nonresidential fixed investment that were partly offset by a downward revision to private inventory investment.”

As the blue line in the following figure shows, despite the upward revision, fourth quarter growth in real GDP decline significantly from the very high growth rate of 4.9 percent in the third quarter. In addition, two widely followed “nowcast” estimates of real GDP growth in the first quarter of 2024 show a futher slowdown. The nowcast from the Federal Reserve Bank of Atlanta estimates that real GDP will have grown at an annualized rate of 2.1 percent in the first quarter and the nowcast from the Federal Reserve Bank of New York estimates a growth rate of 1.9 percent. (The Atlanta Fed describes its nowcast as “a running estimate of real GDP growth based on available economic data for the current measured quarter.” The New York Fed explains: “Our model reads the flow of information from a wide range of macroeconomic data as they become available, evaluating their implications for current economic conditions; the result is a ‘nowcast’ of GDP growth ….”)

Data on growth in real gross domestic income (GDI), on the other hand, show an upward trend, as indicated by the red line in the figure. As we discuss in Macroeconomics, Chapter 8, Section 8.4 (Economics, Chapter 18, Section 18.4), gross domestic product measures the economy’s output from the production side, while gross domestic income does so from the income side. The two measures are designed to be equal, but they can differ because each measure uses different data series and the errors in data on production can differ from the errors in data on income. Economists differ on whether data on growth in real GDP or data on growth in real GDI do a better job of forecasting future changes in the economy. Accordingly, economists and policymakers will differ on how much weight to put on the fact that while the growth in real GDI had been well below growth in real GDP from the fourth quarter of 2022 to the fourth quarter of 2023, during the fourth quarter of 2023, growth in real GDI was 1.5 percentage points higher than growth in real GDP.

On balance, it seems likely that these data will reinforce the views of those members of the Fed’s policy-making Federal Open Market Committee (FOMC) who were cautious about reducing the target for the federal funds rate until the macroeconomic data indicate more clearly that the economy is slowing sufficiently to ensure that inflation is returning to the Fed’s 2 percent target. In a speech on March 27 (before the latest GDP revisions became available), Fed Governor Christopher Waller reviewed the most recent macro data and concluded that:

“Adding this new data to what we saw earlier in the year reinforces my view that there is no rush to cut the [federal funds] rate. Indeed, it tells me that it is prudent to hold this rate at its current restrictive stance perhaps for longer than previously thought to help keep inflation on a sustainable trajectory toward 2 percent.”

Most other members of the FOMC appear to share Waller’s view.

Surprisingly Strong CPI Report

Photo courtesy of Lena Buonanno.

As we’ve discussed in several blog posts (for instance, here and here), recent macro data have been consistent with the Federal Reserve being close to achieving a soft landing. The Fed’s increases in its target for the federal funds rate have slowed the growth of aggregate demand sufficiently to bring inflation closer to the Fed’s 2 percent target, but haven’t, to this point, slowed the growth of aggregate demand so much that the U.S. economy has been pushed into a recession.

By January 2024, many investors in financial markets and some economists were expecting that at its meeting on March 19-20, the Fed’s Federal Open Market Committee would be cutting its target for the federal funds. However, members of the committee—notably, Chair Jerome Powell—have been cautious about assuming prematurely that inflation had, in fact, been brought under control. In fact, in his press conference on January 31, following the committee’s most recent meeting, Powell made clear that the committee was unlikely to reduce its target for the federal funds rate at its March meeting. Powell noted that “inflation is still too high, ongoing progress in bringing it down is not assured, and the path forward is uncertain.”

Powell’s caution seemed justified when, on February 2, the Bureau of Labor Statistics (BLS) released its most recent “Employment Situation Report” (discussed in this post). The report’s data on growth in employment and growth in wages, as measured by the change in average hourly earnings, might be indicating that aggregate demand is growing too rapidly for inflation to continue to decline.

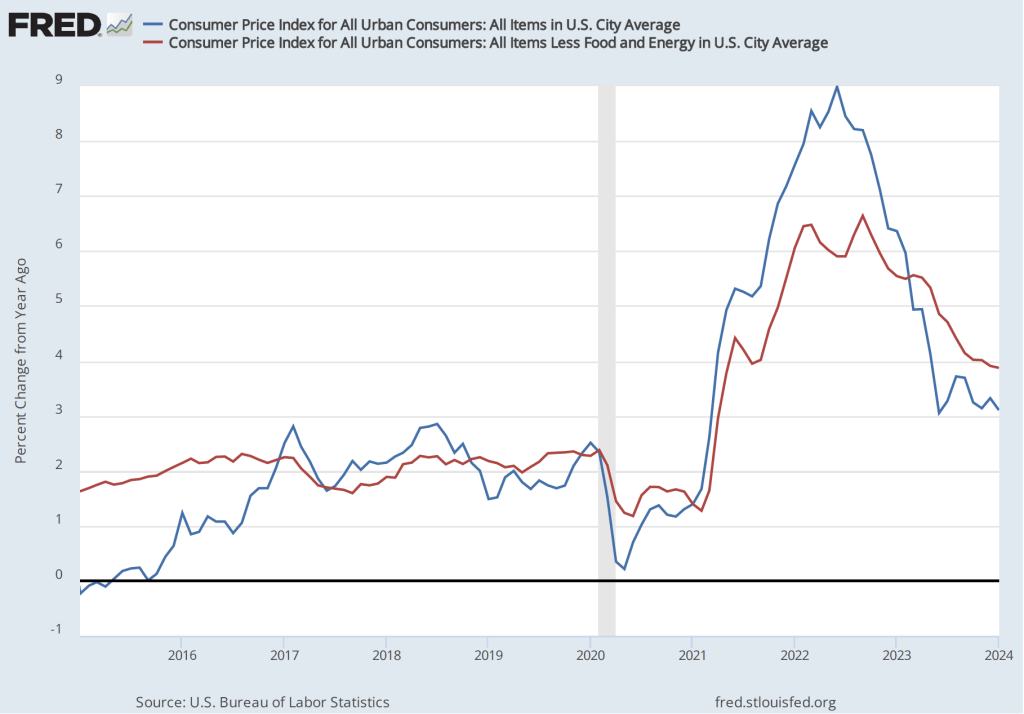
The BLS’s release today (February 13) of its report on the consumer price index (CPI) (found here) for January provided additional evidence that the Fed may not yet have put inflation on a firm path back to its 2 percent target. The average forecast of economists surveyed before the release of the report was that the increase in the version of the CPI that includes the prices of all goods and services in the market basket—often called headline inflation—would be 2.9 percent. (We discuss how the BLS constructs the CPI in Macroeconomics, Chapter 9, Section 19.4, Economics, Chapter 19, Section 19.4, and Essentials of Economics, Chapter 3, Section 13.4.) As the following figure shows, headline inflation for January was higher than expected at 3.1 percent (measured by the percentage change from the same month in the previous year), while core inflation—which excludes the prices of food and energy—was 3.9 percent. Headline inflation was lower than in December 2023, while core inflation was almost unchanged.

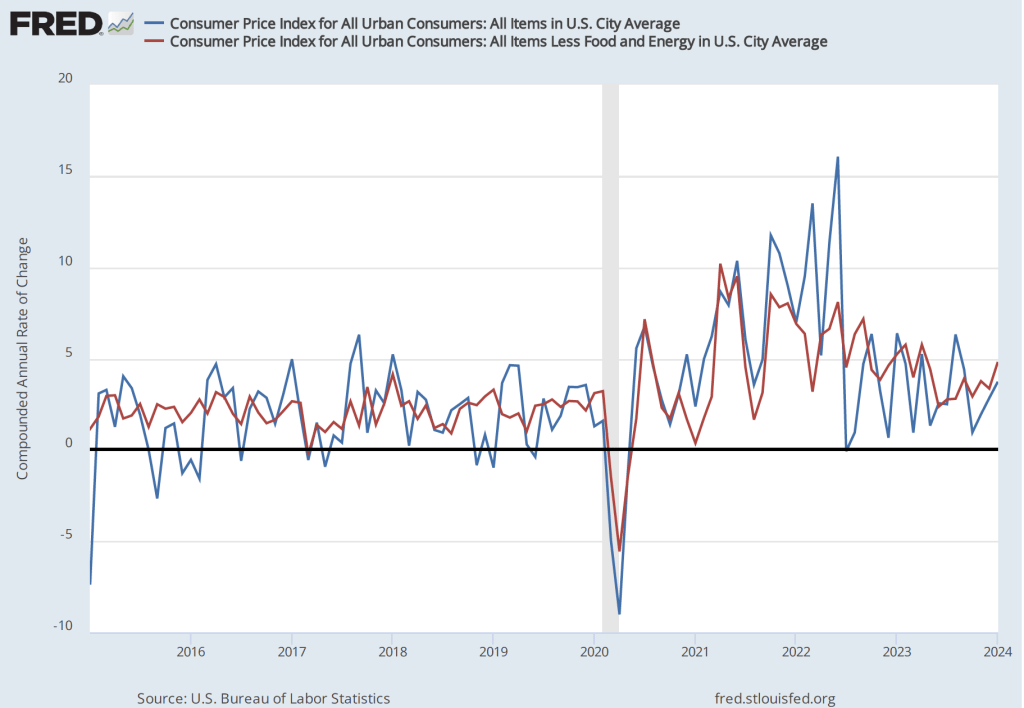
Although the values for January might seem consistent with a gradual decline in inflation, that conclusion may be misleading. Headline inflation in January 2023 had been surprisingly high at 6.4 percent. Hence, the comparision between the value of the CPI in January 2024 with the value in January 2023 may be making the annual CPI inflation rate seem artificially low. If we look at the 1-month inflation rate for headline and core inflation—that is the annual inflation rate calculated by compounding the current month’s rate over an entire year—the values are more concerning, as indicated in the following figure. Headline CPI inflation is 3.7 percent and core CPI inflation is 4.8 percent.

Even more concerning is the path of inflation in the prices of services. Chair Powell has emphasized that as supply chain problems have gradually been resolved, inflation in the prices of goods has been rapidly declining. But inflaion in services hasn’t declined nearly as much. Last summer he stated the point this way:

“Part of the reason for the modest decline of nonhousing services inflation so far is that many of these services were less affected by global supply chain bottlenecks and are generally thought to be less interest sensitive than other sectors such as housing or durable goods. Production of these services is also relatively labor intensive, and the labor market remains tight. Given the size of this sector, some further progress here will be essential to restoring price stability.”

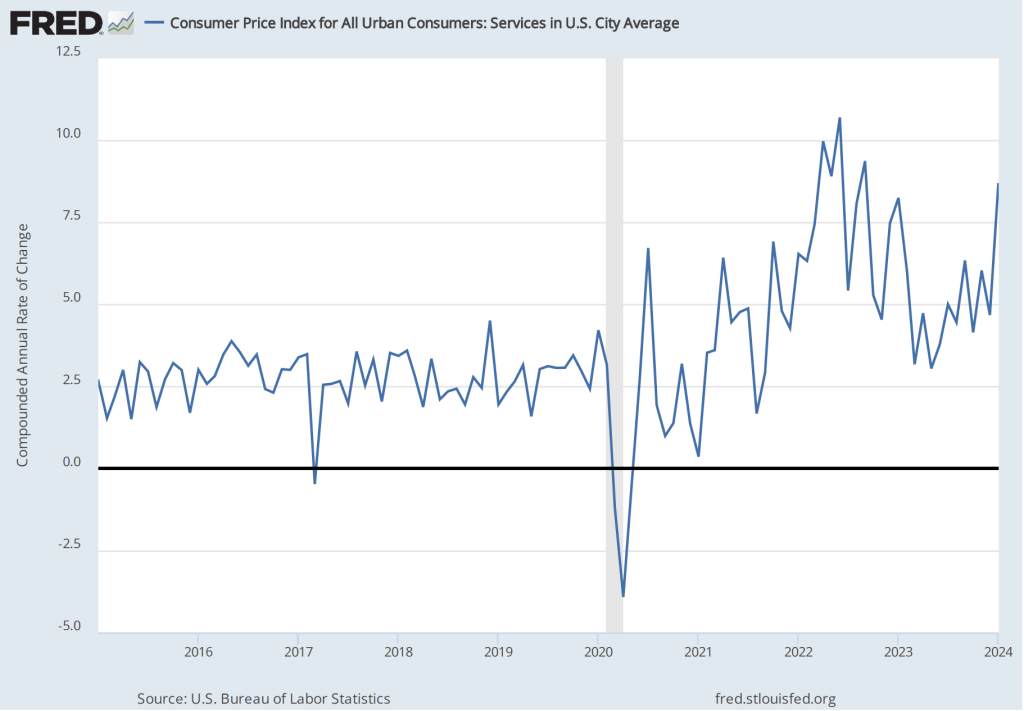
The following figure shows the 1-month inflation rate in services prices. The figure shows that inflation in services has been above 4 percent in every month since July 2023. Inflation in services was a very high 8.7 percent in January. Clearly such large increases in the prices of services aren’t consistent with the Fed meeting its 2 percent inflation target.

How should we interpret the latest CPI report? First, it’s worth bearing in mind that a single month’s report shouldn’t be relied on too heavily. There can be a lot of volatility in the data month-to-month. For instance, inflation in the prices of services jumped from 4.7 percent in December to 8.7 percent in January. It seems unlikely that inflation in the prices of services will continue to be over 8 percent.

Second, housing prices are a large component of service prices and housing prices can be difficult to measure accurately. Notably, the BLS includes in its measure the implicit rental price that someone who owns his or her own home pays. The BLS calculates that implict rental price by asking consumers who own their own homes the following question: “If someone were to rent your home today, how much do you think it would rent for monthly, unfurnished and without utilities?” (The BLS discusses how it measures the price of housing services here.) In practice, it may be difficult for consumers to accurately answer the question if very few houses similar to theirs are currently for rent in their neighborhood.

Third, the Fed uses the personal consumption expenditures (PCE) price index, not the CPI, to gauge whether it is achieving its 2 percent inflation target. The Bureau of Economic Analysis (BEA) includes the prices of more goods and services in the PCE than the BLS includes in the CPI and measures housing services using a different approach than that used by the BLS. Although inflation as measured by changes in the CPI and as measured by changes in the PCE move roughly together over long periods, the two measures can differ significantly over a period of a few months. The difference between the two inflation measures is another reason not to rely too heavily on a single month’s CPI data.

Despite these points, investors on Wall Street clearly interpreted the CPI report as bad news. Investors have been expecting that the Fed will soon cut its target for the federal funds rate, which should lead to declines in other key interest rates. If inflation continues to run well above the Fed’s 2 percent target, it seems likely that the Fed will keep its federal funds target at its current level for longer, thereby slowing the growth of aggregate demand and raising the risk of a recession later this year. Accordingly, the Dow Jones Industrial Average declined by more than 500 points today (February 13) and the interest rate on the 10-year Treasury note rose above 4.3 percent.

The FOMC has more than a month before its next meeting to consider the implications of the latest CPI report and the additional macro data that will be released in the meantime.

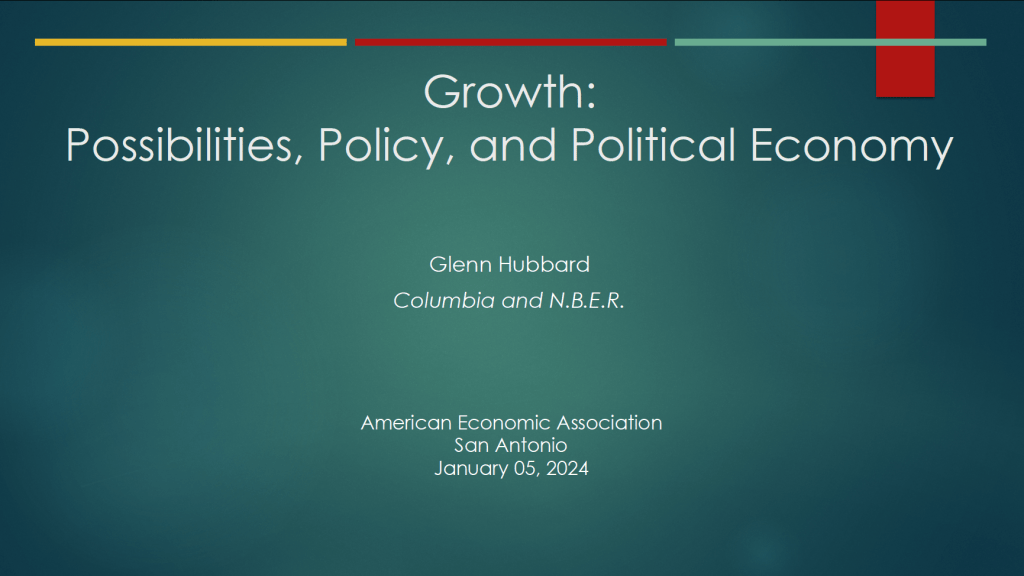
Glenn’s Presentation at the ASSA Session on “The U.S. Economy: Growth, Stagnation or Financial Crisis and Recession?”

Glenn participated in this session hosted by the Society of Policy Modeling and the American Economic Association of Economic Educators and moderated by Dominick Salvatore of Fordham University. (Link to the page for this session in the ASSA program.)

Also making presentations at the session were Robert Barro of Harvard University, Janice Eberly of Northwestern University, Kenneth Rogoff of Harvard University, and John Taylor of Stanford University.

Here is the abstract for Glenn’s presentation:

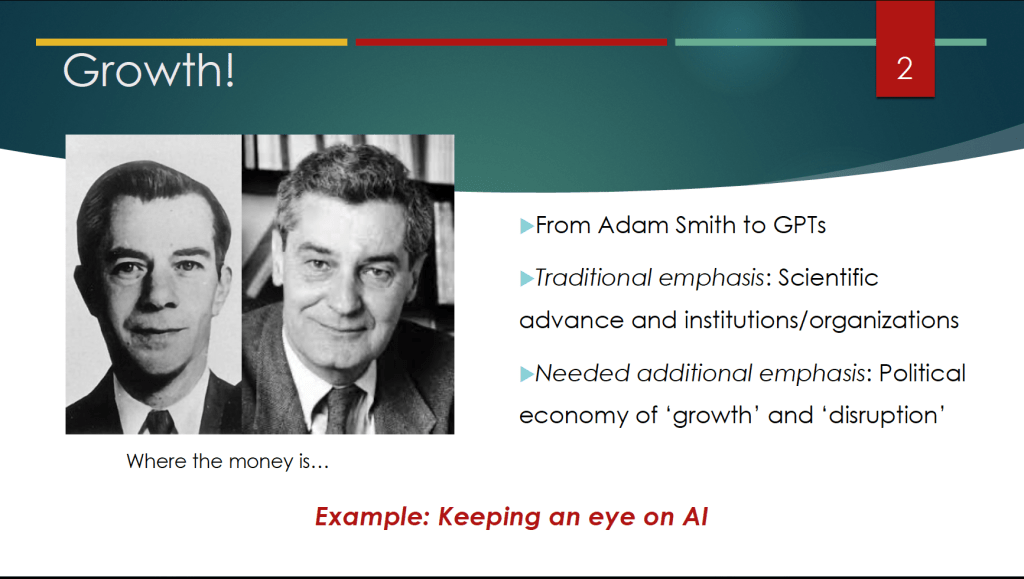
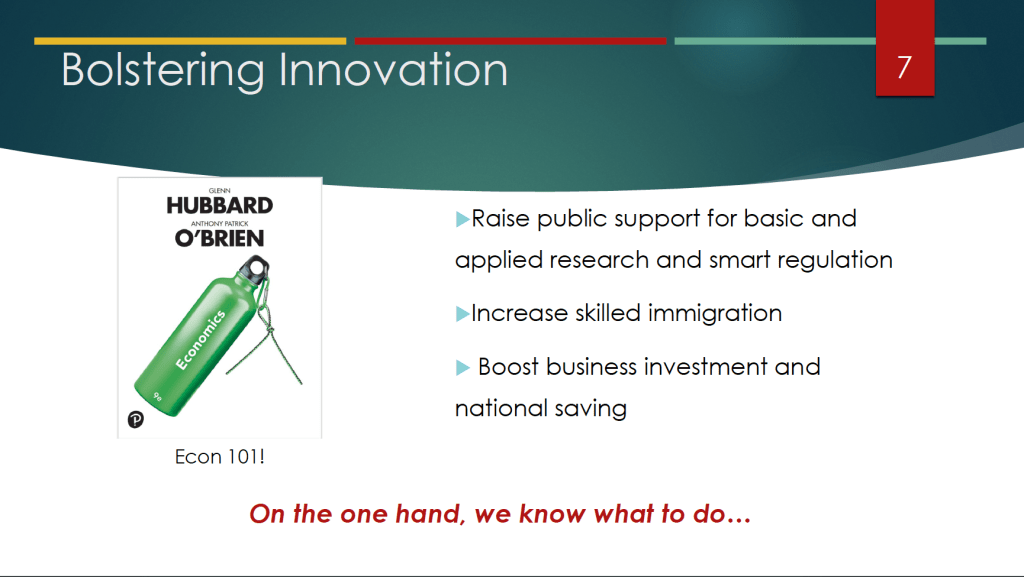
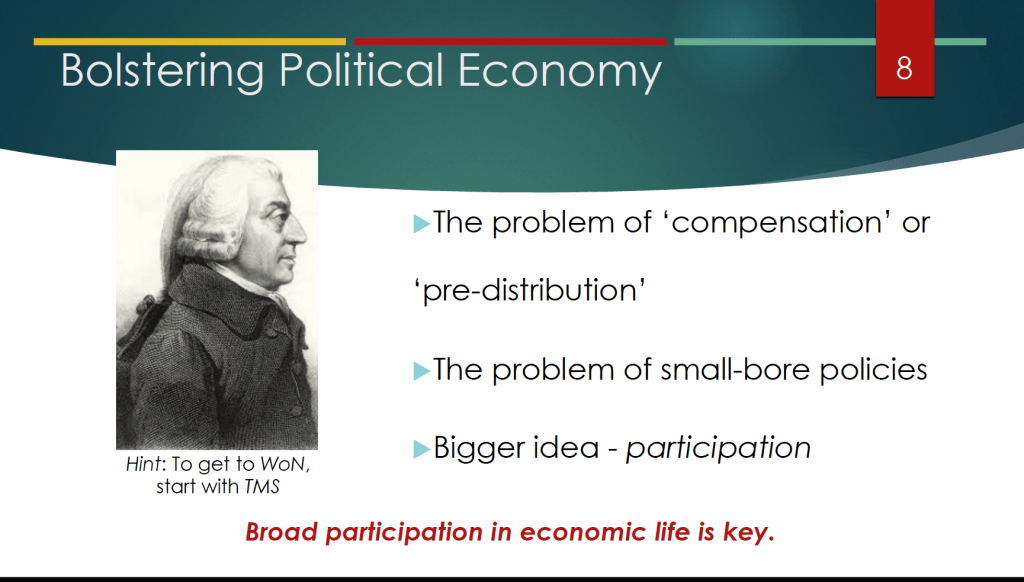
Economic growth is foundational for living standards and as an objective for economic policy. The emergence of Artificial Intelligence as a General Purpose Technology, on the one hand, and a number of demographic and budget challenges, on the other hand, generate an unusually wide range of future economic outcomes. I focus on key ‘policy’ and ‘political economy’ considerations that increase the likelihood of a more favorable growth path given pre-existing trends and technological possibilities. By ‘policy,’ I consider mechanisms enabling growth through research, taxation, the scope of regulation, and competition. By ‘political economy’ factors, I consider mechanisms to increase economic participation in support of growth and policies that enhance it. I argue that both sets of mechanisms are necessary for a viable pro-growth economic policy framework.

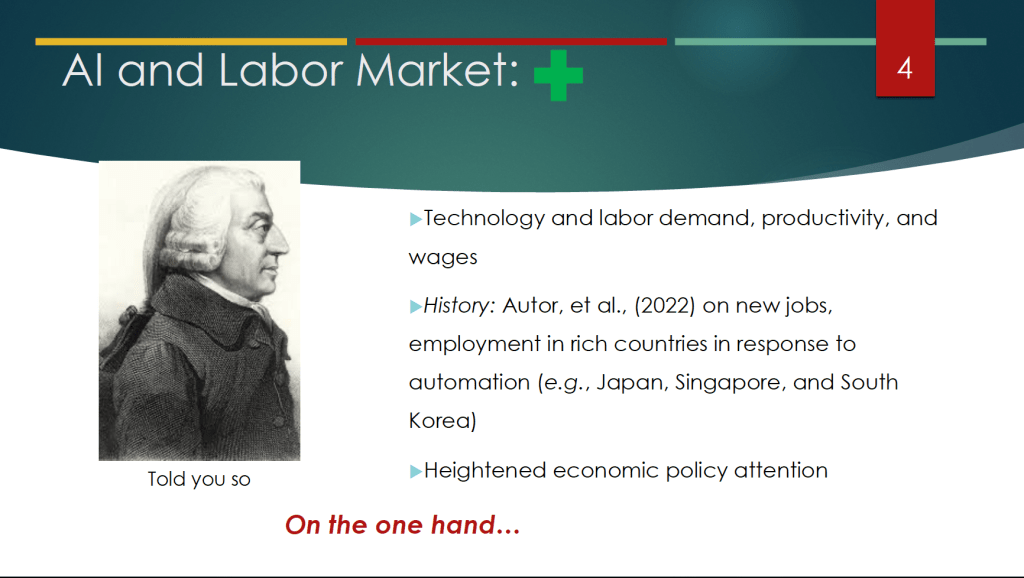
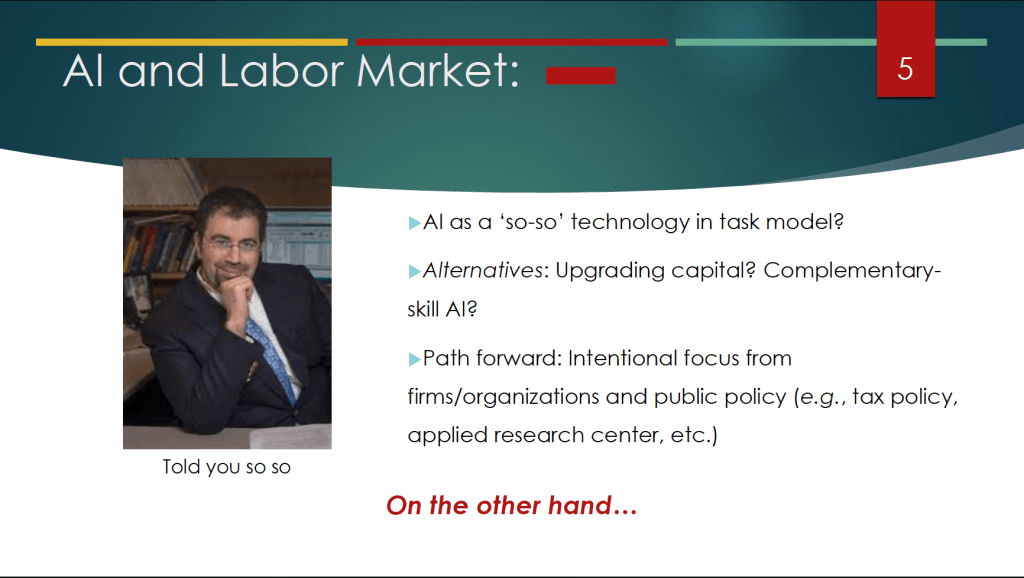
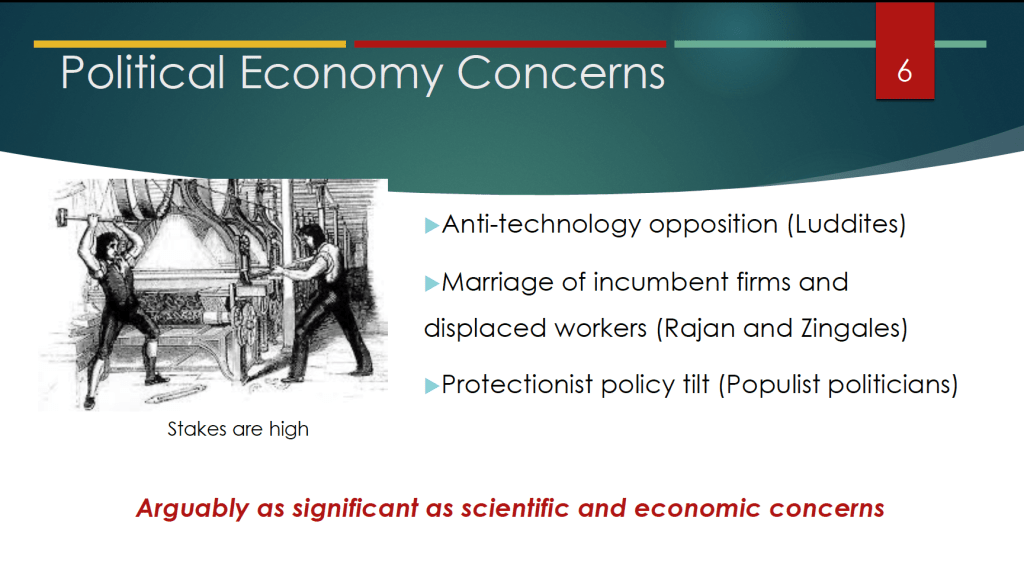
These slides from the presentation highlight some of Glenn’s key points. (Note the cover of the new 9th edition of the textbook in slide 7!)

Another Employment Report Consistent with a Soft Landing

Photo courtesy of Lena Buonanno.

In recent months, the macroeconomic data has generally been consistent with the Federal Reserve successfully bringing about a soft landing: Inflation returning to the Fed’s 2 percent target without the economy entering a recession. The Bureau of Labor Statistics’ latest Employment Situation Report, released on the morning of Friday, December 8,  was consistent with this trend. (The full report can be found here.)

Economists and policymakers—notably including the members of the Federal Reserve’s Federal Open Market Committee (FOMC)—typically focus on the change in total nonfarm payroll employment as recorded in the establishment, or payroll, survey. That number gives what is generally considered to be the best gauge of the current state of the labor market.

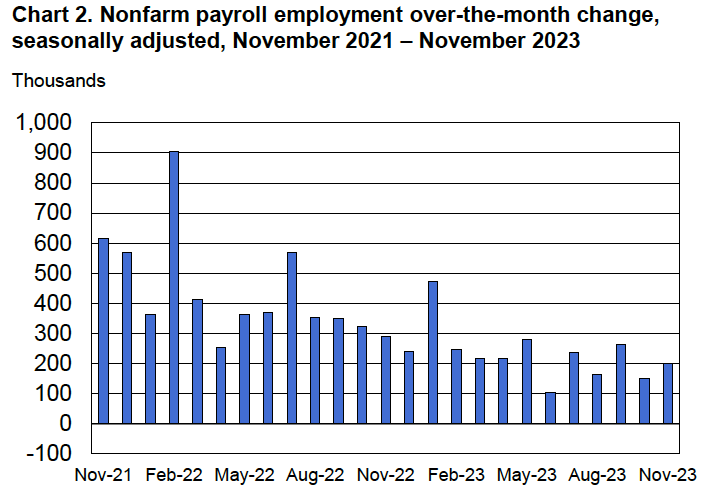
The report indicated that during November there had been a net increase of 199,000 jobs.  This number was somewhat above the expected gain of 153,000 jobs Reuters news service reported from its survey of economists and just slightly above an expected gain of 190,000 jobs the Wall Street Journal reported from a separate survey of economists. The BLS revised downward by 35,000 jobs its previous estimate for September. It left its estimate for October unchanged.  The following figure from the report shows the net increase in jobs each month since November 2021.

Because the BLS often substantially revises its preliminary estimates of employment from the establishment survey, it’s important not to overinterpret data for a single month or even for a few months. But general trends in the data can give useful information on changes in the state of the labor market. The estimate for November is the fourth time in the past six months that employment has increased by less than 200,000. Prior to that, employment had increased by more than 200,000 every month since January 2021.

Although the rate of job increases is slowing, it’s still above the rate at which new entrants enter the labor market, which is estimated to be roughly 90,000 people per month. The additional jobs are being filled in part by increased employment among people aged 25 to 54—so-called prime-age workers. (We discuss the employment-population ratio in Macroeconomics, Chapter 9, Section 9.1, Economics, Chapter 19, Section 9.1, and Essentials of Economics, Chapter 13, Section 13.1.) As the following figure shows, the employment-population ratio for prime-age workers remains above its level in early 2020, just before the spread of the Covid–19 pandemic in the United States.

The estimated unemployment rate, which is collected in the household survey, was down slightly from 3.9 percent to 3.7 percent. A shown in the following figure, the unemployment rate has been below 4 percent every month since February 2022.

The Employment Situation Report also presents data on wages, as measured by average hourly earnings. The growth rate of average hourly earnings, measured as the percentage change from the same month in the previous year, continued its gradual decline, as shown in the following figure. As a result, upward pressure on prices from rising labor costs is easing. (Keep in mind, though, as we note in this blog post, changes in average hourly earnings have shortcomings as a measure of changes in the costs of labor to businesses.)

Taken together, the data in the latest employment report indicate that the labor market is becoming less tight, reflecting a gradual slowing in U.S. economic growth. The data are consistent with the U.S. economy approaching a soft landing. It’s still worth bearing in mind, of course, that, as Fed Chair Jerome Powell continues to caution, there’s no certainty that inflation won’t surge again or that the U.S. economy won’t enter a recession.

10/21/23 Podcast – Authors Glenn Hubbard & Tony O’Brien reflect on the Fed’s efforts to execute the soft-landing.

Join authors Glenn Hubbard & Tony O’Brien as they reflect on the Fed’s efforts to execute the soft landing, ponder if the effect will stick, and wonder if future economies will be tethered to an anchor point above two percent.

9/16/23 Podcast – Authors Glenn Hubbard & Tony O’Brien discuss inflation, the current status of a soft-landing, and the green economy.

Join authors Glenn Hubbard & Tony O’Brien as they discuss the economic landscape of inflation, soft-landings, and the green economy. This conversation occurred on Saturday, 9/16/23, prior to the FOMC meeting on September 19th-20th.

4/29/23 Podcast – Authors Glenn Hubbard & Tony O’Brien discuss a hard vs. soft landing, the debt ceiling, and an economics view of the CHIPS act passed in 2022.

Join authors Glenn Hubbard & Tony O’Brien as they discuss the state of the landing the economy will achieve – hard vs. soft – or “no landing”. Also, they address the debt ceiling and the barriers it might present to a recovery. We also delve into the Chips Act and what economics has to say about the subsidy of a particular industry. Gain insights into today’s economy through our final podcast of the 2022-2023 academic year! Our discussion covers these points but you can also check for updates on our blog post that can be found HERE .

4/8/23 Podcast – Authors Glenn Hubbard & Tony O’Brien discuss the role of small banks in the US financial system in the wake of the recent bank failures.

Join authors Glenn Hubbard and Tony O’Brien as they discuss the future of small banks in the US financial system in the wake of recent bank failures. With a government that is guaranteeing just about all deposits, what is the role of deposit insurance. Small banks serve a real purpose in our economy and will further government regularly only complicate their mission. Other small business rely on small banks for their intimate knowledge of their market and of their business. However, many may now rely on larger banks that may seem a safer place over the next few years. Our discussion covers these points but you can also check for updates on our blog post that can be found HERE .