Photo courtesy of Lena Buonanno.
In recent months, the macroeconomic data has generally been consistent with the Federal Reserve successfully bringing about a soft landing: Inflation returning to the Fed’s 2 percent target without the economy entering a recession. The Bureau of Labor Statistics’ latest Employment Situation Report, released on the morning of Friday, December 8, was consistent with this trend. (The full report can be found here.)
Economists and policymakers—notably including the members of the Federal Reserve’s Federal Open Market Committee (FOMC)—typically focus on the change in total nonfarm payroll employment as recorded in the establishment, or payroll, survey. That number gives what is generally considered to be the best gauge of the current state of the labor market.
The report indicated that during November there had been a net increase of 199,000 jobs. This number was somewhat above the expected gain of 153,000 jobs Reuters news service reported from its survey of economists and just slightly above an expected gain of 190,000 jobs the Wall Street Journal reported from a separate survey of economists. The BLS revised downward by 35,000 jobs its previous estimate for September. It left its estimate for October unchanged. The following figure from the report shows the net increase in jobs each month since November 2021.
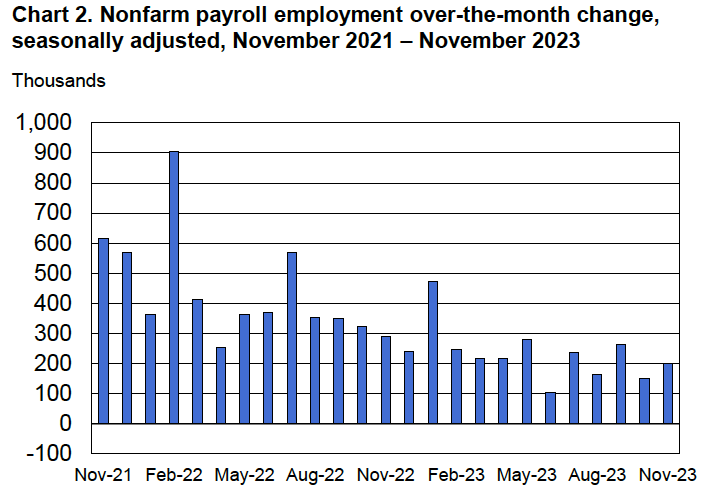
Because the BLS often substantially revises its preliminary estimates of employment from the establishment survey, it’s important not to overinterpret data for a single month or even for a few months. But general trends in the data can give useful information on changes in the state of the labor market. The estimate for November is the fourth time in the past six months that employment has increased by less than 200,000. Prior to that, employment had increased by more than 200,000 every month since January 2021.
Although the rate of job increases is slowing, it’s still above the rate at which new entrants enter the labor market, which is estimated to be roughly 90,000 people per month. The additional jobs are being filled in part by increased employment among people aged 25 to 54—so-called prime-age workers. (We discuss the employment-population ratio in Macroeconomics, Chapter 9, Section 9.1, Economics, Chapter 19, Section 9.1, and Essentials of Economics, Chapter 13, Section 13.1.) As the following figure shows, the employment-population ratio for prime-age workers remains above its level in early 2020, just before the spread of the Covid–19 pandemic in the United States.

The estimated unemployment rate, which is collected in the household survey, was down slightly from 3.9 percent to 3.7 percent. A shown in the following figure, the unemployment rate has been below 4 percent every month since February 2022.

The Employment Situation Report also presents data on wages, as measured by average hourly earnings. The growth rate of average hourly earnings, measured as the percentage change from the same month in the previous year, continued its gradual decline, as shown in the following figure. As a result, upward pressure on prices from rising labor costs is easing. (Keep in mind, though, as we note in this blog post, changes in average hourly earnings have shortcomings as a measure of changes in the costs of labor to businesses.)

Taken together, the data in the latest employment report indicate that the labor market is becoming less tight, reflecting a gradual slowing in U.S. economic growth. The data are consistent with the U.S. economy approaching a soft landing. It’s still worth bearing in mind, of course, that, as Fed Chair Jerome Powell continues to caution, there’s no certainty that inflation won’t surge again or that the U.S. economy won’t enter a recession.