Weaker than Expected Jobs Report

Image generated by ChatGPT

This morning (July 2)—one day early because tomorrow is a federal holiday—the Bureau of Labor Statistics (BLS) released its “Employment Situation” report (often called the “jobs report”) for June. The report showed a smaller than expected increase in employment. 

The jobs report has two estimates of the change in employment during the month: one estimate from the establishment survey, often referred to as the payroll survey, and one from the household survey. As we discuss in Macroeconomics, Chapter 9, Section 9.1 (Economics, Chapter 19, Section 19.1), many economists and Federal Reserve policymakers believe that employment data from the establishment survey provide a more accurate indicator of the state of the labor market than do the household survey’s employment and unemployment data. (The groups included in the employment estimates from the two surveys are somewhat different, as we discuss in this post.)

According to the establishment survey, there was a net increase of 57,000 nonfarm jobs during June. Economists surveyed by the Wall Street Journal had forecast an increase of 115,000 jobs.  Economists surveyed by FactSet had a lower forecast of a net increase of 100,000 jobs. The BLS revised downward its previous estimates of employment in April and May by a combined 74,000 jobs. (The BLS notes that: “Monthly revisions result from additional reports received from businesses and government agencies since the last published estimates and from the recalculation of seasonal factors.”)

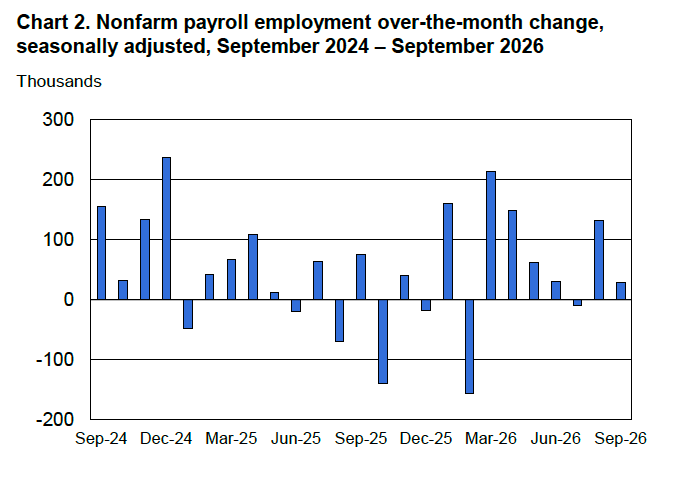
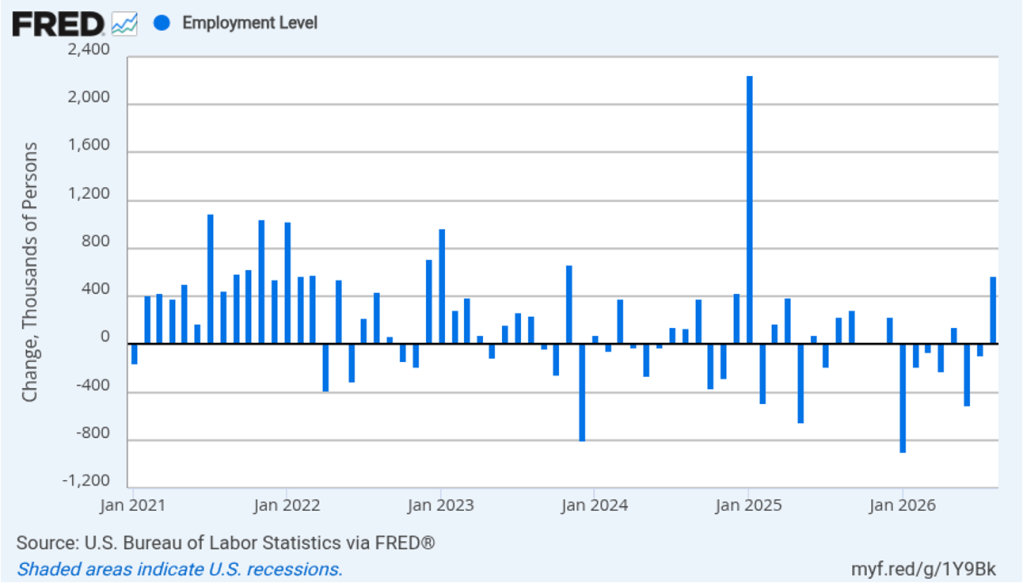
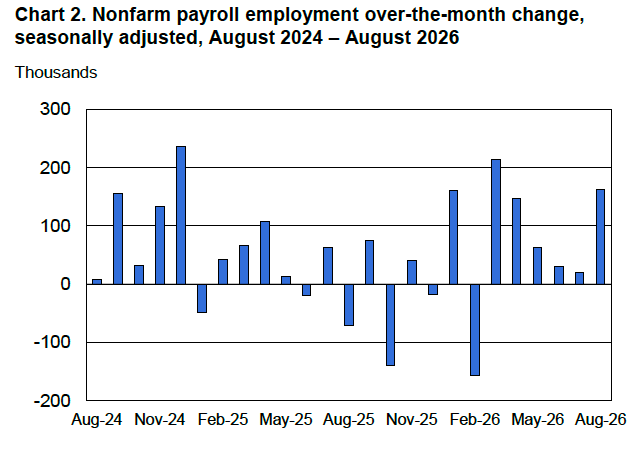
The following figure from the jobs report shows the net change in nonfarm payroll employment for each month in the last two years. The figure shows that the relatively strong 137,000 average net increase in jobs over the past four months represents a break from the unusual pattern in that began in the middle of 2025 in which months of declining employment and months of increasing employment had been alternating. 

These employment gains conflict with a popular view among economists that slowing labor force growth has driven the break-even rate of employment growth—the rate required to keep the unemployment rate constant—down to nearly zero

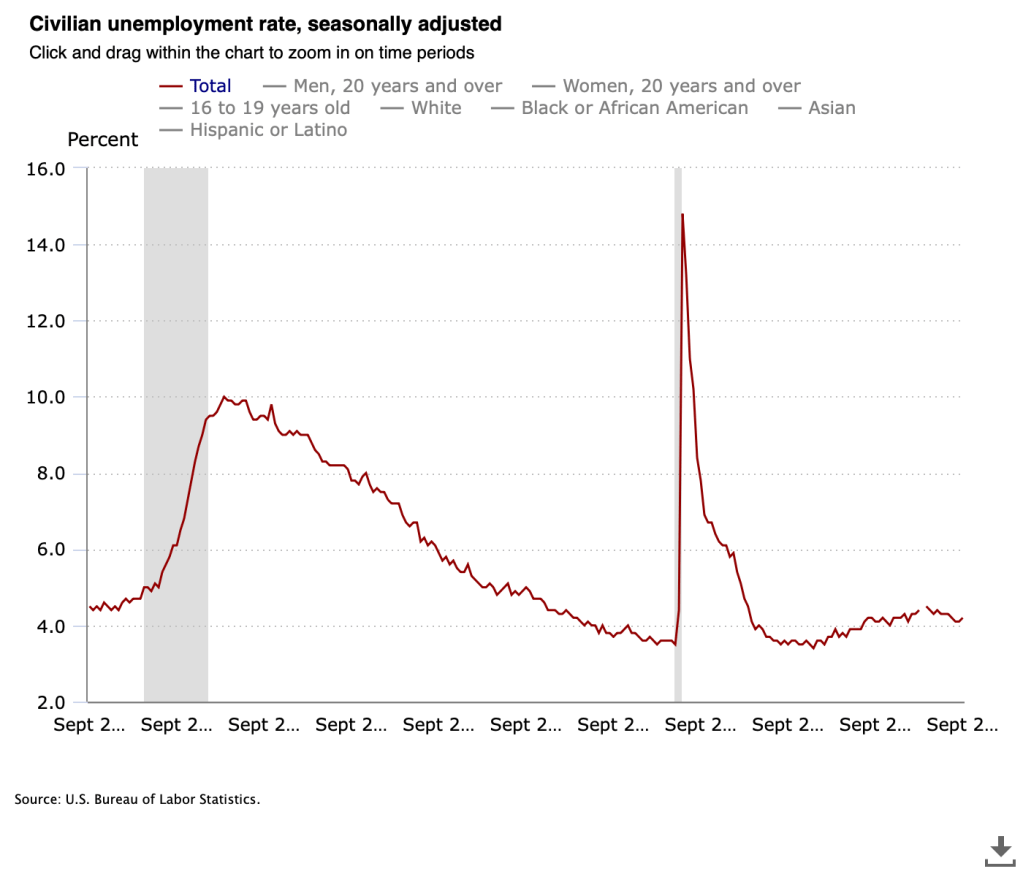
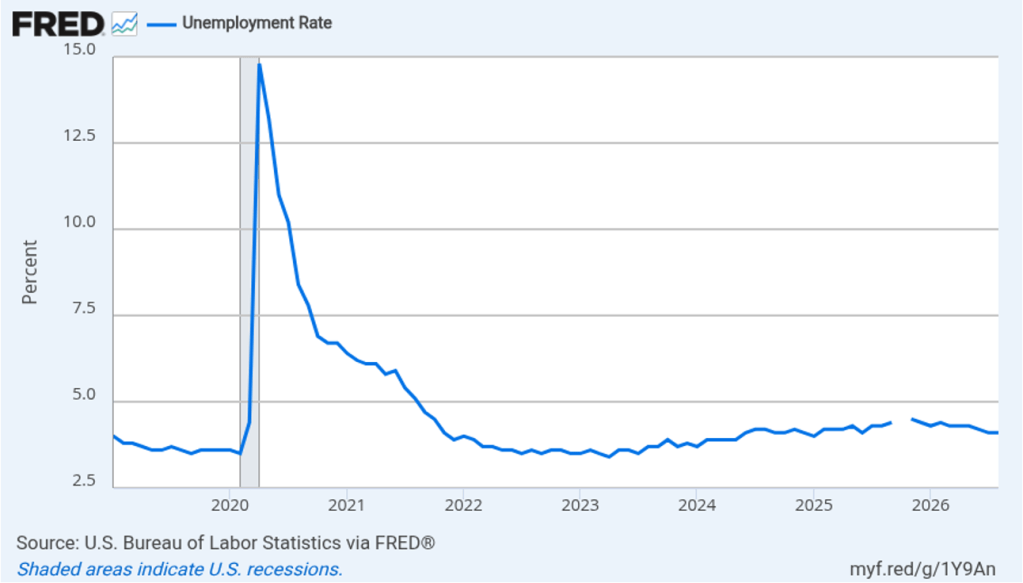
Despite the relatively small increase in employment in June, the unemployment rate, which is calculated from data in the household survey, declined to 4.2 percent from 4.3 percent in May at 4.3. The decline in the unemployment rate was due to a decline in the estimated size of the labor force, an estimate that fluctuates significantly from month to month. Despite that fact, as the following figure shows, the unemployment rate has been remarkably stable over the past year and a half, staying between 4.0 percent and 4.4 percent in each month since May 2024. The Federal Open Market Committee’s current  estimate of the natural rate of unemployment—the normal rate of unemployment over the long run—is 4.2 percent. So, currently the unemployment rate is equal to that estimate of the natural rate. (We discuss the natural rate of unemployment in Macroeconomics, Chapter 9 and Economics, Chapter 19.)

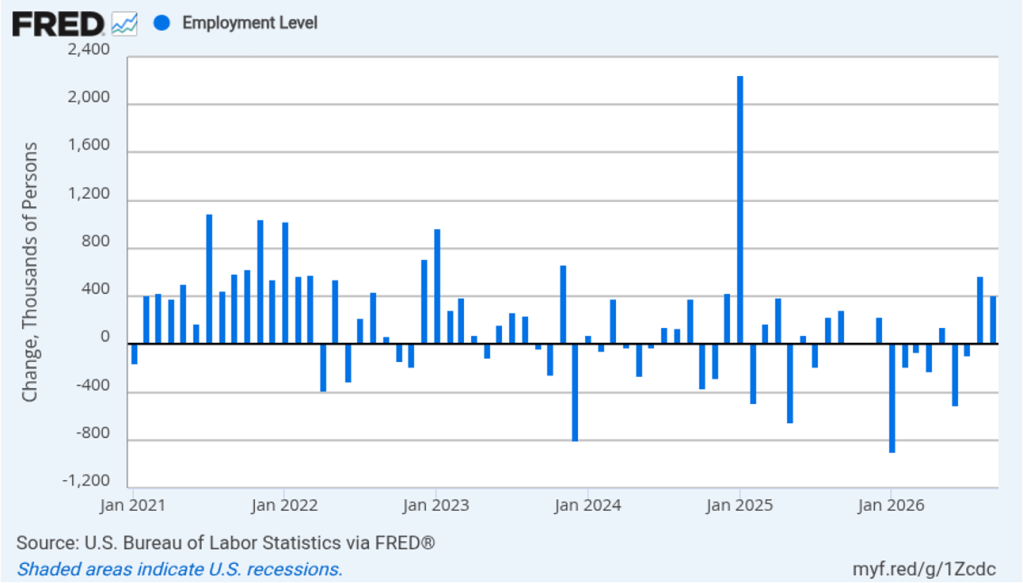
As the following figure shows, the monthly net change in jobs from the household survey moves much more erratically than does the net change in jobs from the establishment survey. As measured by the household survey, there was a net decrease of 507,000 jobs in June, as compared to the net increase in employment shown in the establishment survey. In addition, the household survey shows a significant net decline in jobs during the past six months, in contrast to the significant net increase in jobs shown in the establishment survey. (Note that because of last year’s shutdown of the federal government, there are no data for October or November.)

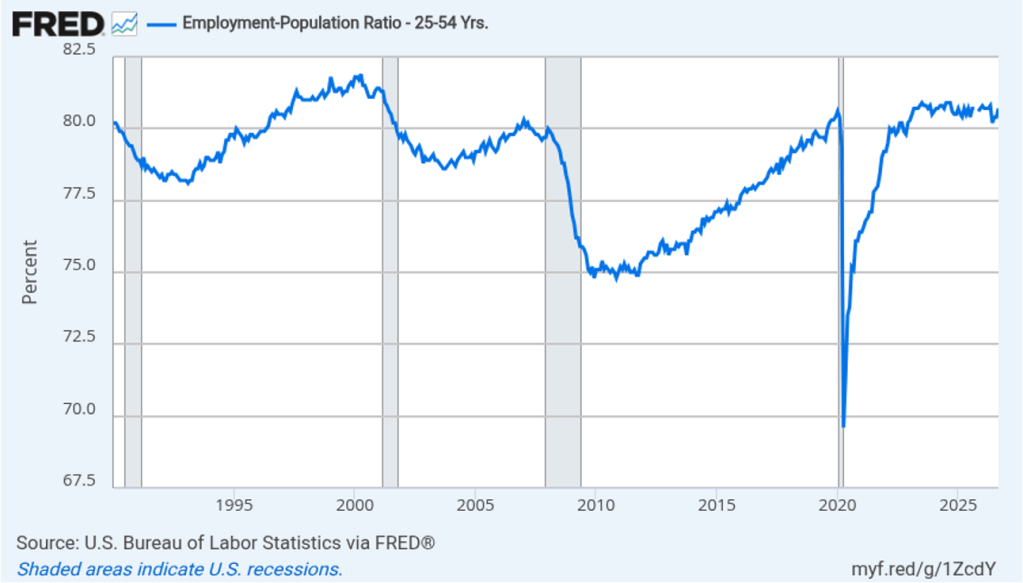
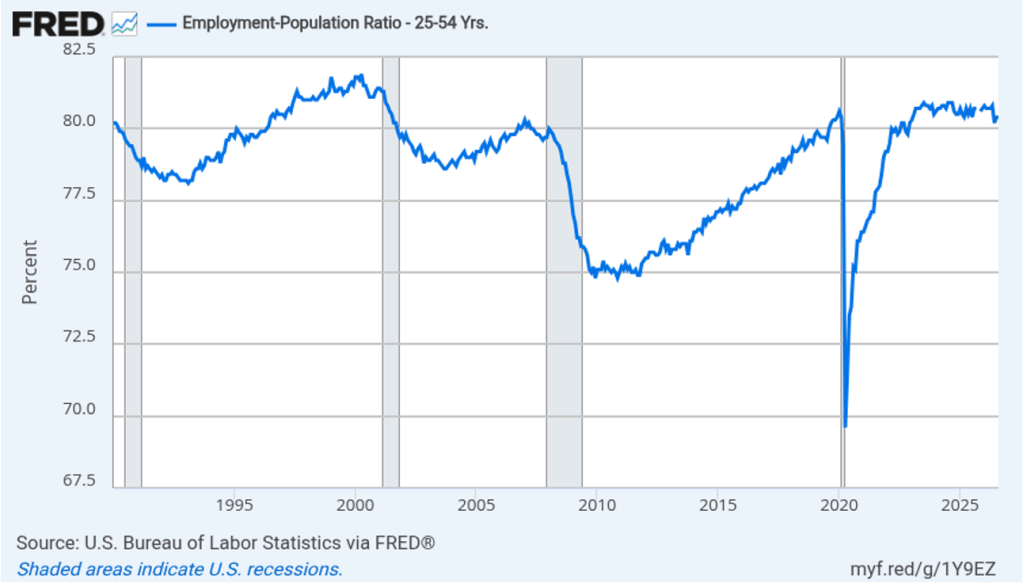
The household survey has another important labor market indicator: the employment-population ratio for prime age workers—those workers aged 25 to 54. In June. the ratio declined sharply to 80.2 percent from 80.8 percent in May, the lowest value since December 2022. The decline in the prime-age population ratio is difficult to reconcile with the net increase in employment shown in the payroll survey. The state of the labor market in June seemed significantly weaker in household survey data than in establishment survey data.

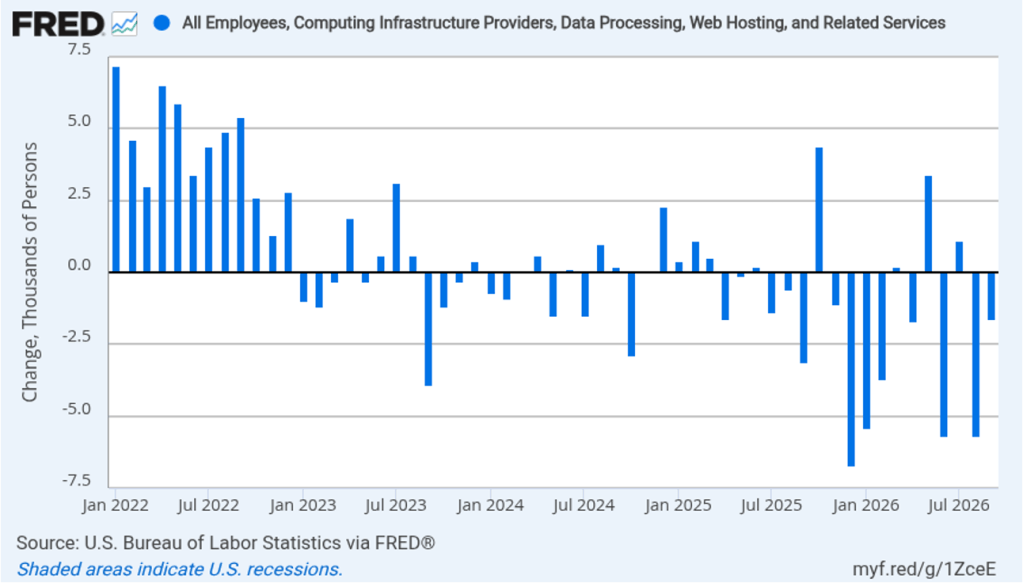
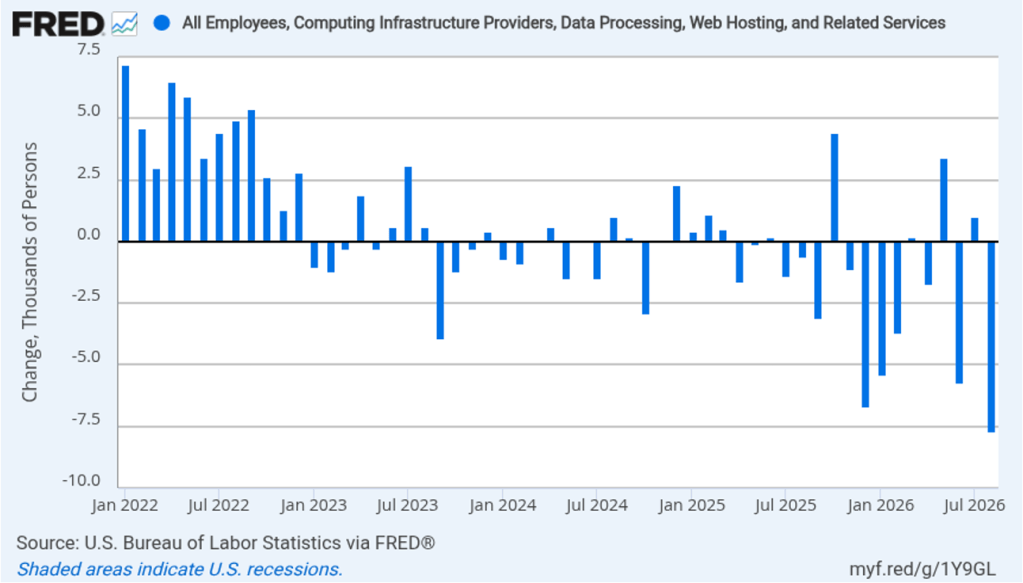
There have been media reports of firms, including Salesforce, Cloudflare, Coinbase, Cisco Systems, and Meta Platforms, laying off workers in information systems. The following figure shows net employment changes in the BLS employment category of “computing infrastructure providers, data processing, web hosting, and related services.” Employment in this sector has been declining during most months since the beginning of 2023. June was no exception with a net decrease of 3,300 jobs.

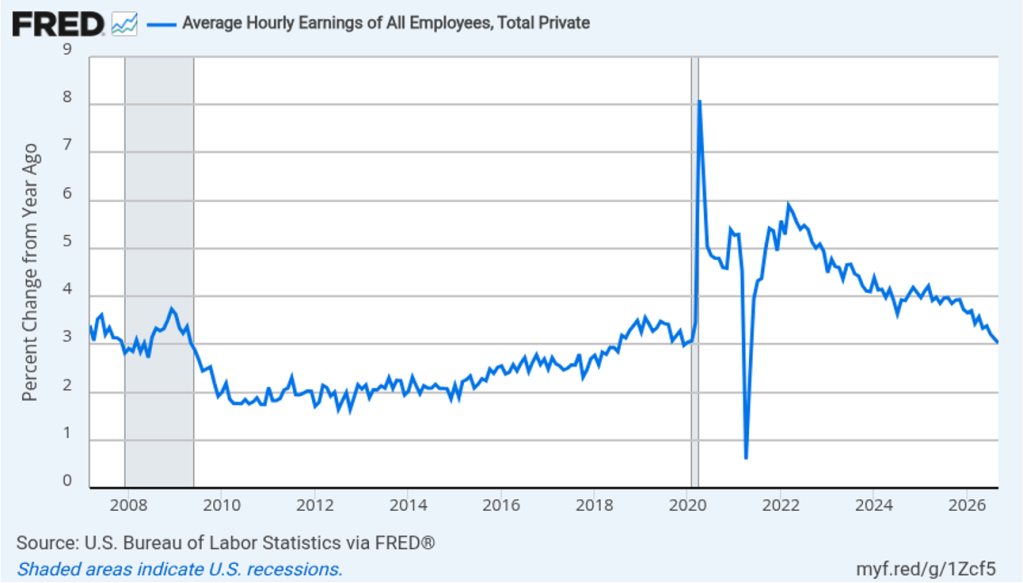
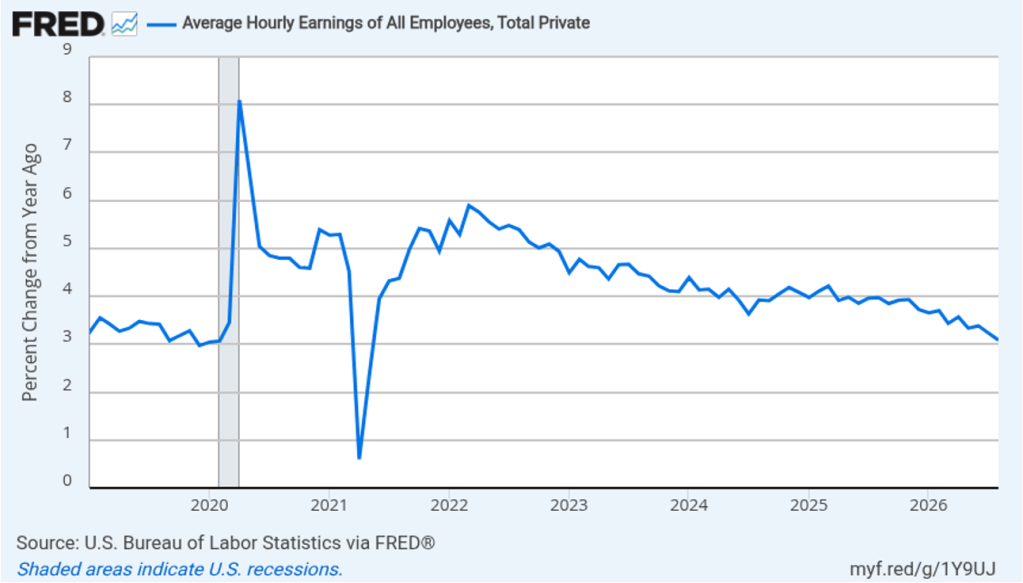
The establishment survey also includes data on average hourly earnings (AHE). As we noted in this post, many economists and policymakers believe the employment cost index (ECI) is a better measure of wage pressures in the economy than is the AHE. The AHE does have the important advantage of being available monthly, whereas the ECI is only available quarterly. The following figure shows the percentage change in the AHE from the same month in the previous year. The AHE increased 3.5 percent in June, up slightly from 3.4 percent in May.

What effect is this jobs report likely to have on the decisions of the Federal Reserve’s policymaking Federal Open Market Committee (FOMC) at its next meeting on July 28–19? The slowdown in employment growth reduces the chance that the FOMC will increase its target range for the federal funds rate. The probability that investors in the federal funds futures market assign to the FOMC increasing its target range at that meeting fell from 28.9 percent yesterday to 17.6 percent this morning. Investors still assign a 54.0 percent probability to the FOMC raising its target range at its September meeting, but that was down from 64.1 percent yesterday.

Supreme Court Rules that Lisa Cook Can Remain on the Fed Board

Image created by ChatGPT of the U.S. Supreme Court building

The Federal Reserve Act states that a member of the Federal Reserve’s Board of Governors “shall hold office for a term of fourteen years from the expiration of the term of his predecessor, unless sooner removed for cause by the President.” In August 2025, President Trump attempted to remove Governor Lisa Cook from the Board on the grounds that she had made misrepresentations in a mortgage application in an attempt to secure a lower interest rate. Cook filed suit arguing that, rather than removing her for cause, the president wished to remove her because he disagreed with some of her policy positions. She also argued that she had not been given an opportunity to rebut the accusations against her.

Her lawsuit made its way through the federal courts, eventually reaching the Supreme Court. Today, in a 5 to 4 ruling, the justices sent the case back to a lower court to determine the merit of the accusation against Cook. The majority opinion stated that, “Under the Court’s precedents, Cook was entitled to notice and some opportunity to respond before her termination.”

Image created by ChatGPT of of President Franklin Roosevelt

As we noted in a blog post last year, President Trump’s attempt to fire Governor Cook involved a larger issue. The ability of Congress to limit the president’s power to appoint and remove heads of commissions, agencies, and other bodies in the executive branch of government—such as the Federal Reserve—is not clearly specified in the Constitution. For years, the federal courts had followed the precedent established in the 1935 case of Humphrey’s Executor. In that case, the Court ruled that President Franklin Roosevelt couldn’t remove a member of the Federal Trade Commission (FTC) because in creating the FTC, Congress specified that members could only be removed for cause.

In recent years, the Court has been narrowing the scope of the Humphrey’s Executor ruling. Today, in a case involving President Trump’s attempt to fire a commissioner serving on the Federal Trade Commission (FTC), the Court overturned its ruling in Humphrey’s Executor. Henceforward, president’s will be allowed to fire members of any regulatory commission or other body in the Executive Branch of the federal government without having to establish a cause for the firing.

The Court did not, however, rule today as to whether presidents are allowed to fire members of the Fed’s Board of Governors or whether the Federal Reserve has a special role in the government that requires presidents to remove Governors only for cause. The majority opinion contains a summary of the history of central banks in the United States. That summary seems to indicate that, in fact, a majority of the Court does see the Fed as having a special role in the government. In other words, it seems likely that the government would have to prove that Governor Cook had engaged in significant wrongdoing for her to be removed from office by the president.

Image created by ChatGPT of the Federal Reserve’s headquarters

The majority in this case consisted of Chief Justice John Roberts, Justice Brett Kavanaugh—both of whom were appointed to the Court by Republican presidents—and the three justices who were appointed by Democratic presidents. Three of the other Republican-appointed justices dissented on the grounds that the Court should have waited until the charges against Cook had been resolved in a lower court before ruling. It’s possible that if the case returns to the Supreme Court after questions of fact have been decided in a lower court, one or more of these justices may side with the majority in today’s ruling in holding that members of the Board of Governors cannot be removed from office except for cause. Justice Clarence Thomas—who was also appointed by a Republican president—was the only justice to argue that presidents should be allowed to freely remove members of the Board of Governors. Justice Thomas specifically rejected the argument that the Fed plays a special role in the federal government that differs from the roles played by other agencies such as the FTC: “The Court makes many policy arguments for an ‘independent’ banking agency that exercises executive power free from accountability … but those are ultimately arguments against the Constitution.”

Alan Greenspan, former Fed Chair, Dies at 100

Image created by ChatGPT of Alan Greenspan as a maestro

Earlier this week, Alan Greenspan, former chair of the Federal Reserve passed away at the age of 100. Greenspan may have been the best-known Fed chair in history. People who follow the economics and business news know who Jerome Powell and Kevin Warsh are. But many people who don’t follow the news likely have never heard of them. During his term as Fed chair from 1987 to 2006, Greenspan achieved a level of celebrity that made him one of the best known public officials of the past 50 years.

Greenspan served as Fed chair for 18 years and 5 months, a term in office exceeded only by William McChesney Martin who served as chair for 5 months longer. The Federal Reserve Act requires that the president choose as chair a member of the Fed’s Board of Governors. As we discuss in Macroeconomics, Chapter 14, Section 14.4 (Economics, Chapter 24, Section 24.4, and Money, Banking, and the Financial System, Chapter 13, Section 13.1), after being nominated by the president and confirmed by the Senate, members of the Board of Governors serve 14-year, nonrenewable terms. The following figure, reproduced from Chapter 14, illustrates the structure of the Fed.

If members of the Board of Governs serve a single 14-year term, how did both Greenspan and Martin serve for more than 18 years? The answer is that, although a member of the Board of Governors cannot be nominated to a second term, someone who serves out the remainder of the term of a member who has left the board can be nominated by the president to a full term. In August 1987, Greenspan was nominated by President Ronald Reagan to fill the remainder of Paul Volcker’s term on the Board of Governors and to replace Volcker as chair.  Volcker had been nominated by President Jimmy Carter in 1979 to the unexpired term of G. William Miller. When the Miller/Volcker/Greenspan term expired in 1992, President George H. W. Bush nominated Greenspan to a new 14-year term. Volcker stepped down from the Board of Governors in 1987 after deciding that he would not ask President Reagan to nominate him to a third term as chair. (In this oral history, Volcker discusses the somewhat ambiguous circumstances under which he came to his decision.)

Greenspan served out the 4 years and 5 months that remained in the Miller/Volcker term and then served the 14 years of his own term. When his term expired in January 2006, President George W. Bush nominated Ben Bernanke to take Greenspan’s place as chair. One other institutional note: It’s sometimes written that the chair of the Board of Governors is automatically the chair of the Federal Open Market Committee. In fact, under the Federal Reserve Act, the FOMC chooses its own chair. In practice, though, the chair of the Board of Governors has always been elected chair by the members of the FOMC, as happened in May when Warsh began his term of chair of the Board of Governors and was voted chair by the members of the FOMC.

Photo of Paul Volcker from federalreserve.gov

During his time as chair, economists, Fed watchers on Wall Street, and members of Congress generally commended Greenspan’s performance.  In particular, Greenspan received praise for his handling of the 1987 stock market crash, the failure of the Long-Term Capital Management hedge fund in 1997, and the foreign debt crises in the 1990s and early 2000s involving Mexico, several Asian countries, Russia, and Argentina. In July 1995, Greenspan began the modern procedure of explicitly stating the FOMC’s target for the federal funds rate after each meeting. Prior to that time, financial analysts and economists tried to determine the target federal funds rate by observing the size of the Fed’s New York Trading Desk transactions with primary dealers and by determining how much banks were charging each other for short-term loans in the federal funds market. In 2001, journalist Bob Woodward wrote a very favorable account of Greenspan’s role as Fed chair in the book Maestro: Greenspan’s Fed and the American Boom

Photo from Amazon.com

Greenspan’s reputation was dimmed by the severity of the Global Financial Crisis of 2007–2009, which began nearly two years after his term of office. Greenspan was criticized for having kept the target for the federal funds rate too low in the years following the 2001 recession. Critics argue that low borrowing costs increased the amount of speculation in financial markets. Greenspan was also criticized for the Fed’s failure to use its legal authority to more closely regulate the mortgage market, which might have stopped mortgage lenders from weakening credit standards, thereby increasing the number of borrowers who would have difficulty making payments on their mortgages if housing prices declined. Greenspan also resisted increased regulation of financial derivatives, particularly those not traded on financial markets. During the financial crisis, the rapidly falling prices of some derivatives undermined the solvency of some financial firms. (In Money, Banking, and the Financial System, we discuss derivative markets in Chapter 7.)

A brief biography of Greenspan can be found here.  A useful overview of Greenspan’s career is given in this article by Nick Timiraos in the Wall Street Journal. (A subscription may be required.)

When Kevin Warsh was sworn in as Fed chair, Greenspan was the only one of his predecessors that he mentioned by name, despite Warsh having served several years on the Board of Governors when Ben Bernanke was Fed chair. On several occasions, Warsh has praised Greenspan for resisting pressure during the 1990s to raise the target for the federal funds rate. During that period, Greenspan believed, correctly, that the information revolution resulting from the spread of personal computers and the greater use of the internet meant that real GDP and employment could increase rapidly without leading to an increase in inflation. Warsh believes that the AI revolution has put the Fed in a similar situation today. According to an article in the Financial Times, “Warsh predicts the AI boom will upend the world of work quickly, with the best companies doing ‘things that are unimaginable’ within a year.”

Warsh argues that rising productivity from the spread of AI will allow the Fed to keep the target for the federal funds rate lower without risking rising inflation in a way similar to Greenspan’s policy in the 1990s. The following figure shows productivity growth, as measured by the annual rate of change of output per hour worked for the nonfarm business sector, during the period from the first quarter of 2000 through the first quarter of 2026. Productivity has grown at an annual rate of 2.6 percent since the first quarter of 2023 as opposed to a rate of 2.0 percent for the whole period since 2000.

Productivity moves erratically over short periods, so it’s not yet clear whether AI, in fact, will cause a sustained increase in output per hour worked. Many economists argue that over the short run, AI may be increasing demand more than it is increasing supply. The most important effect of AI to this point might be the surge in demand for data centers, which accounts for more than a third of new capital investment. In addition, Warsh’s remarks at his press conference following the last FOMC meeting made it clear that his top priority is to bring inflation back to the Fed’s 2 percent target. Investors trading in the federal funds futures market now assign a 60 percent probability to the FOMC raising its target for the federal funds rate at its September meeting.

If Warsh intends to follow Greenspan’s strategy of keeping interest rates low to facilitate rapid economic growth during a surge in productivity, he likely won’t begin doing so until well into 2027.

New BEA Releases Show Faster Growth and Higher Inflation

Image created by ChatGPT

The Bureau of Economic Analysis (BEA) released two reports this morning (June 25): “GDP (Third Estimate), Industries, Corporate Profits, State GDP, and State Personal Income, 1st Quarter 2026” and “Personal Income and Outlays, May 2026.” The BEA revised upward its estimate of real GDP growth in the first quarter of 2026 from an annual rate of 1.6 percent to an annual rate of 2.1 percent. Economists surveyed by LSEG had expected that the BEA would leave its estimate of real GDP growth in the first quarter unchanged. The following figure shows the BEA’s estimated rates of real GDP growth in each quarter beginning with the first quarter of 2022.

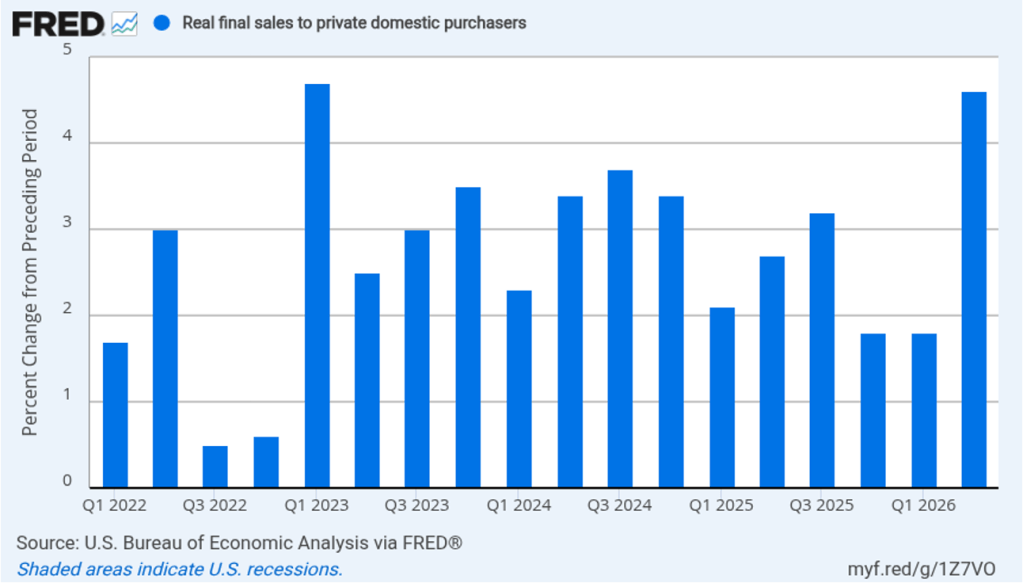
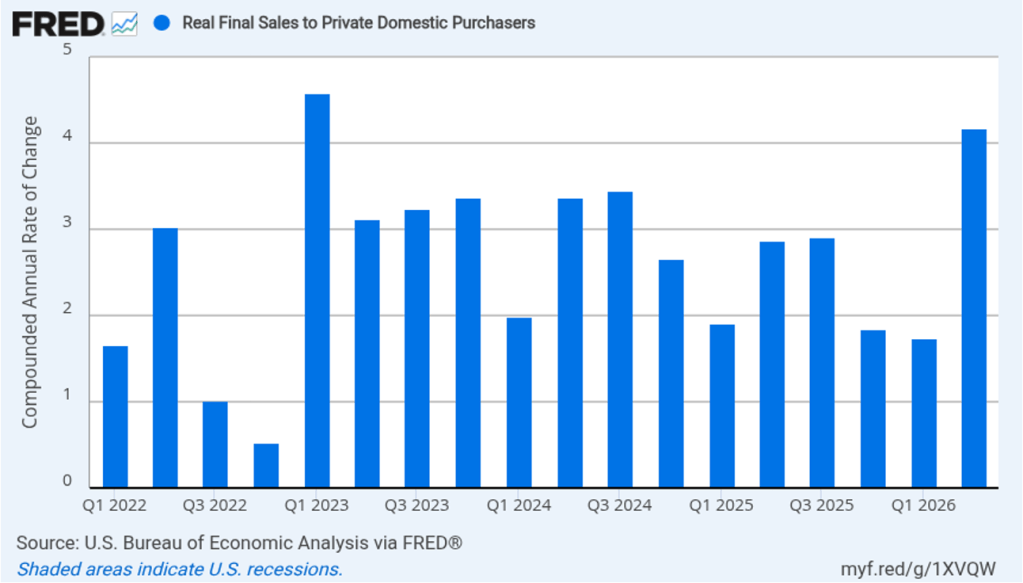
As we’ve discussed in previous blog posts, to better gauge the state of the economy, policymakers—including former Fed Chair Jerome Powell—often prefer to strip out the effects of imports, inventory investment, and government expenditures—which can be volatile—by looking at real final sales to private domestic purchasers, which includes only spending by U.S. households and firms on domestic production. As the following figure shows, real final sales to domestic purchasers increased at an annual rate of 1.7 percent in the first quarter, below the 2.1 percent rate of increase in real GDP and close to the U.S. economy’s expected long-run annual real growth rate of 1.8 percent. Note also that real final sales to private domestic purchasers grew by 2.9 percent in the third quarter of 2025, during which real GDP grew by 4.4 percent, and by 1.9 percent in the first quarter of 2025, when real GDP declined by 0.6 percent. So this measure of output is more stable, and likely is a better indicator of the underlying growth rate in the economy, than is the growth rate of real GDP.


The BEA’s “Personal Income and Outlays” report this morning included monthly data on the personal consumption expenditures (PCE) price index. The Fed relies on annual changes in the PCE price index to evaluate whether it’s meeting its 2 percent annual inflation target. (Fed Chair Kevin Warsh has indicated that in the future he may want the Fed to focus on a different measure of inflation.)

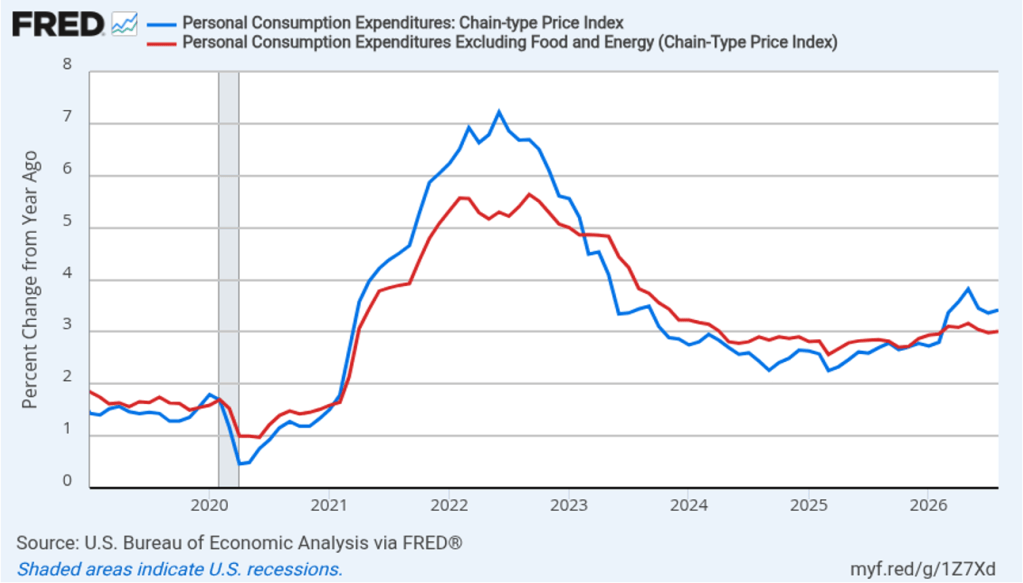
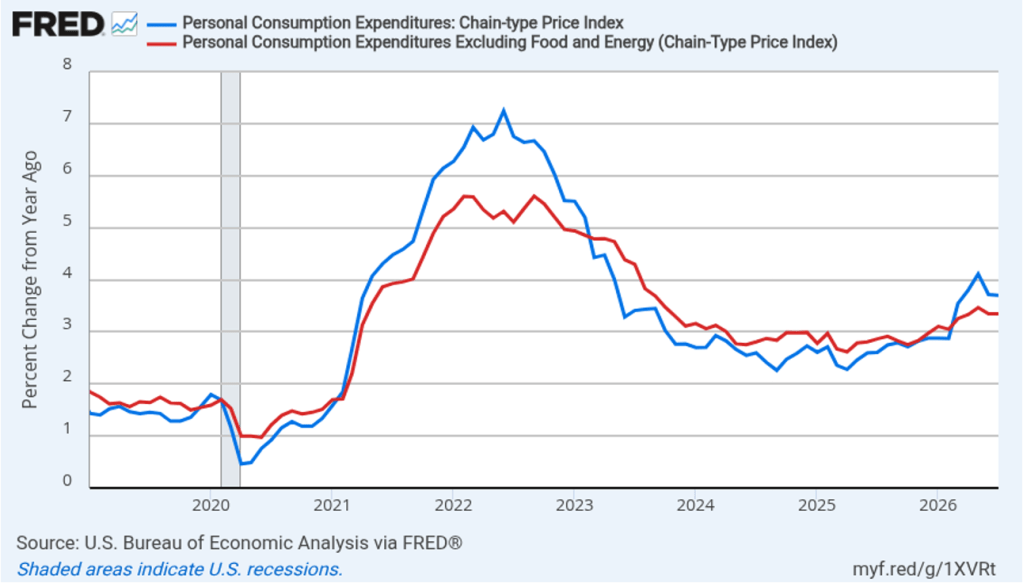
The following figure shows headline PCE inflation (the blue line) and core PCE inflation (the red line)—which excludes energy and food prices—for the period since January 2019, with inflation measured as the percentage change in the PCE from the same month in the previous year. In May, headline PCE inflation was 4.1 percent, up from 3.8 percent in April, and the highest rate since April 2023. Core PCE inflation in May was 3.4 percent, up slightly from 3.3 percent in April. Headline PCE inflation was equal to the forecasts of economists surveyed by FactSet, while core PCE inflation was slightly higher. Both headline PCE inflation and core PCE inflation remain well above the Fed’s 2 percent annual inflation target.

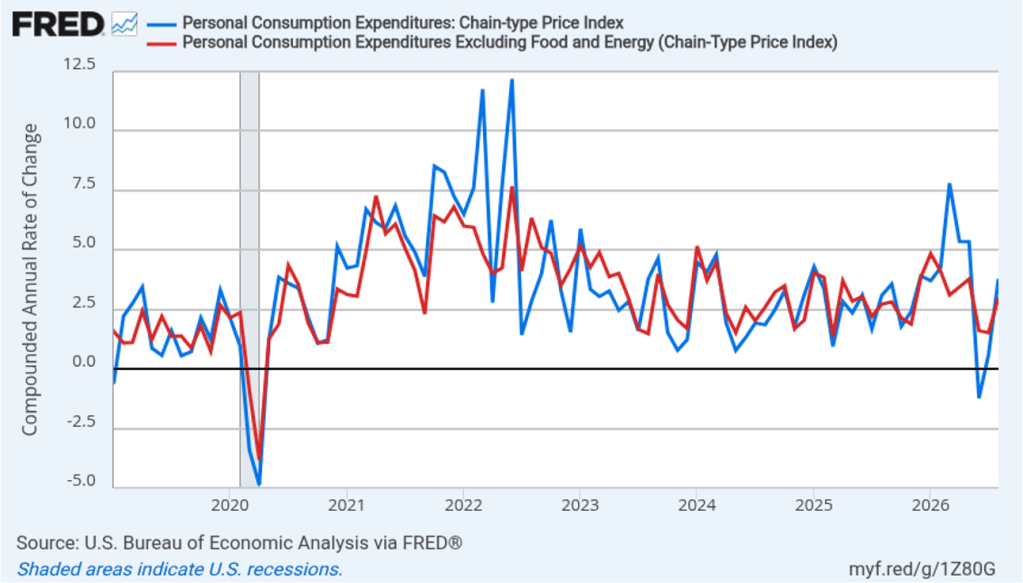
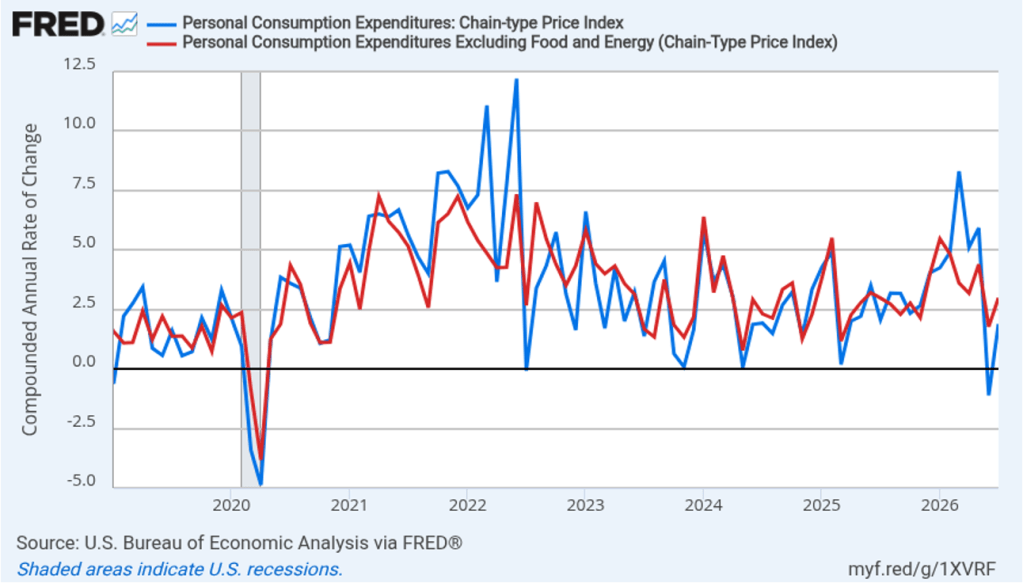
The following figure shows monthly PCE inflation and monthly core PCE inflation calculated by compounding the current month’s rate over an entire year. (Often referred to as 1-month inflation.) Measured this way, headline PCE inflation increased from 5.0 percent in April to 5.5 percent in May. Core PCE inflation rose from 3.0 in April to 3.9 percent in May. Even leaving aside the effect of rising gasoline prices on headline PCE, these data show that in May both core and headline PCE inflation were well above the Fed’s target.


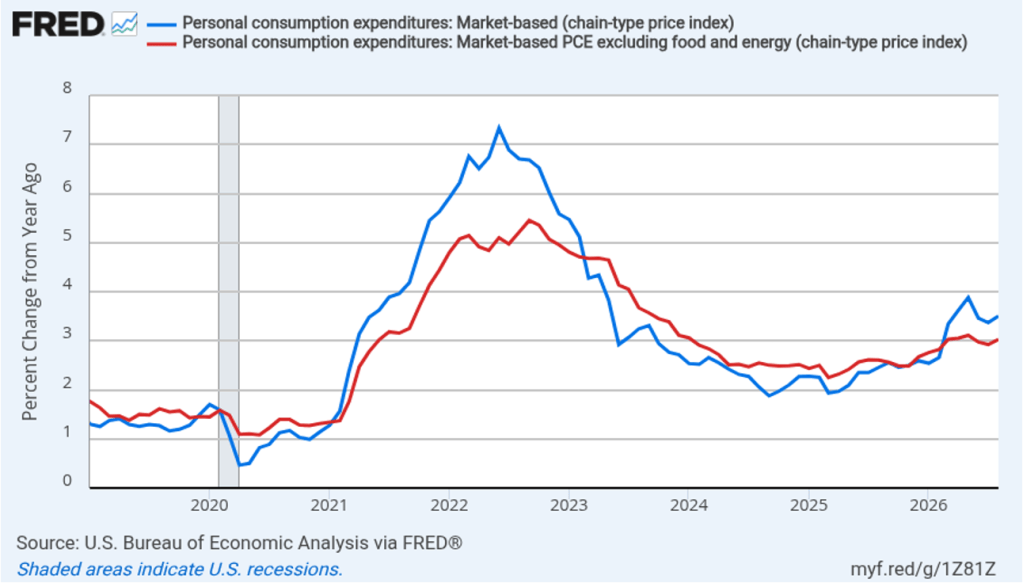
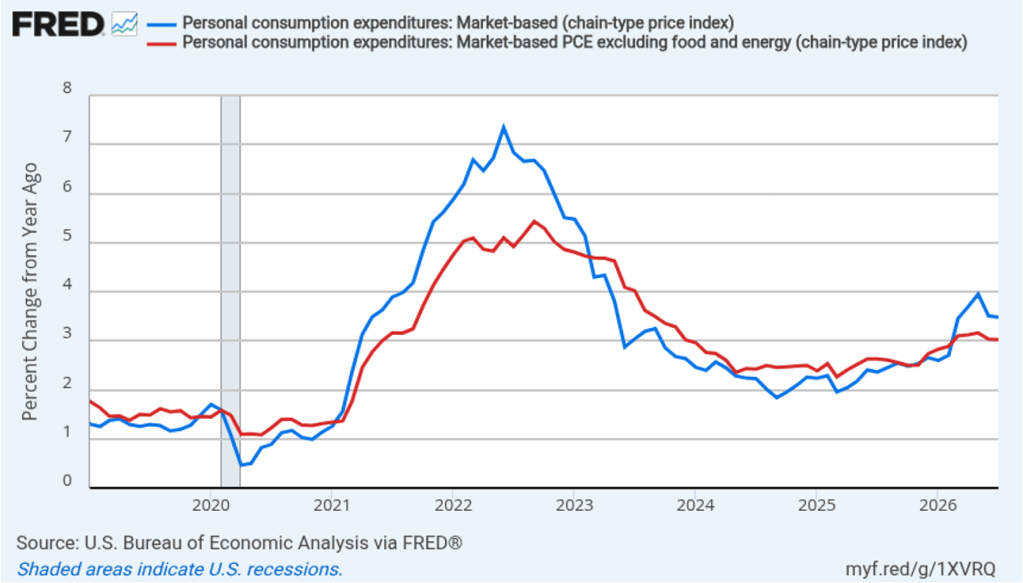
Former Fed Chair Jerome Powell frequently mentioned that inflation in non-market services can skew PCE inflation. Non-market services are services whose prices the BEA imputes rather than measures directly. For instance, the BEA assumes that prices of financial services—such as brokerage fees—vary with the prices of financial assets. So that if stock prices rise, the prices of financial services included in the PCE price index also rise. Powell has argued that these imputed prices “don’t really tell us much about … tightness in the economy. They don’t really reflect that.” The following figure shows 12-month headline inflation (the blue line) and 12-month core inflation (the red line) for market-based PCE. (The BEA explains the market-based PCE measure here.)

Headline market-based PCE inflation was 3.9 percent in May, up from 3.7 percent in April. Core market-based PCE inflation was 3.2 percent in May, up slightly from 3.1 percent in April. So, both market-based measures, although lower than the full PCE measures, show inflation in May remaining well above the Fed’s 2 percent target.

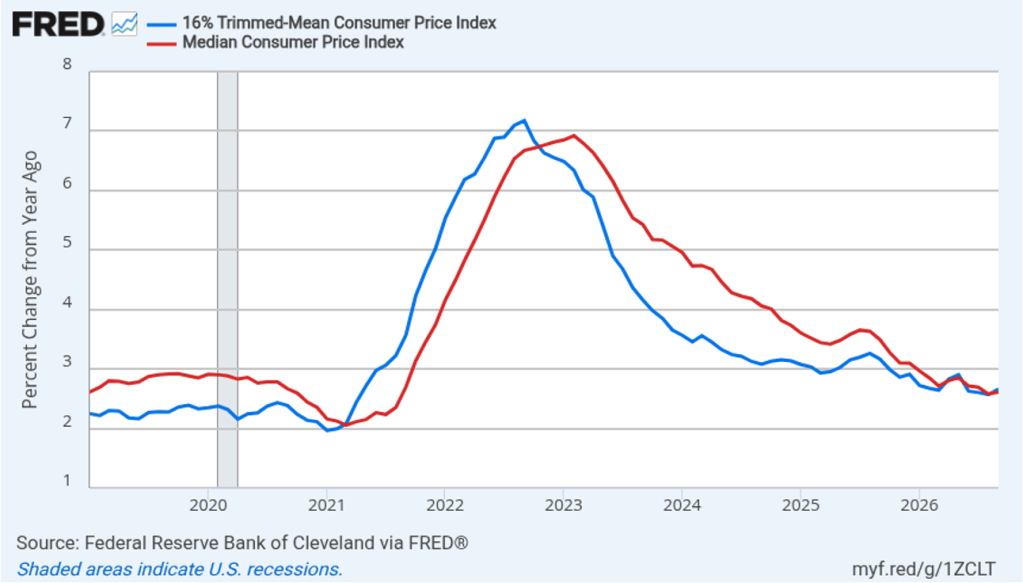
New Fed Chair Kevin Warsh argued in testimony before the Senate that the Fed should stop relying on headline PCE inflation: “The measures [of inflation] I prefer are looking at things that are called trimmed averages. We take out all of the tail-risks, all of the one-off items, and we ask ourselves whether the generalized change in prices is having second-order effects on the economy.” 

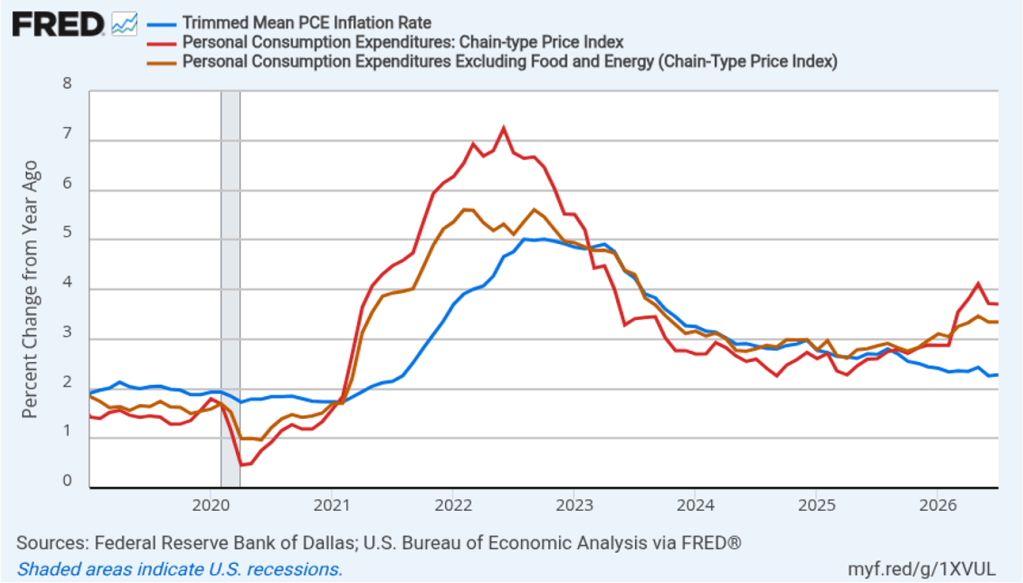
Trimmed-mean PCE inflation drops the 31 percent of goods and services with the highest inflation rates and the 24 percent of goods and services with the lowest inflation rates. A closely related measure, median PCE inflation, is calculated by listing the inflation rate in each individual good or service included in the PCE and identifying the inflation rate of the good or service that is in the middle of the list—that is, the inflation rate in the price of the good or service that has an equal number of higher and lower inflation rates. 

The following figure shows headline PCE inflation the (blue line), core PCE inflation (the red line) and trimmed-mean PCE inflation (the brown line). Trimmed-mean PCE inflation in May was 2.4 percent, well below both headline and core PCE inflation.

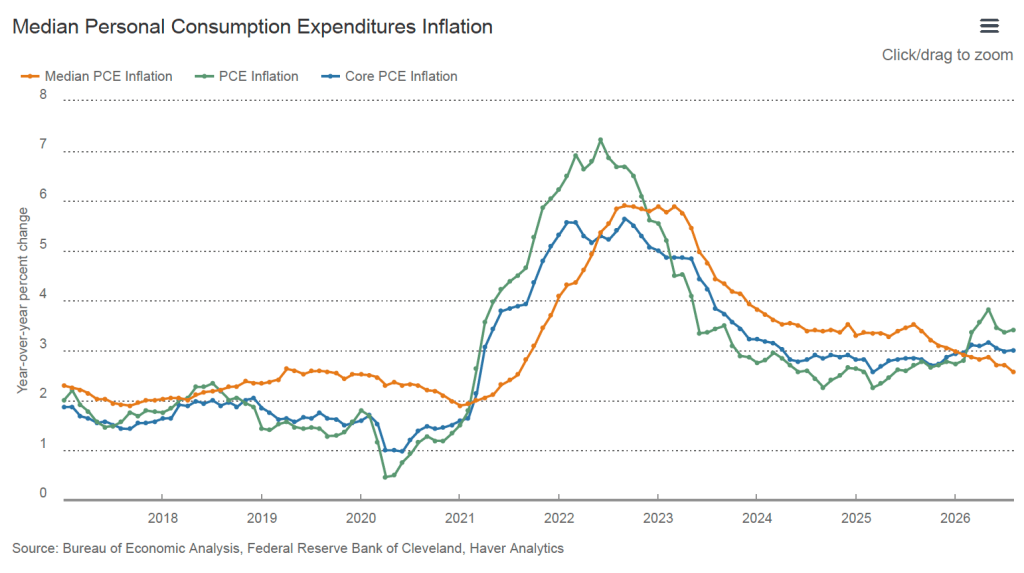
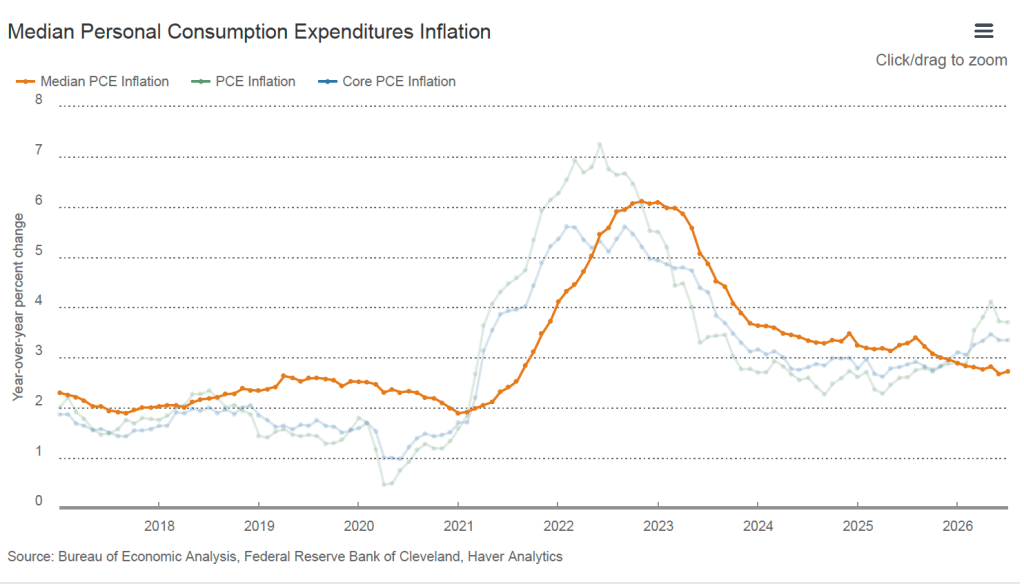
The following figure from the web site of the Federal Reserve Bank of Cleveland shows headline PCE inflation (the green line), core PCE inflation (the blue line), and median PCE inflation (the brown line). In May, median PCE inflation was 2.8 percent, also below both headline and core inflation. So Warsh has a point that these two measures of inflation, which are less affected by particularly high or low rates of inflation in some goods and services, indicate that inflation has been running below the Fed’s currently preferred measure. But these measures also show inflation still running well above the Fed’s 2 percent annual inflation target.

Today’s macro data have had little effect on investors who buy and sell federal funds futures contracts. These investors still expect that the Federal Open Market Committee (FOMC) will leave its target for the federal funds rate unchanged at its meeting on July 28–29 but will raise the target by 0.25 percentage point at its September 15–16 meeting.

FOMC Holds Target Rate Constant as Warsh Promises Procedural Changes after First Meeting as Chair

Photo of Kevin Warsh from bloomberg.com via the Wall Street Journal

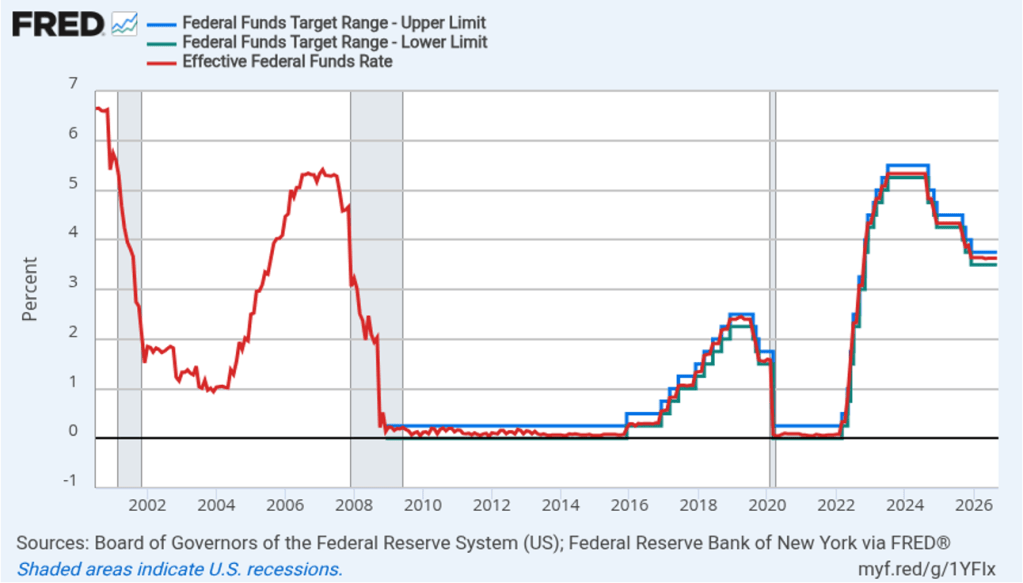
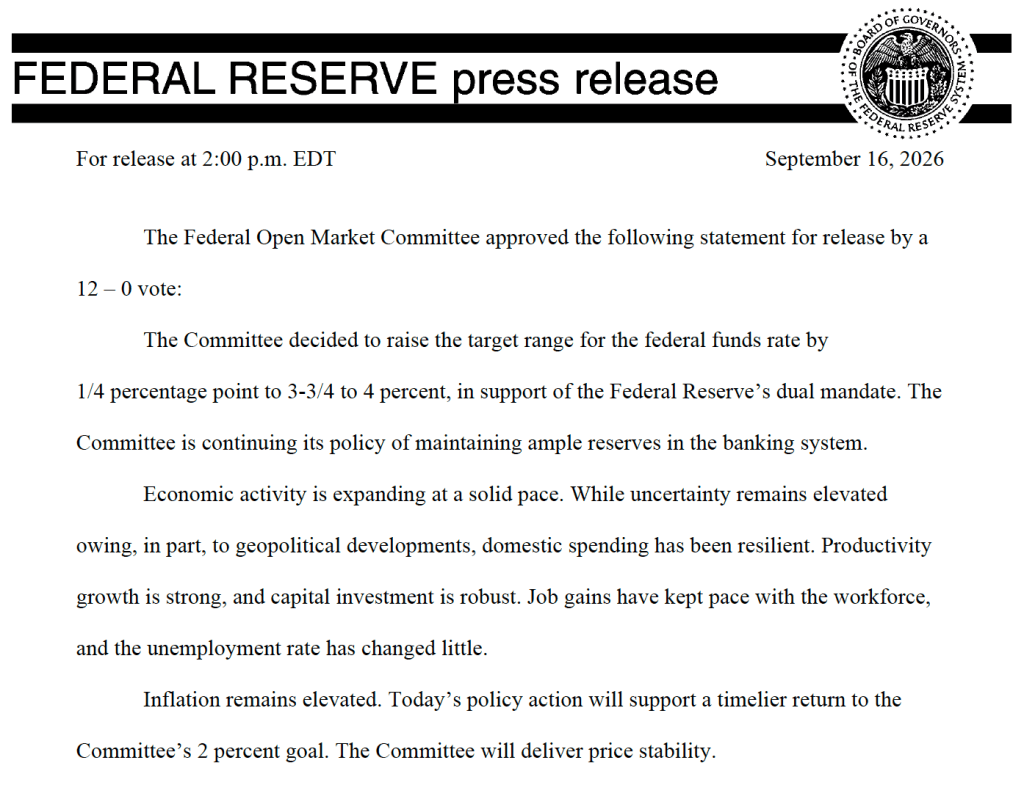
It was a foregone conclusion that at its meeting that ended today, the Federal Open Market Committee (FOMC) would leave unchanged its target range for the federal funds rate at 3.50 percent to 3.75 percent. There was great interest, however, about whether at his first meeting as chair of the committee, Kevin Warsh might indicate changes he would push for in the committee’s procedures.

One immediate change was evident in the statement that the committee released at the end of its meeting. The first statement reproduced below is from April 29, the last meeting Jerome Powell presided over as chair. The second statement is the statement that the committee released today.

The statement released today is much shorter and omits any mention of how the committee might respond in the future to new economic data, other than the simple statement that, “The Committee will deliver price stability.”

The brevity of the statement reflects the skepticism Warsh had voiced in his Senate confirmation hearings on the usefulness of forward guidance, or statements by the FOMC about how it will conduct monetary policy in the future. We discuss forward guidance in Macroeconomics, Chapter 15 (Economics, Chapter 25).

In his press conference following the meeting, Warsh announced that he was forming five new committees to look at: 1) Fed communications, 2) the Fed’s balance sheet, 3) the Fed’s use of data, 4) the effects of technological change and productivity, particularly with respect to artificial intelligence, and 5) the inflation process, with the aim of identifying key drivers of inflation. He indicated that the committees would include members from outside the Fed and were expected to report their findings by the end of the year.

After the meeting, the committee also released a “Summary of Economic Projections” (SEP)—as it typically does after its March, June, September, and December meetings. The SEP presents median values of the, typically, 19 committee members’ forecasts of key economic variables. Notably, Warsh indicated that, although he encouraged his colleagues on the committee to continue submitting their forecasts to be compiled in the SEP, he didn’t submit forecasts. He indicated that the future of the SEP is one of the issues to be considered by his new committee on Fed communications.

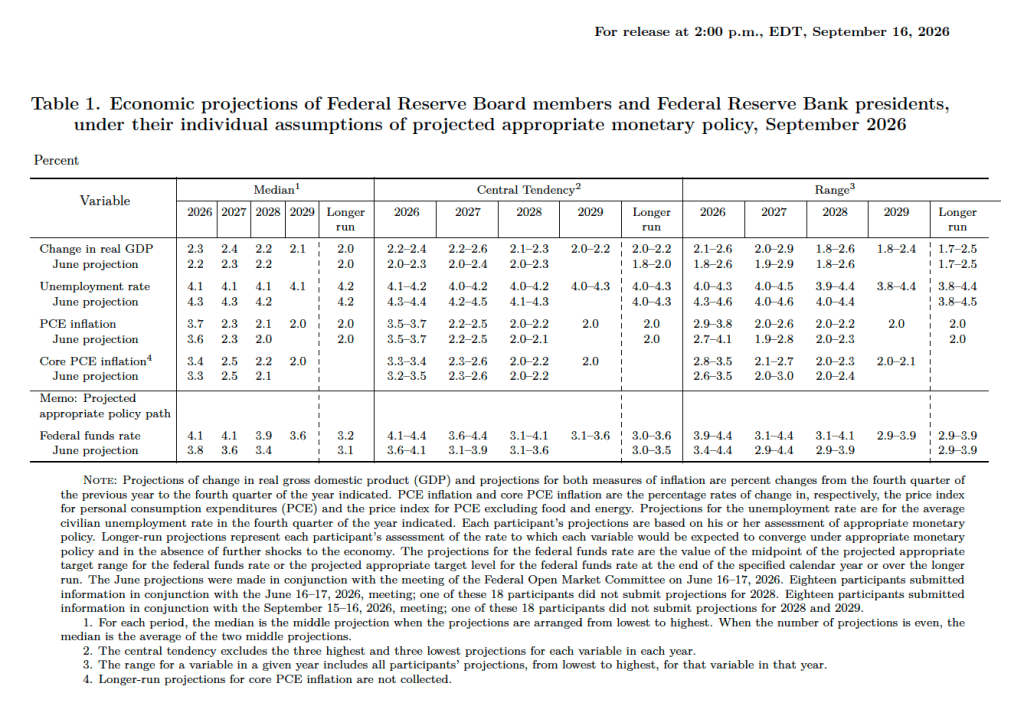
The forecasts of key economic variables from the SEP are summarized in the following table, reproduced from the release. (Note that only 5 of the district bank presidents vote at FOMC meetings, although all 12 presidents participate in the discussions and prepare forecasts for the SEP.)

There are several aspects of these forecasts worth noting:

  1. Compared with the previous SEP in March, the committee members reduced their forecast of real GDP growth in 2026 from 2.4 percent to 2.2 percent. The committee members left unchanged their forecast of long-run growth in real GDP at 2.0 percent. Despite reducing their forecast of real GDP growth in 2026, the committee lowered their forecast of the unemployment rate in 2026 from 4.4 percent to 4.3 percent. The committee members left their forecast of the long-run rate of unemployment, often called the natural rate of unemployment, unchanged at 4.2 percent. 
  2. Committee members significantly raised their forecast of personal consumption expenditures (PCE) price inflation in 2026 to 3.6 percent from 2.7 percent in March. They raised their forecast of inflation in 2027 slightly and continued to forecast that PCE inflation will decline to the Fed’s 2.0 percent annual target in 2028.
  3. The committee’s forecasts of the federal funds rate at the end of each year from 2026 through 2028 were increased, indicating that the committee sees the federal funds rate as likely to be “higher for longer.” The forecast for the long-run federal funds rate was left unchanged at 3.1 percent.

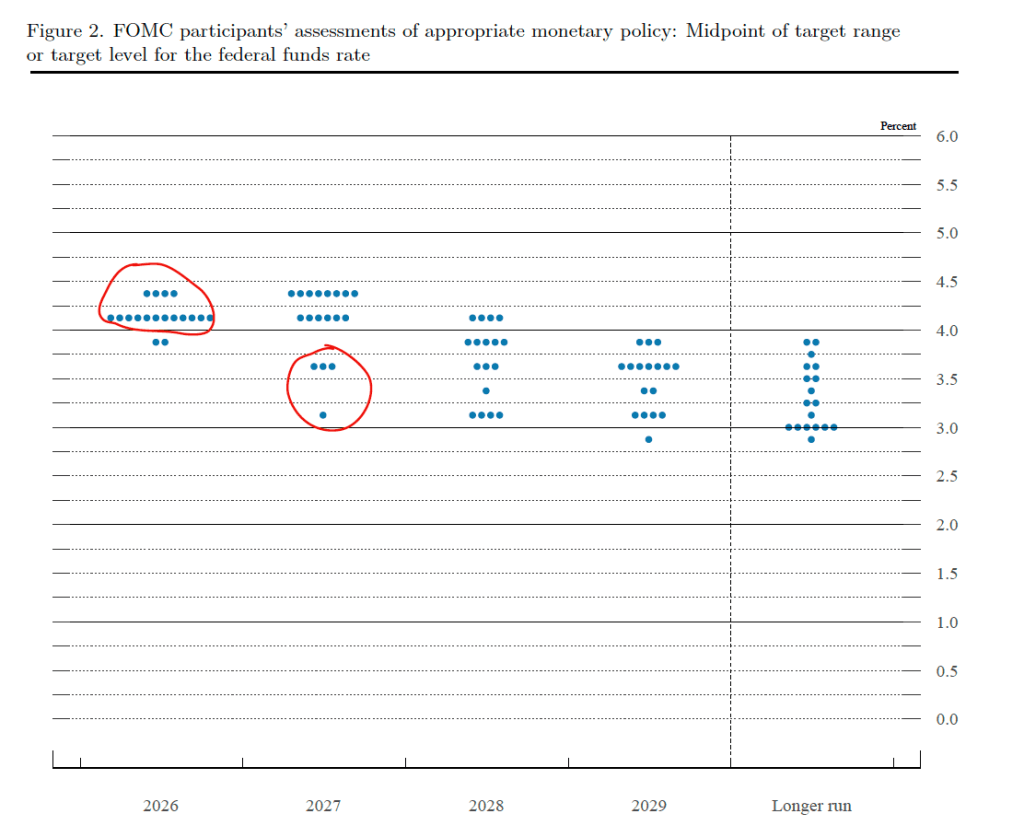
Prior to the meeting, there was much discussion in the business press and among investment analysts about the dot plot, shown below. Each dot in the plot represents the projection of an individual committee member. (The committee doesn’t disclose which member is associated with which dot.) Note that there are 18 dots, representing the 6 members of the Fed’s Board of Governors who provided forecasts and all 12 presidents of the Fed’s district banks. 

The dots plotted on the far left of the figure represent the projections by the 18 members of the value of the federal funds rate at the end of 2026. The plots indicate that at this point eight members of the committee forecast no change in the federal funds rate this year, nine members (circled in red) expect at least one increase in the federal funds rate by the end of the year, and only one member expected that there would be a cut in the federal funds by year’s end. The dots plotted on the far right of the figure indicate that there is substantial disagreement among committee members as to what the long-run value of the federal funds rate—the so-called neutral rate—should be. Of course, the plots only represent the forecasts of the committee members and individual committee members are likely to adjust their forecasts as additional macroeconomic data become available in the coming months.

Warsh indicated at his press conference that it was unlikely that he would hold a press conference after each meeting of the committee as Jerome Powell had been doing beginning with the January 2019 meeting.

Warsh made several other notable points at the press conference. He reiterated that the Fed’s inflation target would remain an annual increase of 2.0 percent in the PCE. He noted that he saw the current level of the federal funds rate as having a restrictive effect on only the housing market. And he expressed dissatisfaction with how the economic statistics the FOMC relies upon when setting policy were being compiled. He indicated that the new committee on the Fed’s use of data might formulate suggestions to other federal government agencies, such as the Bureau of Economic Analysis and the Bureau of Labor Statistics, on changes in how they collect data.

CPI Inflation Highest Since 2023, but Slightly Below Expectations

Image generated by ChatGPT

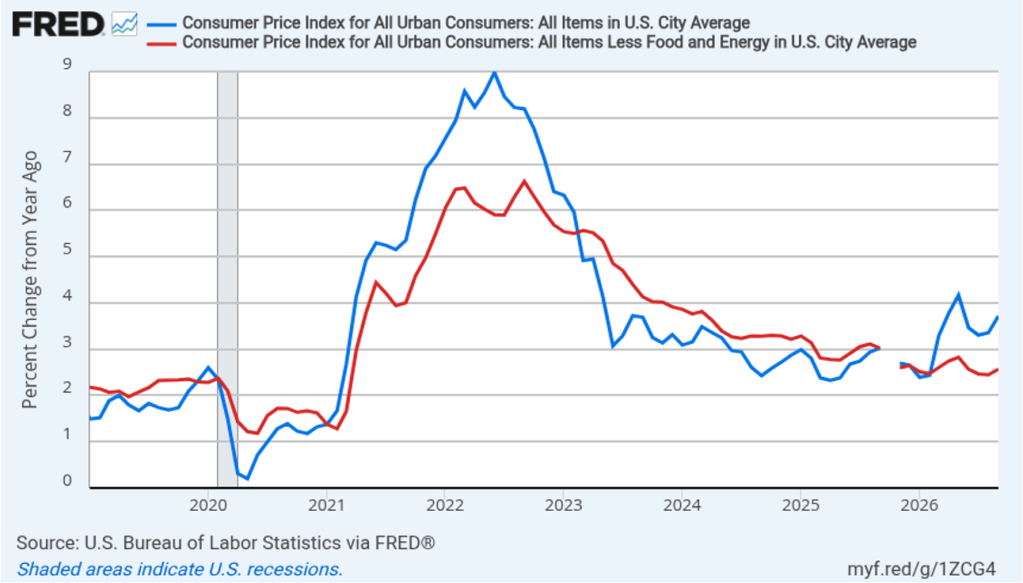
Today (June 10), the Bureau of Labor Statistics (BLS) released its report on the consumer price index (CPI) for May. As expected, higher energy prices caused by the conflict in Iran have continued to result in high rates of inflation. The following figure compares headline CPI inflation (the blue line) and core CPI inflation (the red line).

  • The headline inflation rate, which is measured by the percentage change in the CPI from the same month in the previous year, was 4.2 percent in May, up from 3.8 in April. This was the highest inflation rate since April 2023.
  • The core inflation rate, which excludes the prices of food and energy, ticked up only slightly to 2.8 percent in May from 2.7 percent in April. 
Headline inflation was equal to and core inflation was slightly lower than economists surveyed by FactSet had forecast. (Note that because of last year’s federal government shutdown, inflation data for October and November 2025 are not available.)

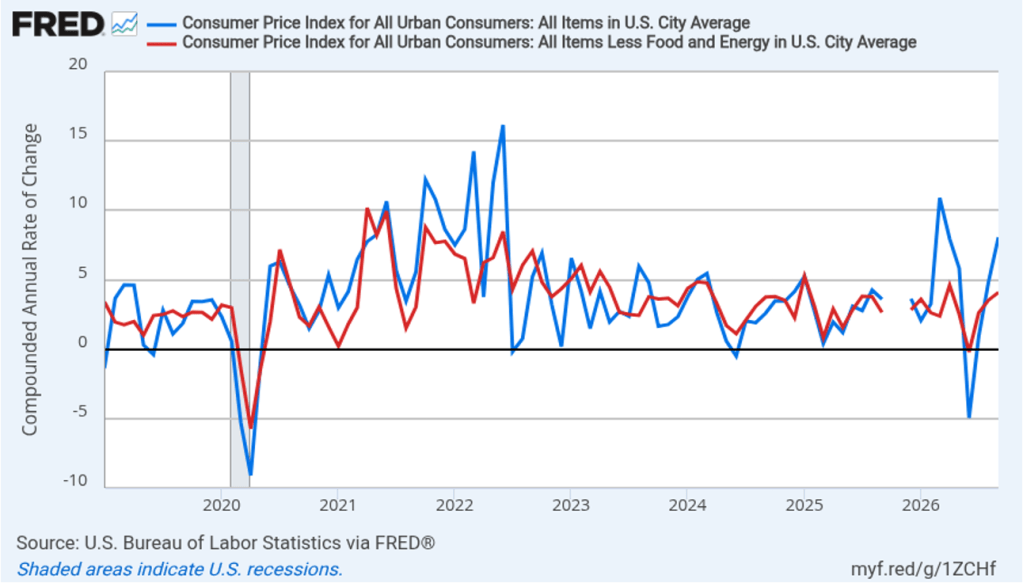
In the following figure, we look at the 1-month inflation rate for headline and core inflation—that is the annual inflation rate calculated by compounding the current month’s rate over an entire year. Calculated as the 1-month inflation rate, headline inflation (the blue line) was high at 5.8 percent in May, but down from a very high 8.0 percent in April and 10.9 percent in March. Core inflation (the red line) was 2.5 percent in May, down significantly from 4.6 percent in April.

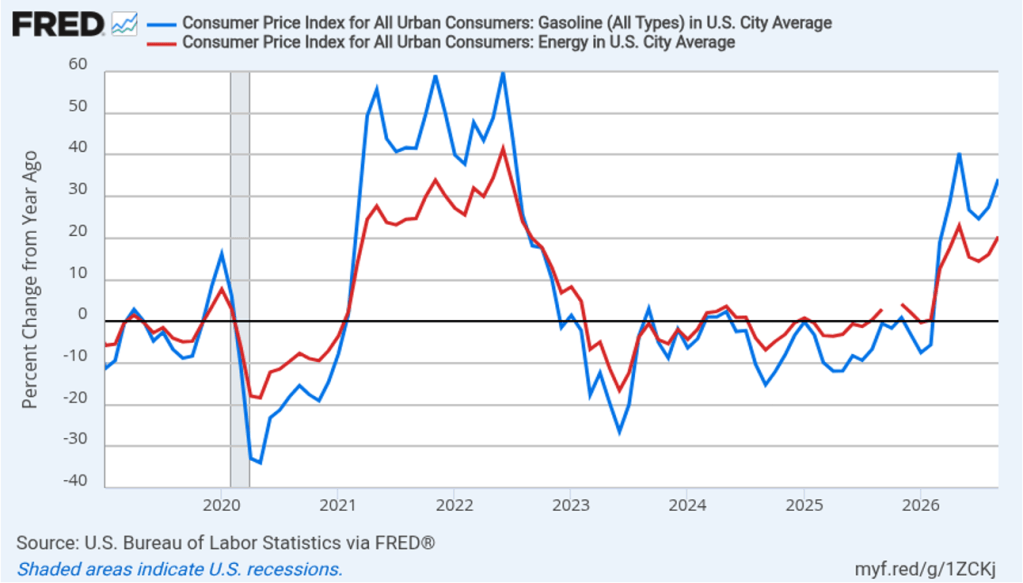
The following figure emphasizes the role played by energy prices in causing the jump in inflation. The blue line shows the 1-month inflation rate in all energy prices included in the CPI. Inflation in energy prices increased from a very high 56.6 percent in April to a slightly higher 58.8 percent in May. The red line shows the 1-month inflation rate in gasoline prices, which rose from a very high 88.8 percent in April to an even higher 126.4 percent in May.

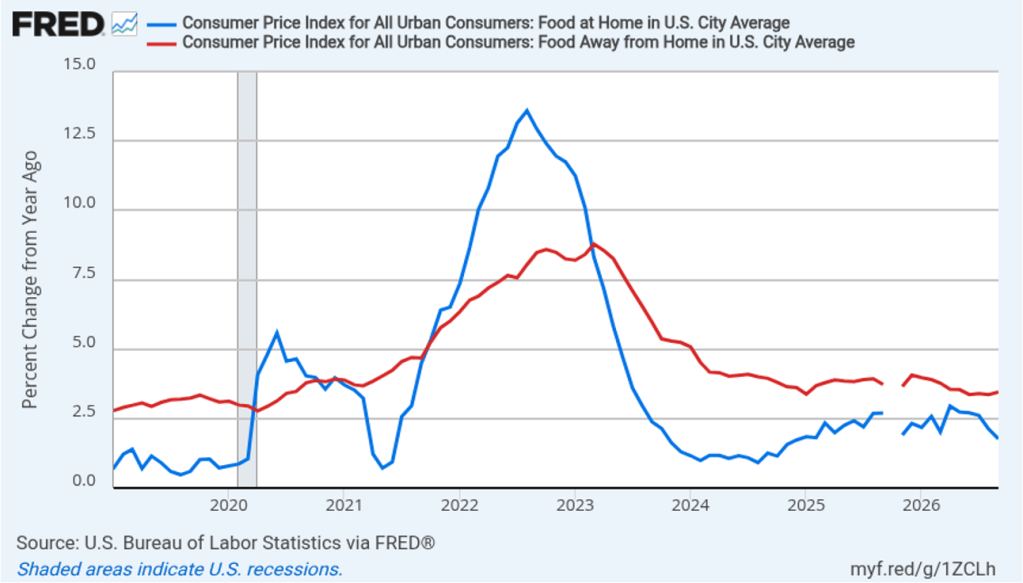
Did the jump in energy prices pass through to increases in food prices, which are a key concern for many consumers? The following figure shows 1-month inflation in the CPI category “food at home” (the blue bar)—primarily food purchased at grocery stores—and the category “food away from home” (the red bar)—primarily food purchased at restaurants. Inflation in grocery prices slowed markedly to 0.8 percent in May from 8.5 percent in April. Inflation in food prices away from home was 3.7 percent in May, up from 2.8 percent in April. April’s very high rate of increase in grocery prices was due to rising energy prices, but also to sharp increases in beef and fruit and vegetable prices, which had risen for reasons largely unrelated to higher energy costs. Consumers enjoyed some relief in May from the sharp decrease in the rate of increase in grocery prices.

This inflation report is unlikely to have much effect on Fed policymakers as they prepare for the next meeting of the Federal Open Market Committee (FOMC) on June 16–17—Kevin Warsh’s first meeting as Fed chair. Persistently high inflation rates combined with relatively strong data on economic growth and employment make it more likely that the FOMC will increase, rather than cut, its target for the federal funds rate later in the year.

At this point, trading in the federal funds futures market indicates that investors believe that its unlikely that the committee will raise or lower its target for the federal funds rate at its June, July, or September meetings. This morning, investors assigned a 48.6 percent probability of the FOMC raising its target for the federal funds rate at its October 27–28 meeting and a 66.2 percent of doing so at its meeting on December 8–9.

Surprisingly Strong Jobs Report

Image generated by ChatGPT

This morning (June 5), the Bureau of Labor Statistics (BLS) released its “Employment Situation” report (often called the “jobs report”) for May. The report showed a stronger than expected increase in employment. 

The jobs report has two estimates of the change in employment during the month: one estimate from the establishment survey, often referred to as the payroll survey, and one from the household survey. As we discuss in Macroeconomics, Chapter 9, Section 9.1 (Economics, Chapter 19, Section 19.1), many economists and Federal Reserve policymakers believe that employment data from the establishment survey provide a more accurate indicator of the state of the labor market than do the household survey’s employment and unemployment data. (The groups included in the employment estimates from the two surveys are somewhat different, as we discuss in this post.)

According to the establishment survey, there was a net increase of 172,000 nonfarm jobs during May. Economists surveyed by the Wall Street Journal had forecast an increase of only 80,000 jobs.  Economists surveyed by Bloomberg had a slightly higher forecast of a net increase of 88,000 jobs. The BLS revised upward its previous estimates of employment in March and April by a combined 93,000 jobs. (The BLS notes that: “Monthly revisions result from additional reports received from businesses and government agencies since the last published estimates and from the recalculation of seasonal factors.”)

The following figure from the jobs report shows the net change in nonfarm payroll employment for each month in the last two years. The figure shows that the relatively strong employment increases of the past three months represent a break from the unusual pattern in that began in the middle of 2025 in which months of declining employment and months of increasing employment had been alternating.

These increased employment gains are not consistent with an increasingly popular view among economists that slowing labor force growth had resulted in the break-even rate of employment growth—the rate of employment growth at which the unemployment rate remains constant—having fallen to close to zero.

In fact, despite the strong increase in employment, the unemployment rate, which is calculated from data in the household survey, was unchanged in May at 4.3 percent. As the following figure shows, the unemployment rate has been remarkably stable over the past year and a half, staying between 4.0 percent and 4.4 percent in each month since May 2024. The Federal Open Market Committee’s current estimate of the natural rate of unemployment—the normal rate of unemployment over the long run—is 4.2 percent. So, unemployment is slightly above that estimate of the natural rate. (We discuss the natural rate of unemployment in Macroeconomics, Chapter 9 and Economics, Chapter 19.)

As the following figure shows, the monthly net change in jobs from the household survey moves much more erratically than does the net change in jobs from the establishment survey. As measured by the household survey, there was a net increase of 149,000 jobs in May, roughly similar to the increase in the establishment survey. But the household survey shows an overall decline in jobs during the past five months, in contrast to the net increase in jobs shown in the establishment survey. (Note that because of last year’s shutdown of the federal government, there are no data for October or November.) It’s not unusual for the two surveys to show significantly different movements in net job creation, particularly over short periods of time.

The household survey has another important labor market indicator: the employment-population ratio for prime age workers—those workers aged 25 to 54. In May the ratio was 80.8 percent, up slightly from 80.7 percent in April. The prime-age population ratio remains above its value for most of the period since 2001. The persistently high levels of the prime-age employment-population ratio indicate continuing strength in the labor market.

There have been media reports of firms, including Salesforce, Cloudflare, Coinbase, Cisco Systems, and Meta Platforms, laying off workers in information systems. The following figure shows net employment changes in the BLS employment category of “computing infrastructure providers, data processing, web hosting, and related services.” Employment in this sector has been declining during most months since the beginning of 2023, but May was an exception with a net increase of 3,700 jobs.

The establishment survey also includes data on average hourly earnings (AHE). As we noted in this post, many economists and policymakers believe the employment cost index (ECI) is a better measure of wage pressures in the economy than is the AHE. The AHE does have the important advantage of being available monthly, whereas the ECI is only available quarterly. The following figure shows the percentage change in the AHE from the same month in the previous year. The AHE increased 3.4 percent in May, down from 3.6 percent in April.

What effect is this jobs report likely to have on the decisions of the Federal Reserve’s policymaking Federal Open Market Committee (FOMC) at its next meeting on June 16–17, the first meeting with Kevin Warsh as chair? The relatively strong growth in employment during the past three months make it unlikely that the FOMC will see current conditions in the job market as warranting a cut in the committee’s target range for the federal funds rate. In addition, disruptions to the world oil market as a result of the conflict in Iran have caused oil prices to rise, putting upward pressure on the price level. The effects of tariff increases have likely not yet fully passed through to increases in prices. These factors make it likely that the committee will keep its target range for the federal funds rate unchanged at its next meeting and may even begin considering future increases in the target range. 

The probability that investors in the federal funds futures market assign to the FOMC keeping its target rate unchanged at its June meeting increased to 97.2 percent this morning from 95.4 percent yesterday. Investors now assign a higher probability to a rate increase by the end of the year than to a rate cut.

New BEA Releases Show Slower Growth and High Inflation

Image created by ChatGPT

The Bureau of Economic Analysis (BEA) released two reports this morning (May 28): “GDP (Second Estimate) and Corporate Profits, 1st Quarter 2026” and “Personal Income and Outlays, April 2026.” The BEA revised downward its estimate of real GDP growth in the first quarter of 2026 from an annual rate of 2.0 percent to an annual rate of 1.6 percent. Economists surveyed by the Wall Street Journal had expected that the BEA would leave its estimate of real GDP growth in the first quarter unchanged. The following figure shows the BEA’s estimated rates of GDP growth in each quarter beginning with the first quarter of 2022.

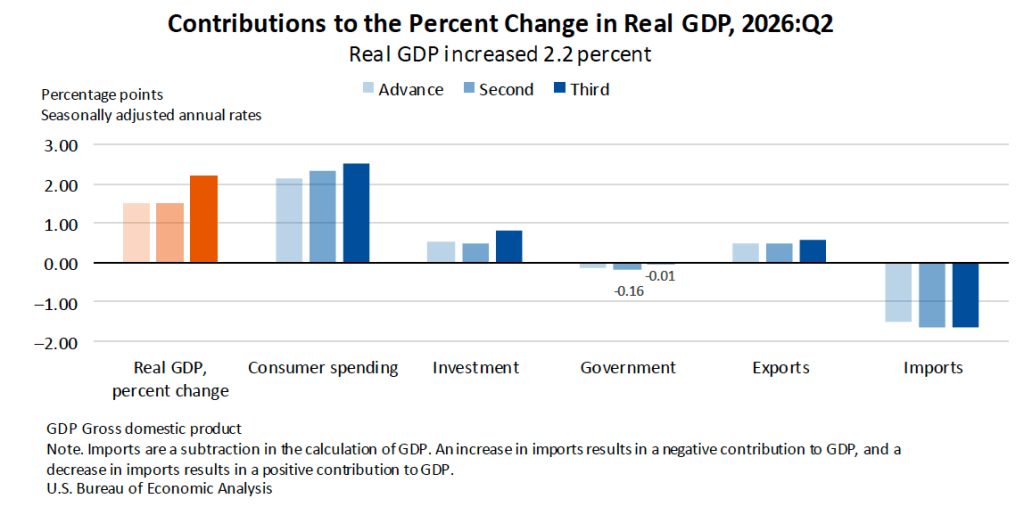
The following figure—taken from the BEA report—shows the contributions of each component of spending to the BEA’s downward revision of its estimate of GDP growth. The growth of both consumption spending and investment spending, which are the largest component of GDP, were revised downward. The downward revision in consumption spending reflects lower spending on services and the downward revision in investment spending reflects lower business spending on inventories.

As we’ve discussed in previous blog posts, to better gauge the state of the economy, policymakers—including former Fed Chair Jerome Powell—often prefer to strip out the effects of imports, inventory investment, and government expenditures—which can be volatile—by looking at real final sales to private domestic purchasers, which includes only spending by U.S. households and firms on domestic production. As the following figure shows, real final sales to domestic purchasers increased at an annual rate of 2.4 percent in the first quarter, which was well above the 1.6 percent rate of increase in real GDP and also above the U.S. economy’s expected long-run annual real growth rate of 1.8 percent. Note also that real final sales to private domestic purchasers grew by 2.9 percent in the third quarter of 2025, during which real GDP grew by 4.4 percent, and by 1.9 percent in the first quarter of 2025, when real GDP declined by 0.6 percent. So this measure of output is more stable and likely is a better indicator of the underlying growth rate in the economy than is the growth rate of real GDP.

The BEA’s “Personal Income and Outlays” report this morning included monthly data on the personal consumption expenditures (PCE) price index. The Fed relies on annual changes in the PCE price index to evaluate whether it’s meeting its 2 percent annual inflation target. The following figure shows headline PCE inflation (the blue line) and core PCE inflation (the red line)—which excludes energy and food prices—for the period since January 2019, with inflation measured as the percentage change in the PCE from the same month in the previous year. In April, headline PCE inflation was 3.8 percent, up from 3.5 percent in March. Core PCE inflation in April was 3.3 percent, up slightly from 3.2 percent in March. Headline PCE inflation was slightly below and core PCE inflation was equal to the forecasts of economists surveyed by FactSet. Both headline PCE inflation and core PCE inflation remain well above the Fed’s 2 percent annual inflation target.

The following figure shows monthly PCE inflation and monthly core PCE inflation calculated by compounding the current month’s rate over an entire year. (Often referred to as 1-month inflation.) Measured this way, headline PCE inflation fell from the very high rate of 8.9 percent in March to a still high rate of 4.9 percent in April. Core PCE inflation declined from 3.6 in March to 2.9 percent in April. Even leaving aside the effect of rising gasoline prices on headline PCE, these data show that in March both core and headline PCE inflation were well above the Fed’s target.

Former Fed Chair Jerome Powell frequently mentioned that inflation in non-market services can skew PCE inflation. Non-market services are services whose prices the BEA imputes rather than measures directly. For instance, the BEA assumes that prices of financial services—such as brokerage fees—vary with the prices of financial assets. So that if stock prices rise, the prices of financial services included in the PCE price index also rise. Powell has argued that these imputed prices “don’t really tell us much about … tightness in the economy. They don’t really reflect that.” The following figure shows 12-month headline inflation (the blue line) and 12-month core inflation (the red line) for market-based PCE. (The BEA explains the market-based PCE measure here.)

Headline market-based PCE inflation was 3.7 percent in April, up from 3.4 percent in March. Core market-based PCE inflation was 3.1 percent in April, unchanged from March. So, both market-based measures, although lower than the full PCE measures, show inflation in April remaining well above the Fed’s 2 percent target.

New Fed Chair Kevin Warsh argued in testimony before the Senate that the Fed should stop relying on headline PCE inflation: “The measures [of inflation] I prefer are looking at things that are called trimmed averages. We take out all of the tail-risks, all of the one-off items, and we ask ourselves whether the generalized change in prices is having second-order effects on the economy.”

Trimmed-mean PCE inflation drops the 31 percent of goods and services with the highest inflation rates and the 24 percent of goods and services with the lowest inflation rates. A closely related measure, median PCE inflation, is calculated by listing the inflation rate in each individual good or service included in the PCE and identifying the inflation rate of the good or service that is in the middle of the list—that is, the inflation rate in the price of the good or service that has an equal number of higher and lower inflation rates. 

The following figure shows headline PCE inflation the (blue line), core PCE inflation (the brown line) and trimmed-mean PCE inflation (the red line). Trimmed-mean PCE inflation in April was 2.4 percent, well below both headline and core PCE inflation.

The following figure from the web site of the Federal Reserve Bank of Cleveland shows headline PCE inflation (the green line), core PCE inflation (the blue line), and median PCE inflation (the brown line). In April, median PCE inflation was 2.8 percent, also below both headline and core inflation. So Warsh has a point that these two measures of inflation, which are less affected by particularly high or low rates of inflation in some goods and services, indicate that inflation has been running below the Fed’s currently preferred measure. But these measures also show inflation running well above the Fed’s 2 percent annual inflation target.

Today’s macro data have had little effect on investors who buy and sell federal funds futures contracts. For some time, investors have seen little likelihood that the Fed’s policymaking Federal Open Market Committee would cut its target for the federal funds rate until sometime next year. These investors see it as far more likely that the committee will raise its target by the end of the year than that it will cut it.

CPI Inflation Worsens, As Expected

Image generated by ChatGPT

Today (May 12), the Bureau of Labor Statistics (BLS) released its report on the consumer price index (CPI) for April. As expected, higher energy prices resulting from the conflict in Iran led to a jump in inflation. The following figure compares headline CPI inflation (the blue line) and core CPI inflation (the red line).

  • The headline inflation rate, which is measured by the percentage change in the CPI from the same month in the previous year, was 3.8 percent in April, up from 3.3 in March. This was the highest inflation rate since May 2023.
  • The core inflation rate, which excludes the prices of food and energy, was 2.7 percent in April, up slightly from 2.6 percent in March. 

Headline inflation and core inflation were both slightly higher than economists surveyed by the Wall Street Journal had expected.

In the following figure, we look at the 1-month inflation rate for headline and core inflation—that is the annual inflation rate calculated by compounding the current month’s rate over an entire year. Calculated as the 1-month inflation rate, headline inflation (the blue line) was a very high 8.0 percent in April, which was actually down from 10.9 percent in March. Core inflation (the red line) was 4.6 percent in April, up from 2.4 percent in March.

The following figure emphasizes the role played by energy prices in causing the jump in inflation. The blue line shows the 1-month inflation rate in all energy prices included in the CPI. Inflation in energy prices declined from a very high 245.1 percent in March to a still high 56.6 percent in April. The red line shows the 1-month inflation rate in gasoline prices, which declined from an astounding 907.4 percent in March to a still very painful 88.8 percent in April.

Did the jump in energy prices pass through to increases in food prices, which are a key concern for many consumers? The following figure shows 1-month inflation in the CPI category “food at home” (the blue bar)—primarily food purchased at grocery stores—and the category “food away from home” (the red bar)—primarily food purchased at restaurants. Inflation in grocery prices rose 8.5 percent in April after declining in March. Inflation in food prices away from home was 2.8 percent in April, down from 2.9 percent in March. The high rate of increase in grocery prices was due to rising energy prices, as well as to sharp increases in beef and fruit and vegetable prices, which rose for reasons largely unrelated to higher energy costs.  

What effect is this inflation report likely to have on the Fed’s policymaking Federal Open Market Committee (FOMC) at its next meeting on June 16–17—Kevin Warsh’s first meeting as Fed chair? Earlier this year, some market analysts believed that replacing Jerome Powell as chair with Warsh would increase the probability of the FOMC cutting its target for the federal funds rate this year. But the acceleration in inflation during the past two months, even if it proves to be temporary, and relatively strong data on economic growth and employment make it unlikely that Warsh will push for a rate cut any time soon. At this point, trading by investors in the federal funds futures market favors the FOMC neither raising nor lowering its federal funds rate target during the remainder of this year.

Surprisingly Strong Jobs Report

Image generated by ChatGPT

This morning (May 8), the Bureau of Labor Statistics (BLS) released its “Employment Situation” report (often called the “jobs report”) for April. The report showed a stronger than expected increase in employment. 

The jobs report has two estimates of the change in employment during the month: one estimate from the establishment survey, often referred to as the payroll survey, and one from the household survey. As we discuss in Macroeconomics, Chapter 9, Section 9.1 (Economics, Chapter 19, Section 19.1), many economists and Federal Reserve policymakers believe that employment data from the establishment survey provide a more accurate indicator of the state of the labor market than do the household survey’s employment and unemployment data. (The groups included in the employment estimates from the two surveys are somewhat different, as we discuss in this post.)

According to the establishment survey, there was a net increase of 115,000 nonfarm jobs during April. Economists surveyed by the Wall Street Journal had forecast an increase of only 55,000 jobs.  Economists surveyed by Bloomberg had a slightly higher forecast of a net increase of 62,000 jobs. The BLS revised downward its previous estimates of employment in February and March by a combined 16,000 jobs. (The BLS notes that: “Monthly revisions result from additional reports received from businesses and government agencies since the last published estimates and from the recalculation of seasonal factors.”)

The following figure from the jobs report shows the net change in nonfarm payroll employment for each month in the last two years. The figure shows an unusual pattern in the job market since the middle of 2025 in which months of declining employment and months of increasing employment have been alternating. March and April of 2026 are the first back-to-back months of increasing net employment since March and April of 2025.

These fluctuations of net employment gains around roughly zero are consistent with a recent analysis from economists at the Federal Reserve Bank of Dallas that estimates the break-even rate of employment growth—the rate of employment growth at which the unemployment rate remains constant. They note that “continued net outflows of unauthorized immigrants, together with shifts in labor force participation, have pushed the monthly break-even employment growth lower than previously thought.” They conclude that: “The break-even rate [of employment growth] peaked at about 250,000 jobs per month in 2023, fell to roughly 10,000 by July 2025, and declined to near zero thereafter, averaging about –3,000 jobs per month from August to December 2025, indicating, if anything, a modest net jobs loss over this period.” In other words, in the current labor market, the break-even rate of employment growth may actually be negative.

The unemployment rate, which is calculated from data in the household survey, was 4.3 percent in April, unchanged from March. As the following figure shows, the unemployment rate has been remarkably stable over the past year and a half, staying between 4.0 percent and 4.4 percent in each month since May 2024. The Federal Open Market Committee’s current estimate of the natural rate of unemployment—the normal rate of unemployment over the long run—is 4.2 percent. So, unemployment is slightly above that estimate of the natural rate. (We discuss the natural rate of unemployment in Macroeconomics, Chapter 9 and Economics, Chapter 19.)

As the following figure shows, the monthly net change in jobs from the household survey moves much more erratically than does the net change in jobs from the establishment survey. As measured by the household survey, there was a net decrease of 226,000 in April, the fourth consecutive month of decreases. (Note that because of last year’s shutdown of the federal government, there are no data for October or November.) In any particular month, the story told by the two surveys can be inconsistent. In this case, the establishment survey shows a strong increase in net employment, while the household survey shows a decline.

The household survey has another important labor market indicator: the employment-population ratio for prime age workers—those workers aged 25 to 54. In April the ratio was 80.7 percent, the same as in February and March. The prime-age population ratio remains above its value for most of the period since 2001. The continued high levels of the prime-age employment-population ratio indicate continuing strength in the labor market.

There have been media reports of firms, including Salesforce, Cloudflare, Coinbase, and Freshworks, laying off workers in information systems. The following figure shows net employment changes in the BLS employment category of “computing infrastructure providers, data processing, web hosting, and related services.” Employment in this sector declined for the sixth straight month in April. Since November 2025, the sector has experienced a net decline of 23,000 jobs.

The establishment survey also includes data on average hourly earnings (AHE). As we noted in this post, many economists and policymakers believe the employment cost index (ECI) is a better measure of wage pressures in the economy than is the AHE. The AHE does have the important advantage of being available monthly, whereas the ECI is only available quarterly. The following figure shows the percentage change in the AHE from the same month in the previous year. The AHE increased 3.6 percent in April, up from 3.4 percent in March.

What effect is this jobs report likely to have on the decisions of the Federal Reserve’s policymaking Federal Open Market Committee at its next meeting on June 16–17, the first meeting with Kevin Warsh as chair? Although employment growth has been relatively slow in recent months, as noted earlier, even that slow rate may be close to the break-even rate of employment growth. So, it’s unlikely that the FOMC will see current conditions in the job market as warranting a cut in the committee’s target range for the federal funds rate. In addition, disruptions to the world oil market as a result of the conflict in Iran have caused oil prices to rise, putting upward pressure on the price level. And the effects of tariff increases have likely not yet fully passed through to increases in prices. These factors make it likely that the committee will keep its target range for the federal funds rate unchanged at its next meeting and may even begin considering future increases in the target range. 

The probability that investors in the federal funds futures market assign to the FOMC keeping its target rate unchanged at its June meeting decreased slightly this afternoon to 93.9 percent, from 96.4 percent yesterday. Investors no longer assign a greater than a 50 percent probability to a rate cut occuring at any meeting through the end of 2027.