Dylan’s Candy Bar in New York City (Photo from the New York Times)
Can prices of one type of good track inflation accurately? As we’ve discussed in a number of blog posts (for instance, here, here, and here), there is a debate among economists about which of the data series on the price level does the best job of tracking the underlying rate of inflation.
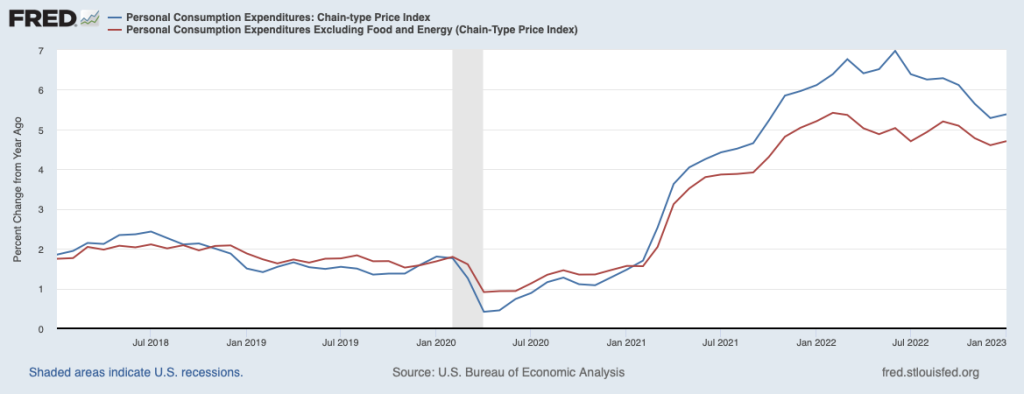
The most familiar data series on the price level is the consumer price index (CPI). Core CPI excludes the—typically volatile—food and energy prices. In gauging whether it is achieving its goal of 2 percent annual inflation, the Federal Reserve uses the personal consumption expenditures (PCE) price index. The PCE price index includes the prices of all the goods and services included in the consumption category of GDP, which makes it a broader measure of inflation than the CPI. To understand the underlying rate of inflation, the Fed often focuses on movements in core PCE.
With the increase in inflation that started in the spring of 2021, some economists noted that the prices of particular goods and services—such as new and used cars and housing—were increasing much more rapidly than other prices. So some economists concentrated on calculating inflation rates that excluded these or other prices from either the CPI or the PCE.
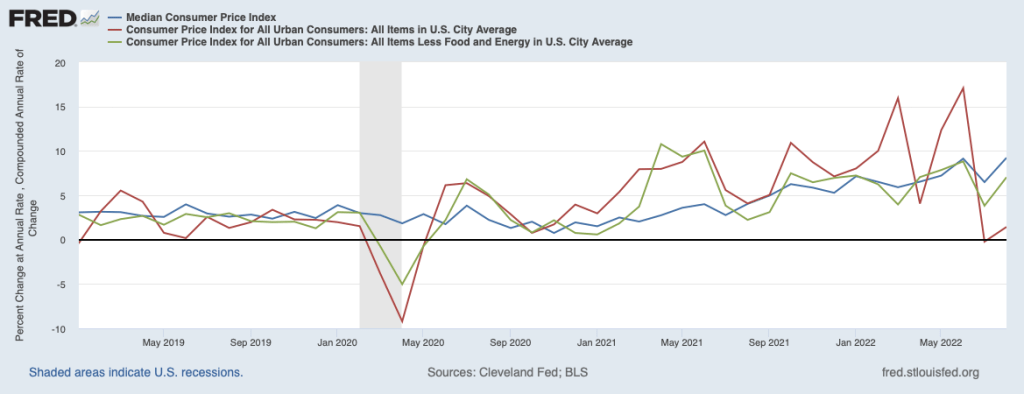
For example, the following figure shows the inflation rate measured by the percentage change from the same month in the previous year using the median CPI and using the trimmed mean PCE. If we list the inflation rate in each individual good or service in the CPI, median inflation is the inflation rate of the good or service that is in the middle of the list—that is, the inflation rate in the price of the good or service that has an equal number of higher and lower inflation rates. The trimmed mean measure of PCE inflation is compiled by economists at the Federal Reserve Bank of Dallas by dropping from the PCE the goods and services that have the highest and lowest rates of inflation. During the period when the inflation rate was increasing rapidly during 2021 and 2022, CPI inflation increased more and was more volatile than PCE inflation. That difference between movements in the two price level series is heightened when comparing median inflation in the CPI with trimmed mean inflation in the PCE. In particular, using trimmed mean PCE, the inflation of late 2021 and 2022 seems significantly milder than it does using median CPI.

The United States last experienced high inflation rates in the 1970s, when few people used personal computers and easily downloading macroeconomic data from the internet wasn’t yet possible. Today, it’s comparatively easy to download data on the CPI and PCE and manipulate them to investigate how the inflation rate would be affected by dropping the prices of various goods and services. It’s not clear, though, that this approach is always helpful in determining the underlying inflation rate. In a market system, the prices of many goods and services will be affected in a given month by shifts in demand and supply that aren’t related to general macroeconomic conditions.
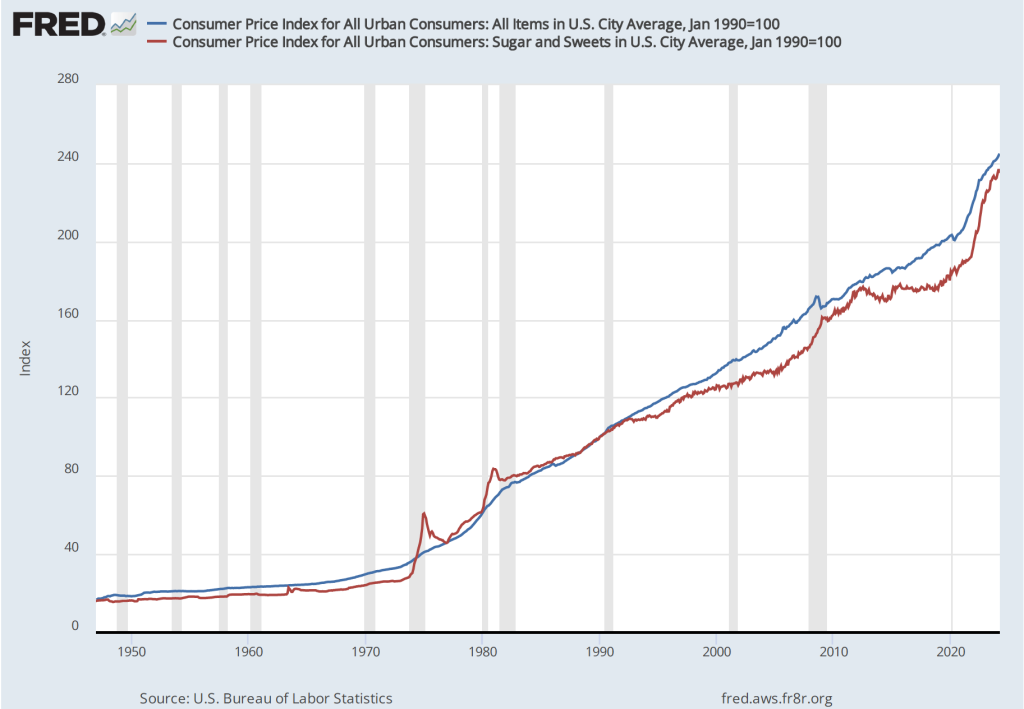
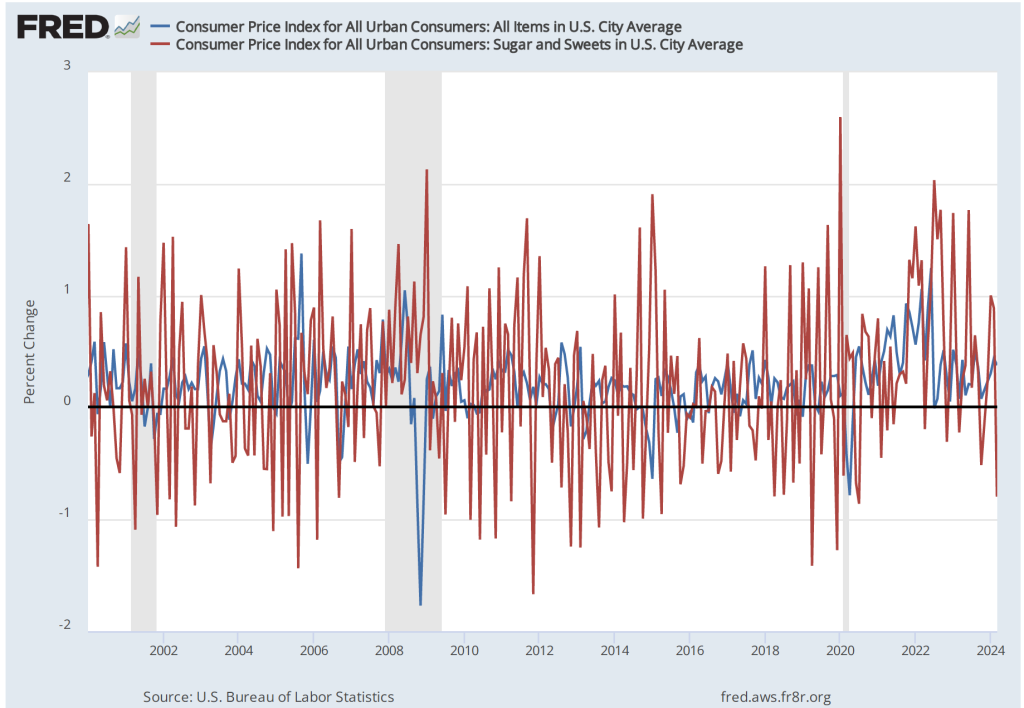
In a recent blog post, economists B. Ravikumar and Amy Smaldone of the Federal Reserve Bank of St. Louis note that there is a strong correlation between movements in the prices of the “Sugar and Sweets” component of the CPI and movements in the overall CPI. Their post includes the following two figures. The first shows the price level since 1947 calculated using the prices of all the goods and services in the CPI (blue line) and the price level calculated just using the prices of goods included in the “Sugar and Sweets” category (red line). The data are adjusted to an index where the value for each series in January 1990 equals 100. The second figure shows the percentage change from the previous month for both series for the months since January 2000.
The two figures show an interesting—and perhaps surprising—correlation between sugar and sweets prices and all prices included in the CPI. The St. Louis Fed economists note that although the CPI is only published once per month, prices on sugar and sweets are available weekly. Does that mean that we could use prices on sugar and sweets to predict the CPI? That seems unlikely. First, consider that the sugar and sweets category of the CPI consists of three sub-categories:
- White, brown, and raw sugar and natural and artificial sweetners
- Chocolate and other types of candy, fruit flavored rolls, chewing gum and breath mints
- Other sweets, including jelly and jams, honey, pancake syrup, marshmallows, and chocolate syrup
Taken together these products are less than 3 percent of the products included in the CPI. In addition, the prices of the goods in this category can be heavily dependent on movements in sugar and cocoa prices, which are determined in world wide markets. For instance, the following figure shows the world price of raw cocoa, which soared in 2024 due to bad weather in West Africa, where most cocoa is grown. There’s no particular reason to think that factors affecting the markets for sugar and cocoa will also affect the markets in the United States for automobiles, gasoline, furniture, or most other products.

In fact, as the first figure below shows, if we look at the inflation rate calculated as the percentage change from the same month in the previous year, movements in sugar and sweets prices don’t track very closely movements in the overall CPI. Beginning in the summer of 2022—an important period when the inflation that began in the spring of 2021 peaked—inflation in sugar and sweets was much higher than overall CPI inflation. Anyone using prices of sugar and sweets to forecast what was happening to overal CPI inflation would have made very poor predictions. We get the same conclusion from comparing inflation calculated by compounding the current month’s rate over an entire year: Inflation in sugar and sweets prices is much more volatile than is overall CPI inflation. That conclusion is unsurprising given that food prices are generally more volatile than are the prices of most other goods.


It can be interesting to experiment with excluding various prices from the CPI or the PCE or with focusing on subcategories of these series. But it’s not clear at this point whether any of these adjustments to the CPI and the PCE, apart from excluding all food and energy prices, gives an improved estimate of the underlying rate of inflation.