
There are multiple ways to measure inflation. Economists and policymakers use different measures of inflation depending on the use they intend to put the measure of inflation to. For example, as we discuss in Macroeconomics, Chapter 9, Section 9.4 (Economics, Chapter 19, Section 19.4), the Bureau of Labor Statistics (BLS) constructs the consumer price index (CPI) as measure of the cost of living of a typical urban household. So the BLS intends the percentage change in the CPI to measure inflation in the cost of living as experienced by the roughly 93 percent of the population that lives in an urban household. (We are referring here to what the BLS labels CPI–U. As we discuss in this blog post, the BLS also compiles a CPI for urban wage earners and clerical workers (or CPI–W).)
As we discuss in an Apply the Concept in Chapter 15, Section 15.5, because the Fed is charged by Congress with ensuring stability in the general price level, the Fed is interested in a broader measure of inflation than the CPI. So its preferred measure of inflation is the personal consumption expenditures (PCE) price index, which the Bureau of Economic Analysis (BEA) issues monthly. The PCE price index is a measure of the price level similar to the GDP deflator, except it includes only the prices of goods and services from the consumption category of GDP. Because the PCE price index includes more goods and services than the CPI, it is suits the Fed’s need for a broader measure of inflation. The Fed uses changes in the PCE to evaluate whether it’s meeting its target of a 2 percent annual inflation rate.
In using either the percentage change in the CPI or the percentage change in the PCE, we are looking at what inflation has been over the previous year. But economists and policymakers are also looking for indications of what inflation may be in the future. Prices of food and energy are particularly volatile, so the BLS issues data on the CPI excluding food and energy prices and the BEA does the same with respect to the PCE. These two measures help avoid the problem that, for example, a period of high gasoline prices might lead the inflation rate to temporarily increase. Note that inflation caclulated by excluding the prices of food and energy is called core inflation.
During the surge in inflation that began in the spring of 2021 and continued into the fall of 2022, some economists noted that supply chain problems and other effects of the pandemic on labor and product markets caused the prices of some goods and services to spike. For example, a shortage of computer chips led to a reduction in the supply of new cars and sharp increases in car prices. As with temporary spikes in prices of energy and food, spikes resulting from supply chain problems and other effects of the pandemic might lead the CPI and PCE—even excluding food and energy prices—to give a misleading measure of the underlying rate of inflation in the economy.
To correct for this problem, some economists have been more attention to the measure of inflation calculated using the median CPI, which is compiled monthly by economists at the Federal Reserve Bank of Cleveland. The median CPI is calculated by ranking the price changes of every good or service in the index from the largest price change to the smallest price change, and then choosing the price change in the middle. The idea is to eliminate the effect on measured inflation of any short-lived events that cause the prices of some goods and services to be particularly high or particularly low. Economists at the Cleveland Fed have conducted research that shows that, in their words, “the median CPI provides a better signal of the underlying inflation trend than either the all-items CPI or the CPI excluding food and energy. The median CPI is even better at forecasting PCE inflation in the near and longer term than the core PCE price index.”
The following figure shows the three measures of inflation using the CPI for each month since January 2019. The red line shows the unadjusted CPI, the green line shows the CPI excluding food and energy prices, and the blue line shows median CPI. To focus on the inflation rate in a particular month, in this figure we calculate inflation as the percentage change in the index at an annual rate. That is, we calculate the annual inflation rate assuming that the inflation rate in that month continued for a year.
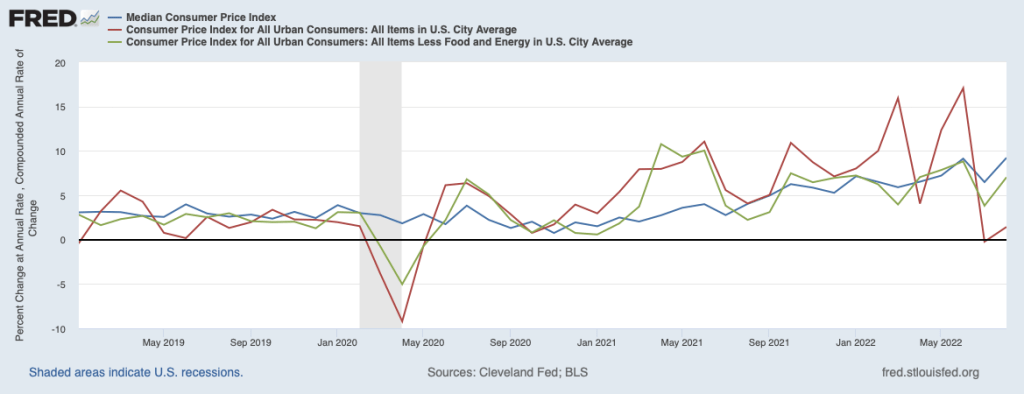
Note that for most of the period since early 2021, during which the inflation rate accelerated, median inflation was well below inflation measured by changes in the unadjusted CPI. That difference reflects some of the distortions in measuring inflation arising from the effects of the pandemic.
But the last two values—for July and August 2022—tell a different story. In those months, inflation measured by changes in the CPI excluding food and energy prices or by changes in median CPI were well above inflation measured by changes in the unadjusted CPI. In August 2022, the unadjusted CPI shows a low rate of inflation—1.4 percent—whereas the CPI excluding food and energy prices shows an inflation rate of 7.0 percent and the median CPI shows an inflation rate of 9.2 percent.
We should always be cautious when interpreting any economic data for a period as short as two months. But data for inflation measured by the change in median CPI may be sending a signal that the slowdown in inflation that many economists and policymakers had been predicting would occur in the summer of 2022 isn’t actually occurring. We’ll have to await the release of future data to draw a firmer conclusion.
Sources: Michael S. Derby, “Inflation Data Scrambles Fed Rate Outlook Again,” Wall Street Journal, September 14, 2022; Federal Reserve Bank of Cleveland, “Median CPI,” clevelandfed.org; and Federal Reserve Bank of St. Louis.
