No Sign of Cooling Inflation in September CPI Report

Image created by ChatGPT

Today’s report from the Bureau of Labor Statistics (BLS) on the consumer price index (CPI) for August was eagerly awaited by economists and policy analysts. As we discuss in Macroeconomics, Chapter 15 (Economics, Chapter 25), monetary policy affects the economy with, in the words of Nobel Laureate Milton Friedman, “long and variable lags.” As a result, most economists agree that the Federal Reserve should not attempt to “fine tune” the economy by responding to each government release of macroeconomic data.

There are some instances, however, including the present, when the Fed’s policymaking Federal Open Market Committee (FOMC) appears to be uncertain as to whether a change in policy is needed. As a result, there was a widespread expectation that if today’s report indicated that inflation is slowing, the FOMC would likely leave its target for the federal funds rate unchanged at its meeting on Tuesday and Wednesday of next week. But if the report didn’t indicate that inflation is slowing, the committee would likely raise its target. The report gave few indications that inflation is slowing.

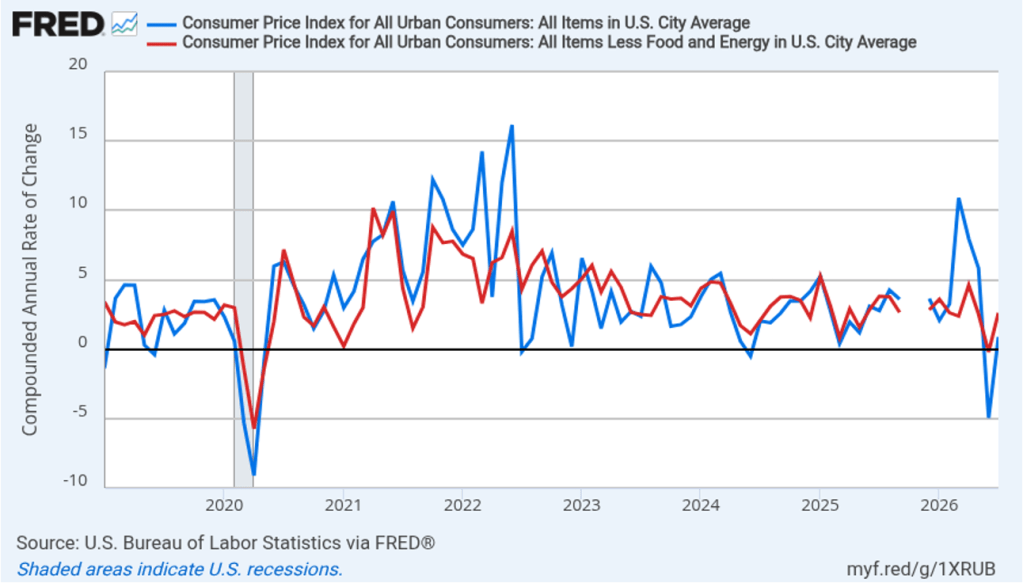
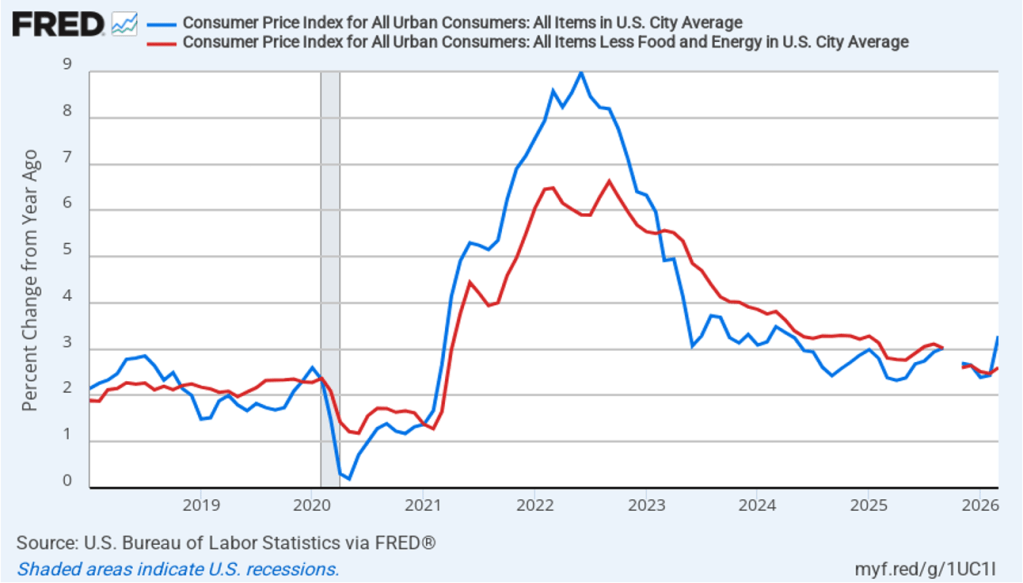
The following figure compares headline CPI inflation (the blue line) and core CPI inflation (the red line).

  • The headline inflation rate, which is measured by the percentage change in the CPI from the same month in the previous year, was 3.4 percent in August, the same as in July. 
  • The core inflation rate, which excludes the prices of food and energy, was 2.4 percent in August, down from 2.5 in July.  

Headline inflation was slightly higher, and core inflation was equal, to the forecasts of economists surveyed by FactSet. (Note that because of last year’s federal government shutdown, inflation data for October 2025 are not available.)

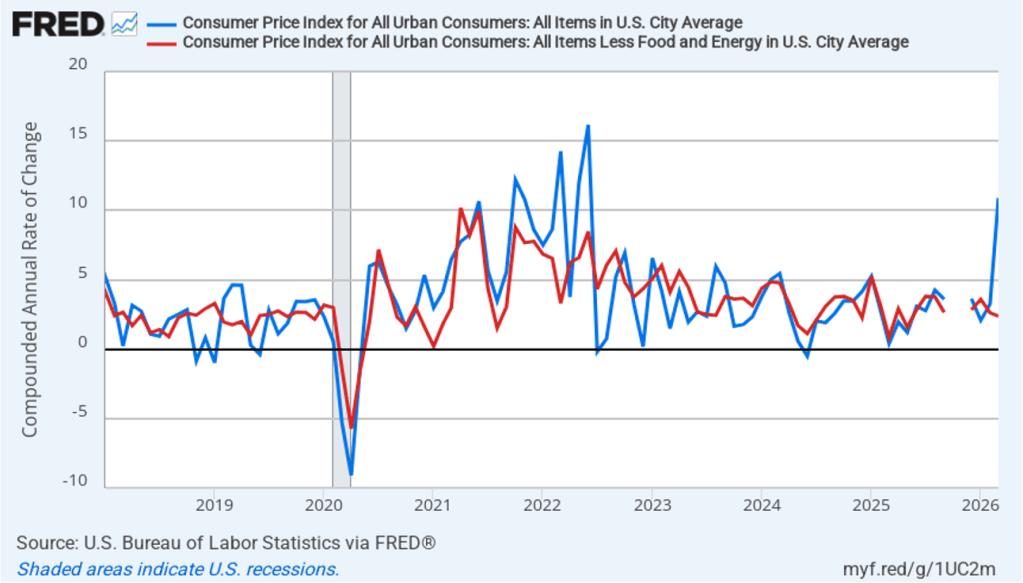
In the following figure, we look at the 1-month inflation rate for headline and core inflation—that is the annual inflation rate calculated by compounding the current month’s rate over an entire year. Calculated as the 1-month inflation rate, headline (the blue line) was 4.6 percent In August, up from 0.9 percent in July. Core inflation (the red line) was 3.5 percent in August, up from 2.6 percent in July.

The following figure illustrates the role played by energy prices in contributing to the large swings in the monthly inflation rate since the conflict in Iran began at the end of February. The red line shows the 1-month inflation rate in all energy prices included in the CPI. Inflation in energy prices, which had declined at an annual rate of 16.4 percent in July, increased at an annual rate of 28.3 percent in August. The blue line shows the 1-month inflation rate in gasoline prices, which had declined at an annual rate of 29.4 percent in July, increased at an annual rate of 58.3 percent in August.

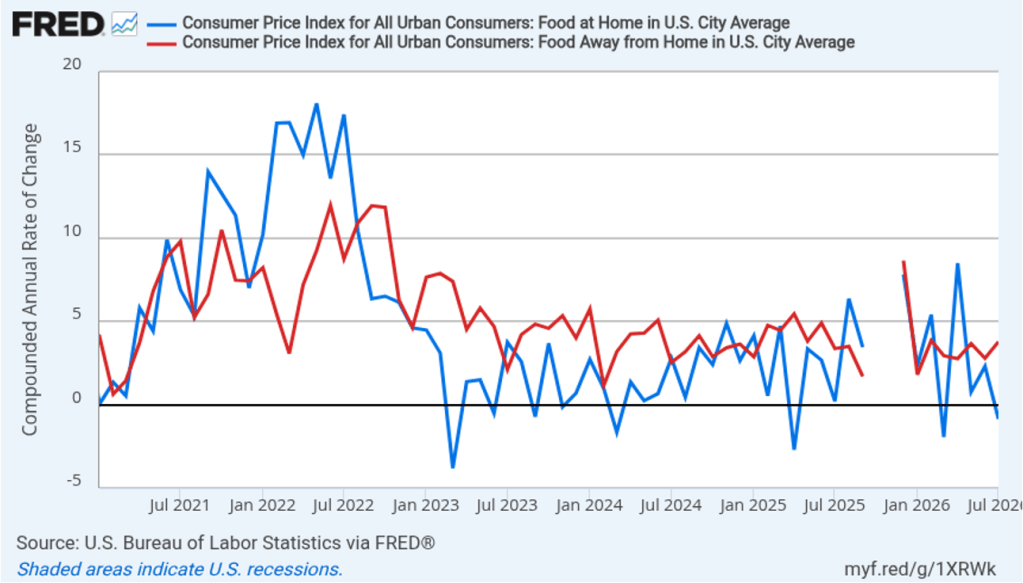
There had been a fear that the rise in energy prices that began in March would pass through to increases in food prices, which are a key concern for many consumers. The following figure shows 1-month inflation in the CPI category “food at home” (the blue bar)—primarily food purchased at grocery stores—and in the category “food away from home” (the red bar)—primarily food purchased at restaurants. Grocery prices, which had declined at annual rate of 0.9 percent in July, increased at an annual rate of 0.4 percent in August. Food prices away from home increased 3.1 percent in August, down from 3.9 percent in July. To this point, increases in energy prices seem to have had some effect on grocery prices and restaurant prices, although the extent of the effect is unclear.

Fed Chair Kevin Warsh has indicated that he favors measures of the inflation rate that exclude particularly small or particularly large changes in the prices of some goods or services—so-called outliers. Median CPI, which is compiled monthly by economists at the Federal Reserve Bank of Cleveland, is calculated by ranking the price changes of every good or service in the index from the largest price change to the smallest price change, and then choosing the price change in the middle. The idea is to eliminate the effect on measured inflation of any short-lived events that cause the prices of some goods and services to be particularly high or particularly low. Economists at the Cleveland Fed have conducted research that shows that, in their words, “the median CPI provides a better signal of the underlying inflation trend than either the all-items CPI or the CPI excluding food and energy. The median CPI is even better at forecasting [personal consumption expenditures] PCE inflation in the near and longer term than the core PCE price index.”

Trimmed-mean inflation, also compiled by economists at the Cleveland Fed, excludes the highest 8 percent of price changes and the lowest 8 percent. The following figure shows 1-month trimmed mean (the blue line) and median (the red line) CPI inflation. Trimmed-mean inflation was 2.7 percent in August, unchanged from July. Median inflation was 2.1 percent in August, down from 3.1 percent in July. So these measures of inflation are both lower than the conventional headline and core CPI inflation measures, although as the figure shows, both measures are volatile.

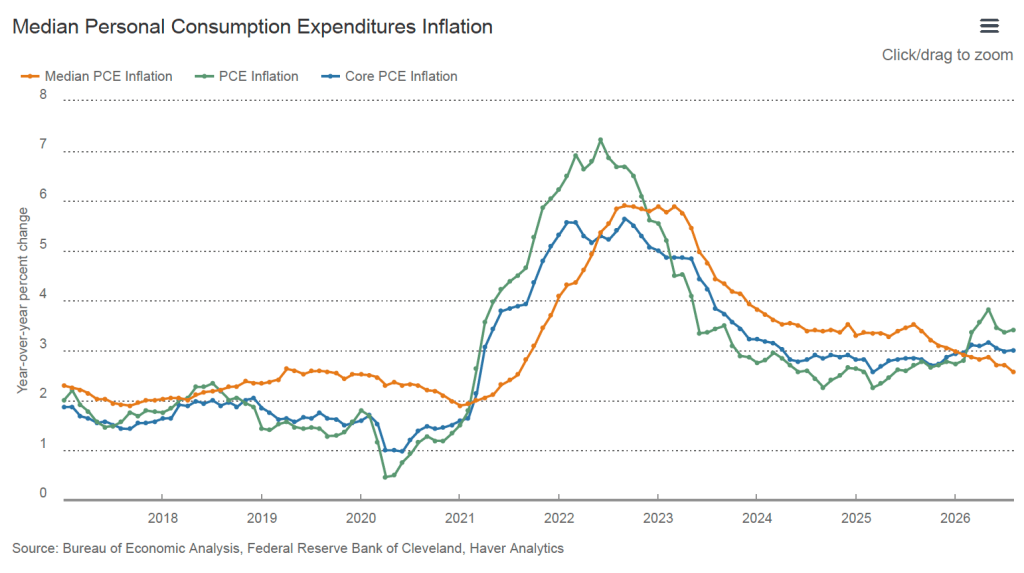
Note that the Fed uses the 12-month change in the personal consumption expenditures (PCE) price index, not the change in the CPI, when gauging whether it is hitting its 2 percent annual inflation target. Historically, PCE inflation has been about 0.4 percentage points to 0.5 percentage points lower than CPI inflation. The Bureau of Economic Analysis (BEA) won’t release its estimate of August PCE inflation until September 30, after the next FOMC meeting.

Today’s report showing that inflation remains persistently above the Fed’s 2 percent annual target, following last week’s jobs report showing an unexpectedly large increase in employment, has likely raised the chance that Federal Reserve policymakers will increase their target range for the federal funds rate from the current 3.50 percent to 3.75 percent by o.25 percentage points (or 25 basis points) at the next meeting of the FOMC on September 15–16. Trading in the federal funds futures market this afternoon indicates that investors assign a 86.5 percent probability to the FOMC raising its target range at that meeting, which is up from a 72.4 probability yesterday. Trading indicated that investors assign a 74.5 percent probability to the committee increasing its target range by at least 50 basis points by the end of the year, up from 64.6 percent yesterday and from 44.7 percent one week ago.

Unexpectedly Strong August Jobs Report

Image created by ChatGPT

This morning (September 4), the Bureau of Labor Statistics (BLS) released its “Employment Situation” report (often called the “jobs report”) for August. The report showed an unexpectedly large increase in employment.

The jobs report has two estimates of the change in employment during the month: one estimate from the establishment survey, often referred to as the payroll survey, and one from the household survey. As we discuss in Macroeconomics, Chapter 9, Section 9.1 (Economics, Chapter 19, Section 19.1), many economists and Federal Reserve policymakers believe that employment data from the establishment survey provide a more accurate indicator of the state of the labor market than do the household survey’s employment and unemployment data. (The groups included in the employment estimates from the two surveys are somewhat different, as we discuss in this post.) 
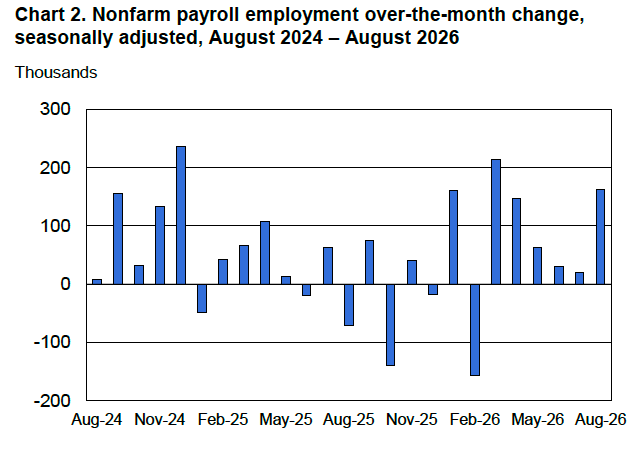
According to the establishment survey, there was a net increase of 162,000 nonfarm jobs during August.  Economists surveyed by the Wall Street Journal had forecast an increase of only 55,000 jobs.  Economists surveyed by FactSet had forecast a net increase of 65,000 jobs. The BLS revised upward its previous estimates of employment in June and July by a combined 55,000 jobs. The estimate of the net employment change in July was revised from a decrease of 23,000 to an increase of 21,000. (The BLS notes that: “Monthly revisions result from additional reports received from businesses and government agencies since the last published estimates and from the recalculation of seasonal factors.”)

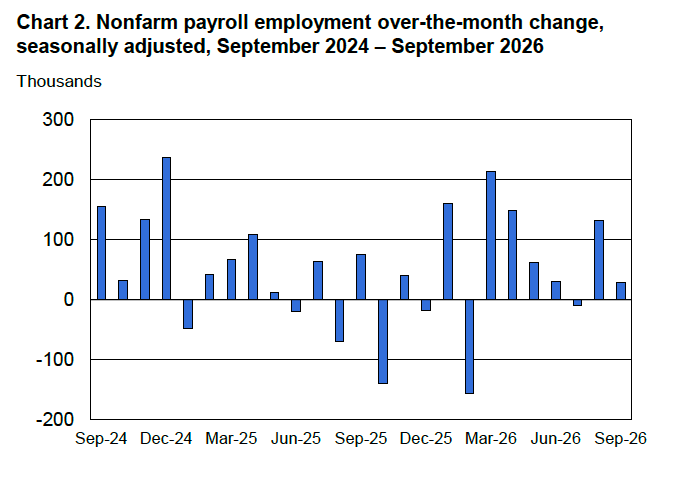
The following figure from the jobs report shows the net change in nonfarm payroll employment for each month in the last two years. The figure shows that since peaking in March with a net increase of 214,000 jobs, job growth slowed markedly over the following four months until strongly rebounding in August. In 2026, monthly net employment growth has averaged 80,375. That is much higher than the 2025 average monthly employment growth of only 9,667, but well below the 2024 average monthly employment growth of 121,583.

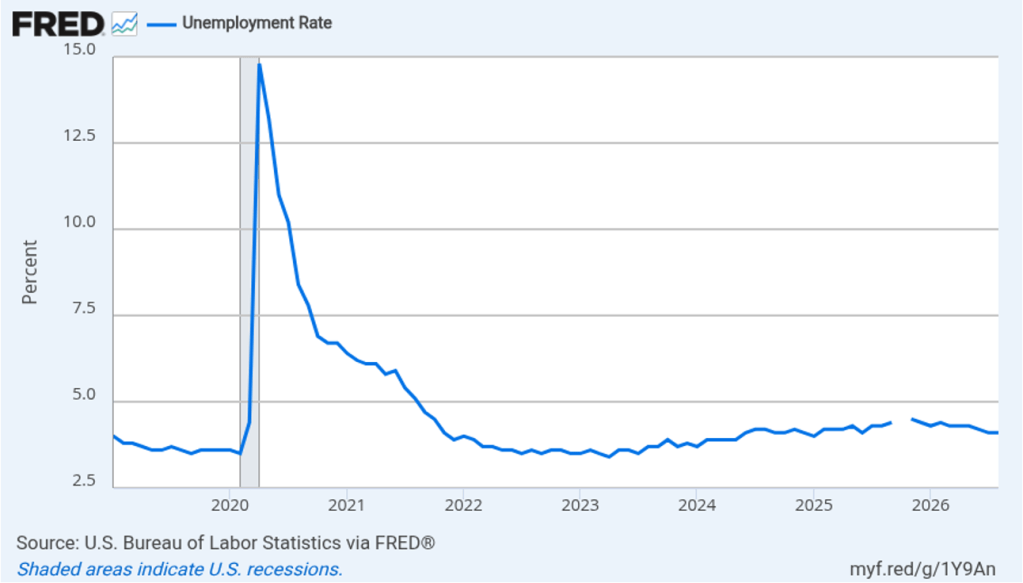
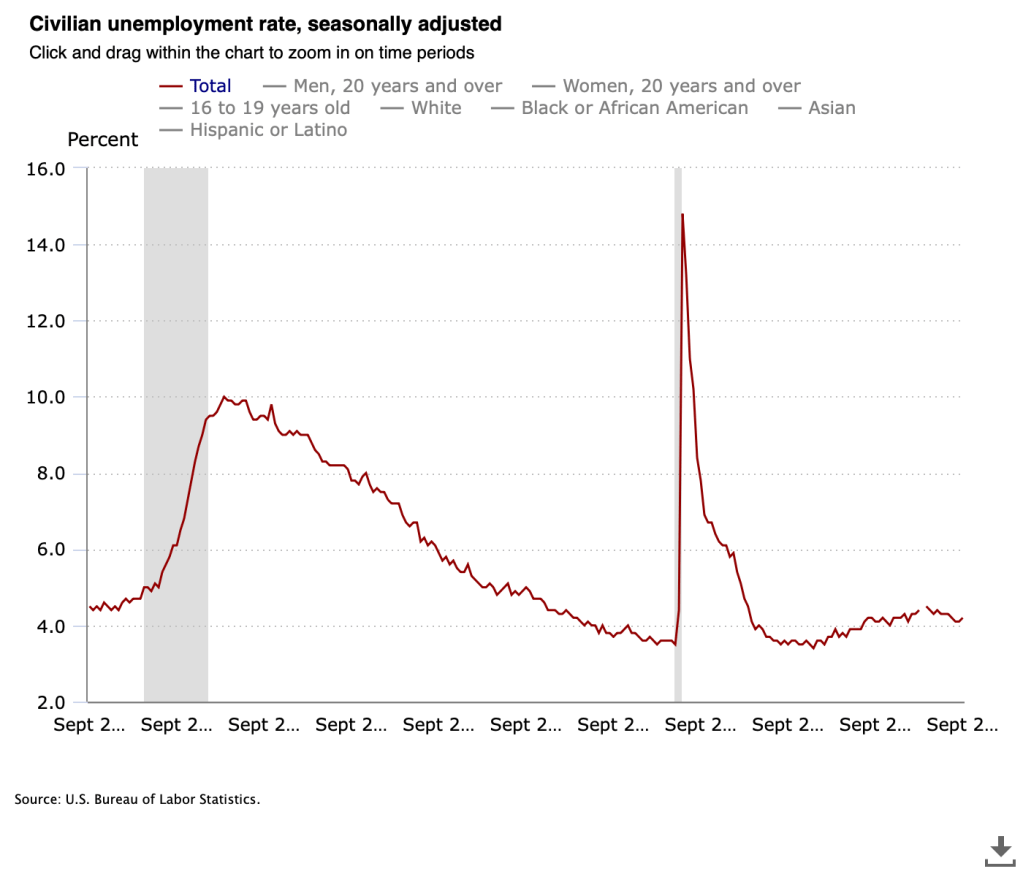
The unemployment rate, which is calculated from data in the household survey, was 4.1 percent, unchanged from July. The estimated size of the labor force, the number of workers employed, and the number of workers unemployed all increased in August. The following figure shows that the unemployment rate has been remarkably stable over the past year and a half, staying between 4.0 percent and 4.4 percent in each month since June 2024. The Federal Open Market Committee’s most recent estimate of the natural rate of unemployment—the normal rate of unemployment over the long run—is 4.2 percent. So, currently the unemployment rate is slightly below that estimate of the natural rate. (We discuss the natural rate of unemployment in Macroeconomics, Chapter 9 and Economics, Chapter 19.)
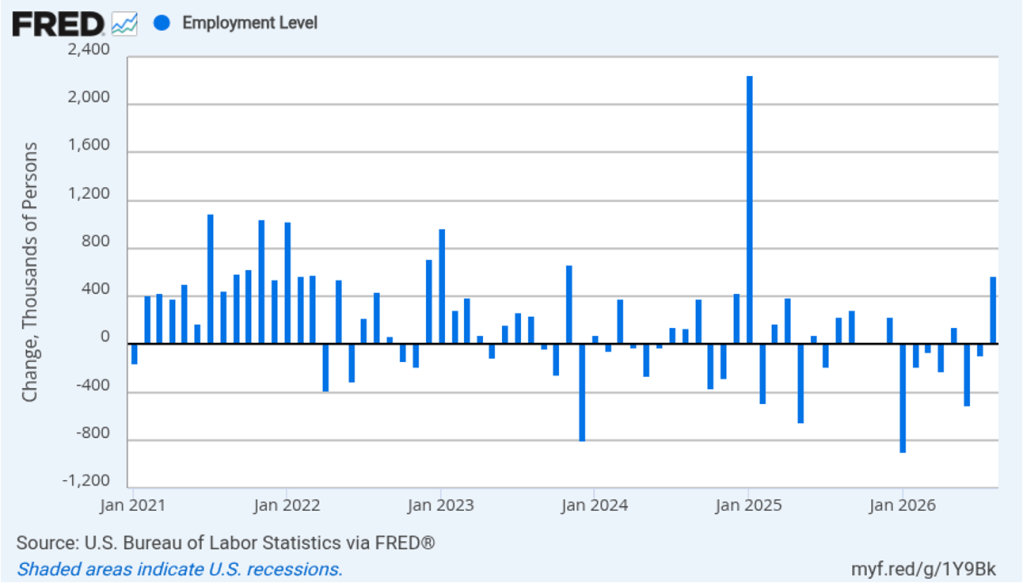
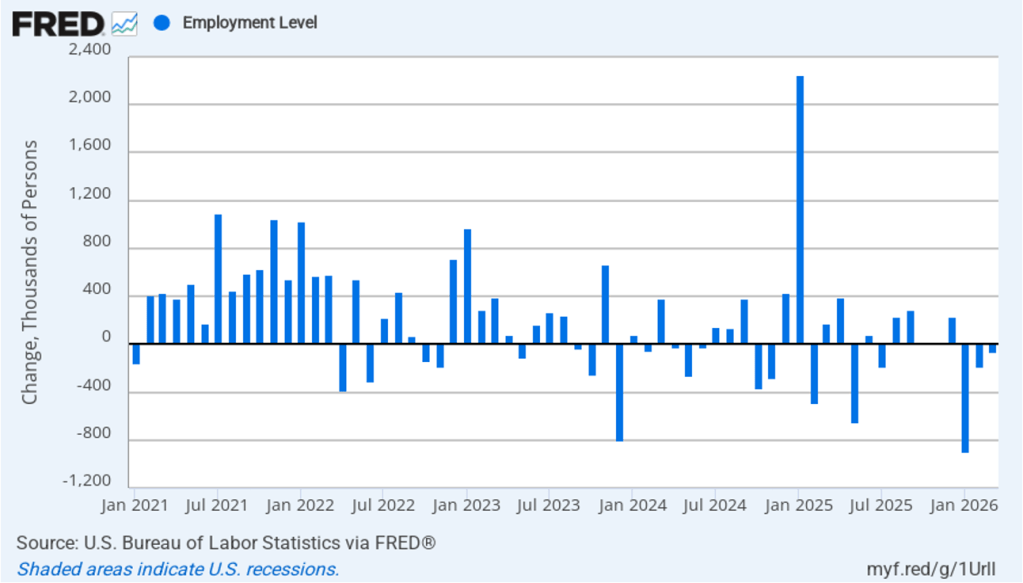
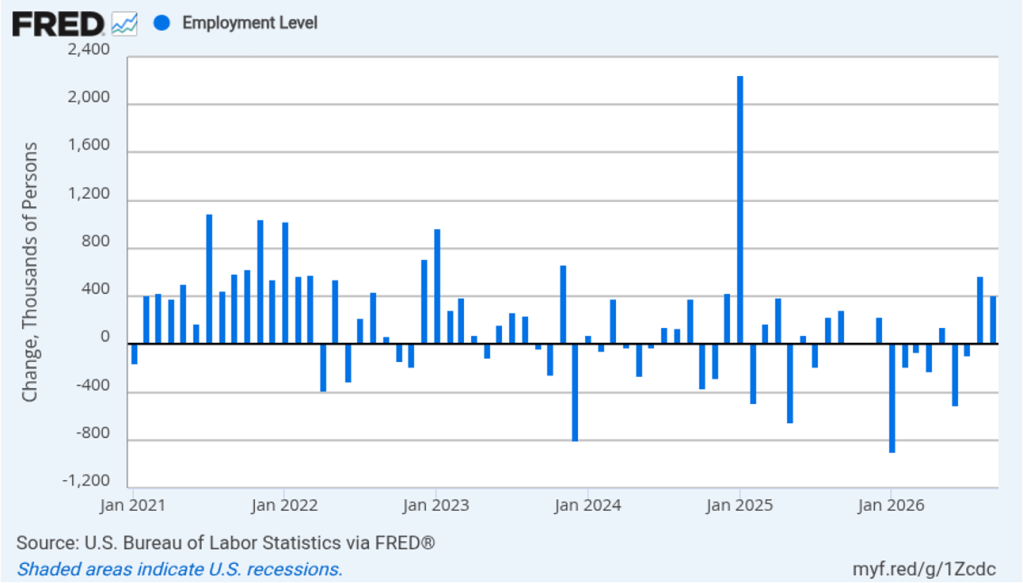
As the following figure shows, the monthly net change in jobs from the household survey moves much more erratically than does the net change in jobs from the establishment survey. As measured by the household survey, there was a net increase of 569,000 jobs in August, far larger than the net increase in employment shown in the establishment survey. Since January, the household survey has shown a net increase in jobs in only two months, with a total net decrease of 326,000 jobs over the period. In contrast, the establishment survey has shown a net increase of 643,000 jobs over the same period. (Note that because of last year’s shutdown of the federal government, there are no data for October or November.)
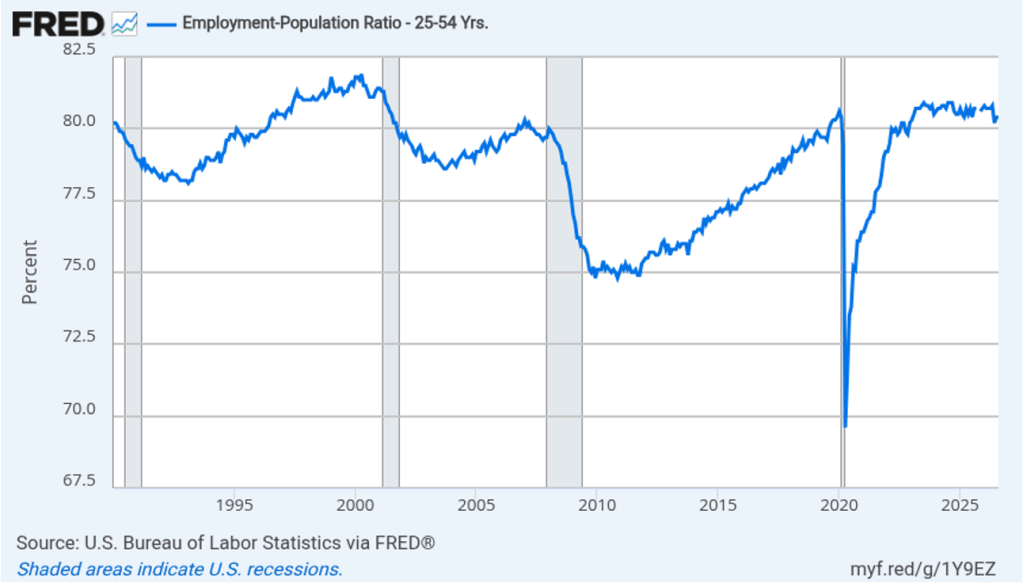
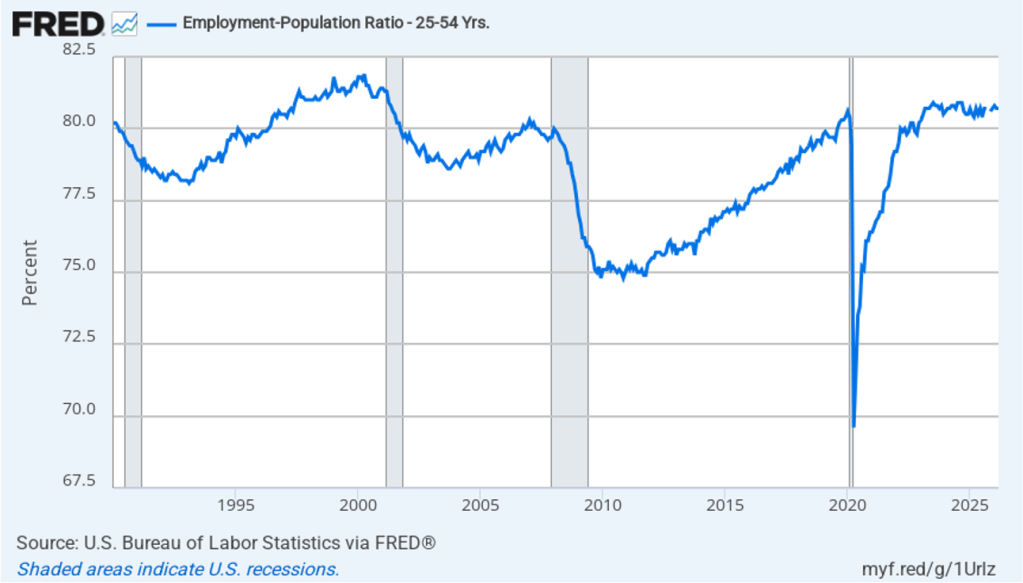
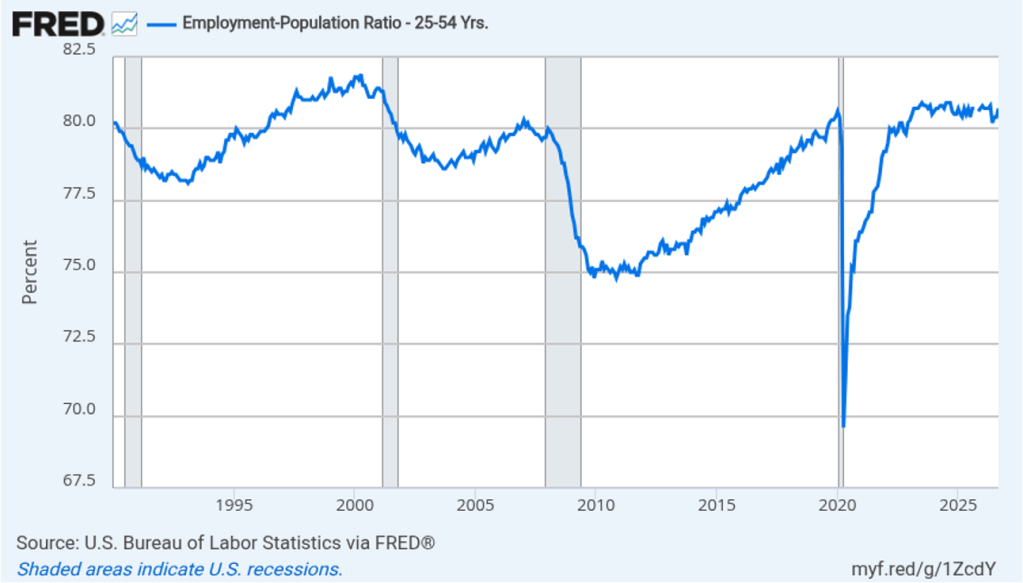
The household survey has another important labor market indicator: the employment-population ratio for prime age workers—those workers aged 25 to 54. In August, the ratio was 80.4 percent, unchanged from July. The prime-age population ratio can show volatility from month to month but has remained above 80 percent every month since December 2022.
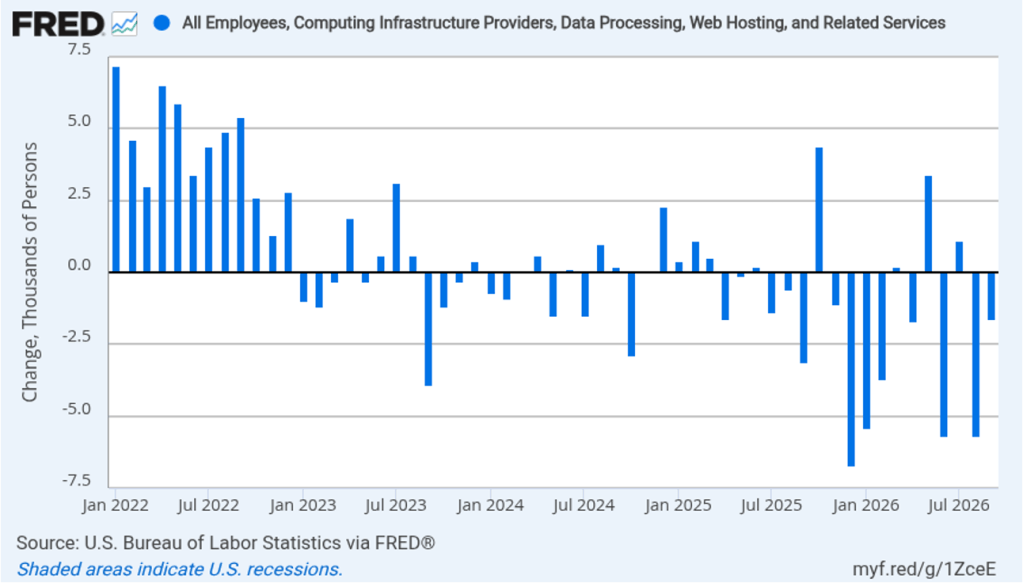
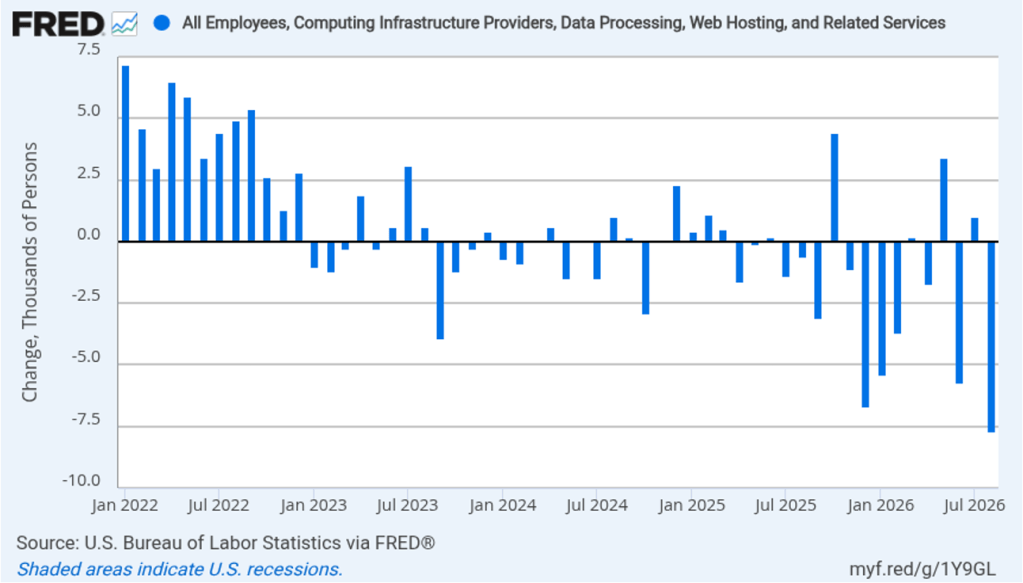
The rapid adoption of artificial intelligence (AI) by many firms has led to forecasts of substantial layoffs of workers in information systems. The following figure shows net employment changes in the BLS employment category of “computing infrastructure providers, data processing, web hosting, and related services.” Employment in this sector has been declining during most months since the beginning of 2023. In August, there was a net decrease of 7,700 jobs.

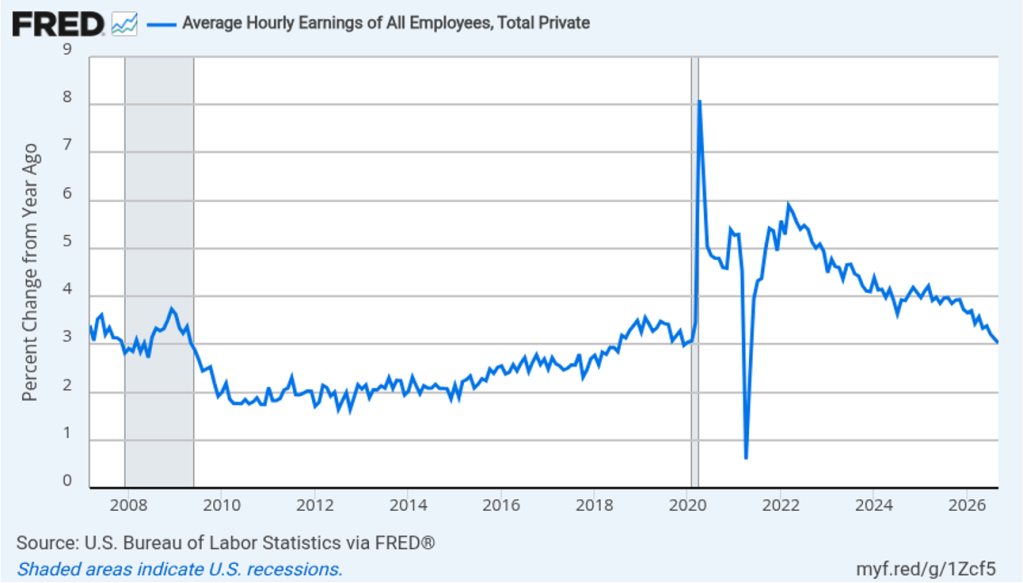
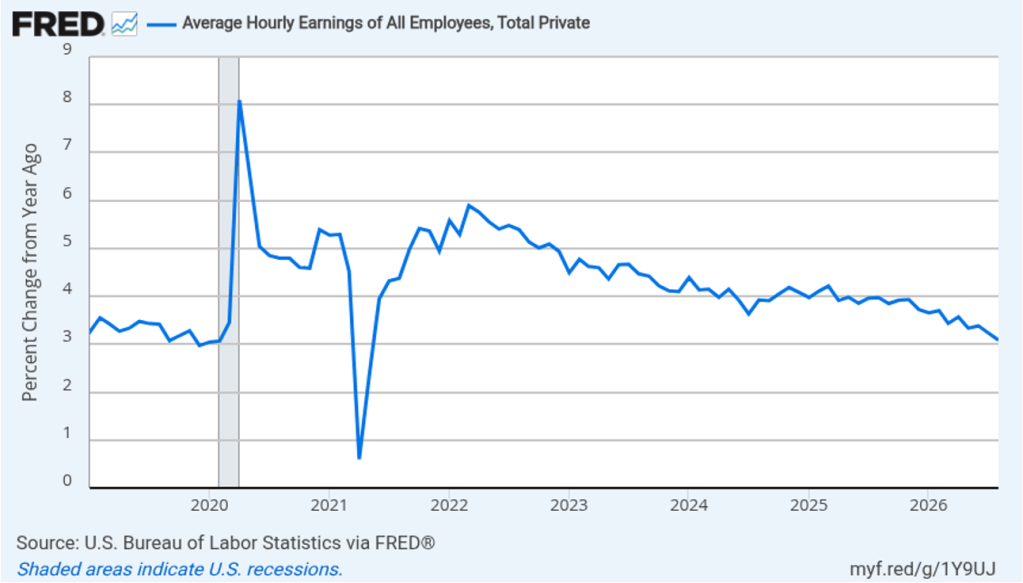
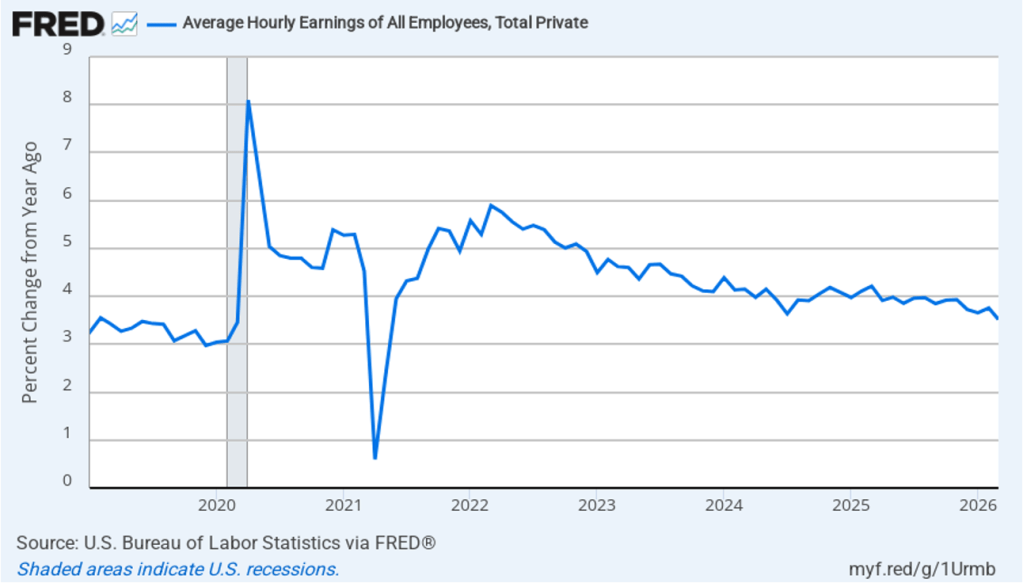
The establishment survey also includes data on average hourly earnings (AHE). As we noted in earlier posts, many economists and policymakers believe the employment cost index (ECI) is a better measure of wage pressures in the economy than is AHE. AHE does have the important advantage of being available monthly, whereas the ECI is only available quarterly. The following figure shows the percentage change in AHE from the same month in the previous year. AHE increased 3.1 percent in August, down from 3.2 percent in July. That was the smallest increase since May 2021. The rate of increase in AHE has been below 4.0 percent each month since August 2025, indicating that cost pressure from wage increases has not been a significant source of price inflation during the past year.

With inflation having been above the Federal Reserve’s 2 percent annual target every month since March 2021, there has been an expectation that the Fed’s policymaking Federal Open Market Committee (FOMC) would increase its target for the federal funds rate at least once before the end of 2026. At the FOMC’s last meeting in late July, three members of the committee voted to increase the target, an unusual amount of dissent from a committee decision. 

Do today’s surprisingly strong employment data increase the chance that the FOMC will raise its target range for the federal funds rate at its next meeting on September 15–16? Investors in the federal funds futures market believe that the answer is “yes.” Yesterday, trading in the federal funds futures market indicated that investors assigned a 49.4 percent probability to the committee increasing its target range by 0.25 percentage points (25 basis points) at that meeting. This afternoon, that probability had increased to 58.4 percent. The probability that the committee will have increased its target range by at least 25 basis points from its current range of 3.50 percent to 3.75 percent after its meeting on October 27–28 increased from 62.8 percent yesterday to 69.4 percent this afternoon.

The BLS will release its estimate of inflation as measured by the consumer price index next Friday. That report will provide further evidence on the current state of inflation and may have a significant effect on the decision the FOMC makes at its meeting the following week.
Fed Chair Warsh Takes a More Hawkish Stand in Address at Jackson Hole

Federal Reserve Chair Kevin Warsh (Photo from federalreserve.com)

Each year since 1982, the Federal Reserve Bank of Kansas City has sponsored an economic policy symposium in Jackson Hole, Wyoming. (The site was supposedly first chosen in the hopes that Fed Chair Paul Volcker would attend because of the opportunities for fly fishing in the local area.)

In most years since 1989, the Fed chair has given the keynote address at the symposium. The address gives the Fed chair a chance to provide his or her assessment of the state of the U.S. economy and the outlook for inflation and employment—the two parts of the dual mandate Congress has given to the Fed.

Image created by ChatGPT

This year’s address by Fed Chair Kevin Warsh was highly anticipated. In his press conference following the last meeting of the Fed’s policymaking Federal Open Market Committee (FOMC), Warsh reiterated his determination to bring inflation back to the Fed’s 2 percent annual target. But he faced a number of questions from reporters as to why, with inflation running well above 2 percent, he wasn’t advocating an increase in the FOMC’s target for the federal funds rate. Warsh has stated that he wantesto steer the committee from using forward guidance to affect interest rates. Accordingly he was reluctant to state explicitly what direction Fed policy might take.

Investors in the bond market appear to have interpreted Warsh’s statements as “dovish”; that is, they believed that his reluctance to support rate increases indicated that inflation might remain above the Fed’s target for longer. As we discussed in earlier blog posts, when investors believe that inflation will be higher they require that bond yields rise enough to compensate them for the additional purchasing power. (As we discuss in Money, Banking, and the Financial System, Chapter 4, economists refer to the increase in nominal interest rates following an increase in the expected inflation rate as the Fisher effect.) The rise in the yield on the 30-year Treasury bond in the days following Warsh’s press conference likely reflected bond investors expecting somewhat higher inflation than they had previously.

In today’s address, Warsh attempted to counter the conclusion that he is reluctant to increase interest rates to slow the rate of inflation. First, though, he repeated his opposition to Fed chairs routinely engaging in forward guidance: “Oversharing policy deliberations and overcommitting to future decisions can lead markets, businesses, and households astray. And I believe when policymakers make quasi-commitments on interest rates through the cycle, we inhibit our own freedom to make the right calls when it’s time to decide.”
He again stated forcefully his commitment to the Fed’s inflation target: “The Fed’s price-stability objective of 2 percent, as measured by the personal consumption expenditures (PCE) price index, is a firm, fixed target. … It is the Fed’s job to deliver stable prices.” He noted that all measures of inflation “tell a similar story: Inflation is running above our 2 percent target. So the Fed’s predominant focus right now should be on prices.”

Warsh also observed that “progress over the past two years [toward the 2 percent target] has been modest.” He concluded that: “There is one signal nobody can miss: The responsibility for 65 months of sustained, elevated inflation sits squarely with the central bank. And that is where it belongs.”

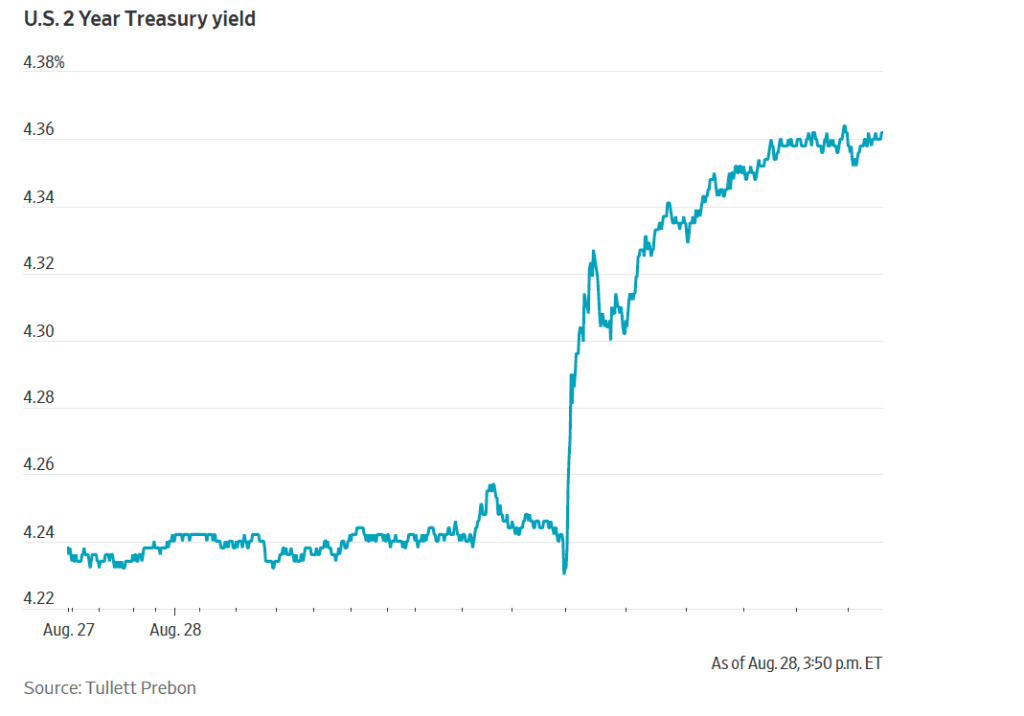
The following figure from the Wall Street Journal reflects the bond market’s immediate reaction when the text of Warsh’s address was released.

The two-year Treasury note is directly affected by investors’ expectations of the future path of the federal funds rate. (We discuss this link in Money, Banking, and the Financial System, Chapter 5.) Investors interpreted Warsh’s address as indicating he would take a more “hawkish” view of the need to raise the FOMC’s target for the federal funds rate than he had appeared to take in his earlier press conference.

Investors in the federal funds future market also quickly revised their expectations of the likelihood of the FOMC raising its target for the federal funds rate. Trading in the futures marker resulted in the probability increasing from 35.4 percent yesterday to 57.5 percent this afternoon of the committee raising its target range for the federal funds by 0.25 percentage points (25 basis points) at its next meeting on September 15–16. The probability that after the meeting on October 27–28, the committee will have raised its target range by at least 25 basis points increased from 52.6 percent yesterday to 70.7 percent this afternoon.

As Expected, CPI Inflation Falls Slightly in July

Image created by ChatGPT

Today (August 12), the Bureau of Labor Statistics (BLS) released its report on the consumer price index (CPI) for July. Lower energy and grocery prices contributed to a slight decline in the inflation rate in July compared with June.
The following figure compares headline CPI inflation (the blue line) and core CPI inflation (the red line).

  • The headline inflation rate, which is measured by the percentage change in the CPI from the same month in the previous year, was 3.4 percent in July, down from 3.5 percent in June. 
  • The core inflation rate, which excludes the prices of food and energy, was 2.5 percent in July, down from 2.6 in June.  

Headline inflation and core inflation were both equal to the forecasts of economists surveyed by FactSet. (Note that because of last year’s federal government shutdown, inflation data for October 2025 are not available.)

In the following figure, we look at the 1-month inflation rate for headline and core inflation—that is the annual inflation rate calculated by compounding the current month’s rate over an entire year. Calculated as the 1-month inflation rate, both headline (the blue line) and core inflation (the red line) increased in July from the negative values in June. That is, the U.S. economy experienced deflation in June because the price level, measured by the CPI and by the CPI less food and energy prices, fell in that month.

In July, 1-month headline CPI inflation was 0.9 percent and 1-month core CPI inflation was 2.6 percent.

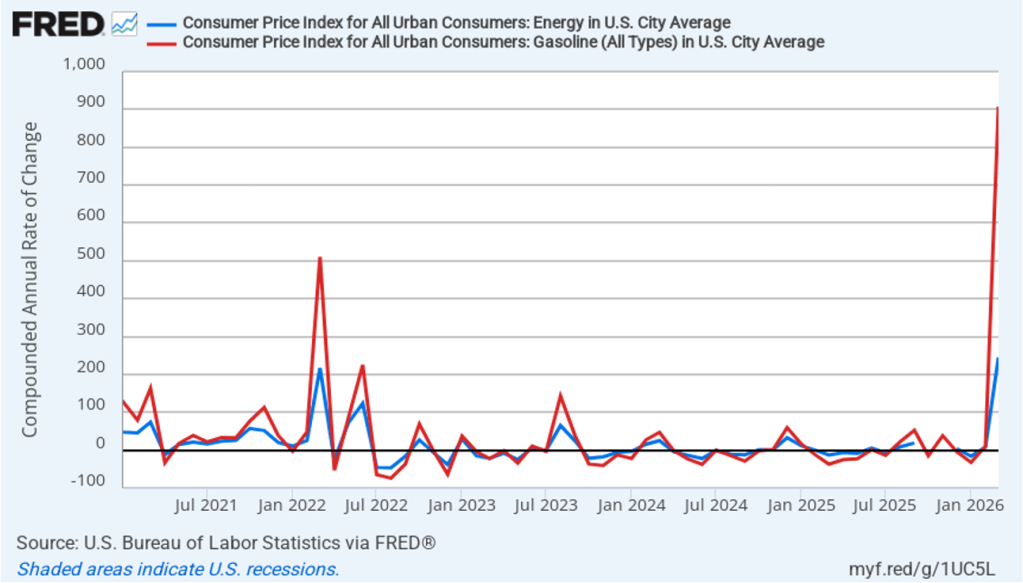
The following figure illustrates the role played by energy prices in contributing to the large swings in the monthly inflation rate since the conflict in Iran began at the end of February. The red line shows the 1-month inflation rate in all energy prices included in the CPI. Inflation in energy prices, which had increased at annual rate of 245 percent in March, declined at an annual rate of 16.4 percent in July. The blue line shows the 1-month inflation rate in gasoline prices, which in March had spiked to more than 900 percent measured at an annual rate, declined at an annual rate of 29.4 percent in July. A return to full-scale hostilities in the Middle East would increase oil prices, which would likely lead to an increase in the U.S. inflation rate.

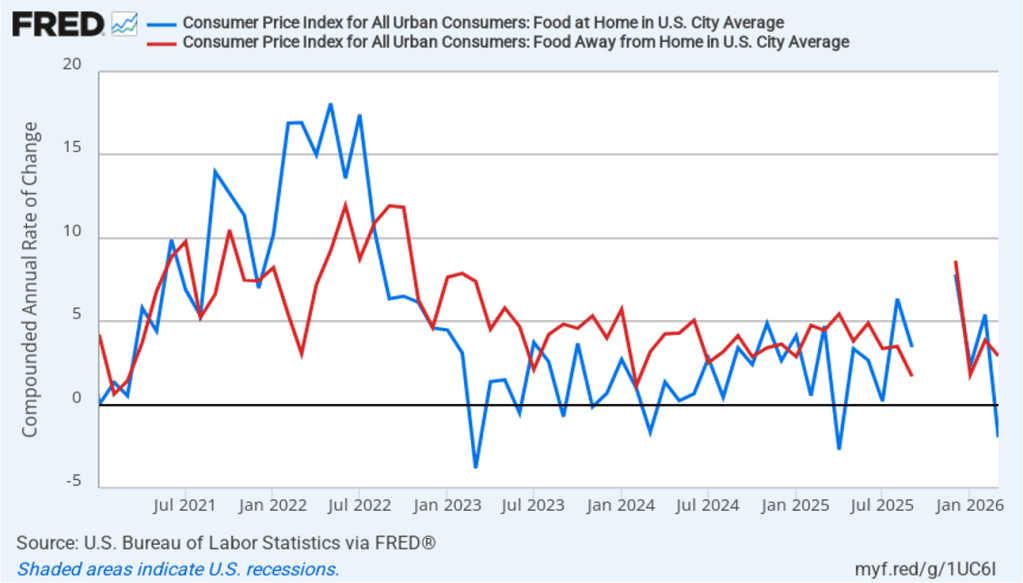
There had been a fear that the rise in energy prices that began in March would pass through to increases in food prices, which are a key concern for many consumers. The following figure shows 1-month inflation in the CPI category “food at home” (the blue bar)—primarily food purchased at grocery stores—and the category “food away from home” (the red bar)—primarily food purchased at restaurants. Inflation in grocery prices, which increased 2.3 percent in June, declined 0.9 percent in July. Inflation in food prices away from home increased from 2.8 percent in June to 3.8 percent in July. To this point, increases in energy priced do not seem to have caused a significant increase in either grocery prices or restaurant prices.

Today’s relatively good inflation report, following last week’s report showing an unexpected decline in employment, has likely reduced the chance that Federal Reserve policymakers will increase their target for the federal funds rate at the next meeting of the Federal Open Market Committee (FOMC) on September 15–16. In trading in the federal funds futures market this afternoon, investors assigned a 62.1 percent probability to the FOMC keeping its target unchanged at that meeting, which was up from a 51.6 probability yesterday. Traders assign a 53.2 percent probability to the committee increasing its target at its October 27–28 meeting, down from 62.2 percent yesterday.

It’s worth noting, however, that inflation is still running above the Federal Reserve’s 2 percent annual inflation target. In testimony before Congress in a hearing on his nomination as Fed Chair, Kevin Warsh cautioned that good news in a single month’s inflation report should be treated with caution. Warsh has intentionally moved away from discussing the circumstances under which monetary policy might change in the future—so-called forward guidance. (We discuss forward guidance in Macroeconomics, Chapter 15 (Economics, Chapter 25)). Uncertainty about actions the FOMC may take during its three remaining meeting this year remains high.

FOMC Holds Target Rate Constant, with Three Dissenting Votes

Fed Chair Kevin Warsh and colleagues discuss policy at the June FOMC meeting (Photo from federalreserve.gov.)

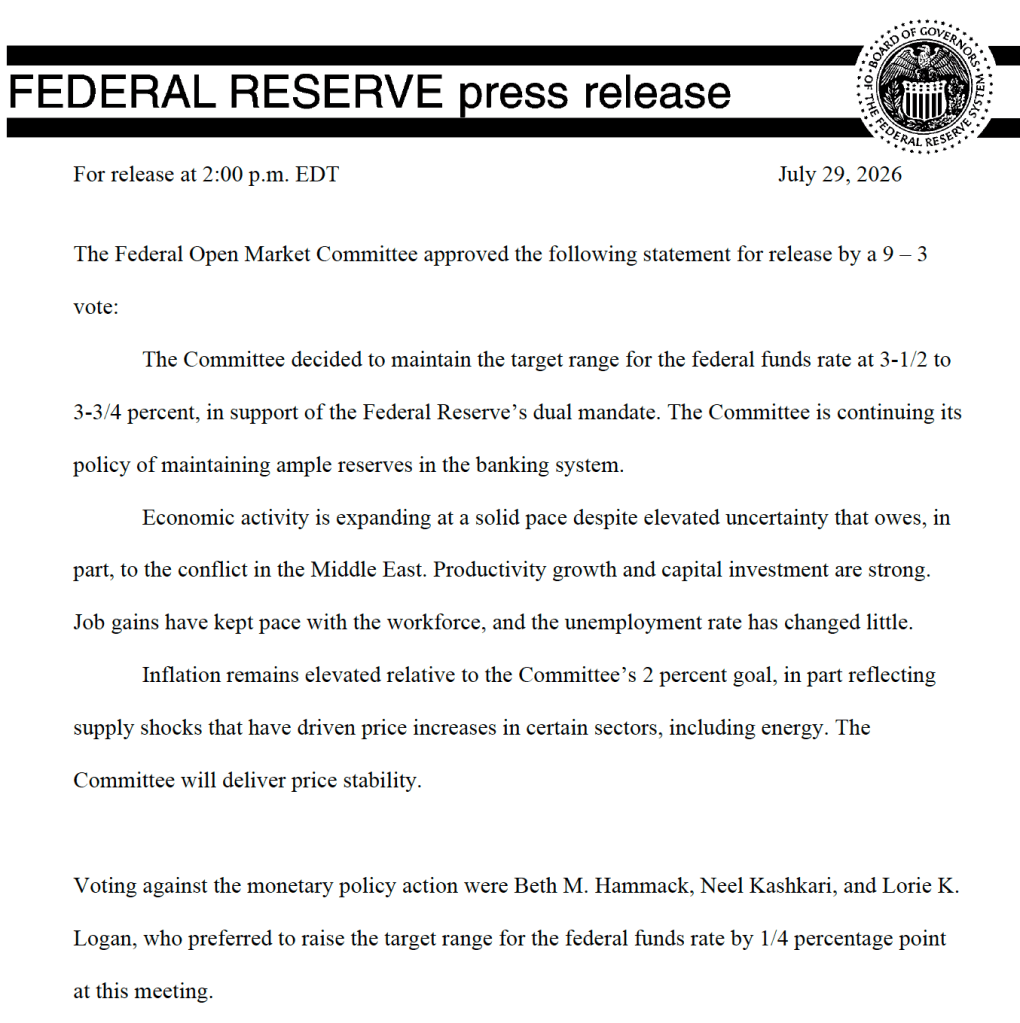
There was some uncertainty as to whether at its meeting that ended today, the Federal Open Market Committee (FOMC) would leave unchanged its target range for the federal funds rate at 3.50 percent to 3.75 percent. As of yesterday, trading in the federal funds rate futures market had given a 31 percent probability to the committee raising its target by 0.25 percentage points (25 basis points). The committee voted 9–3 to keep the target range unchanged, with Beth Hammack, president of the Federal Reserve Bank of Cleveland, Neel Kashkari, president of the Federal Reserve Bank of Minneapolis, and Lorie Logan, president of the Federal Reserve Bank of Dallas, voting to raise the target range by 25 basis points.

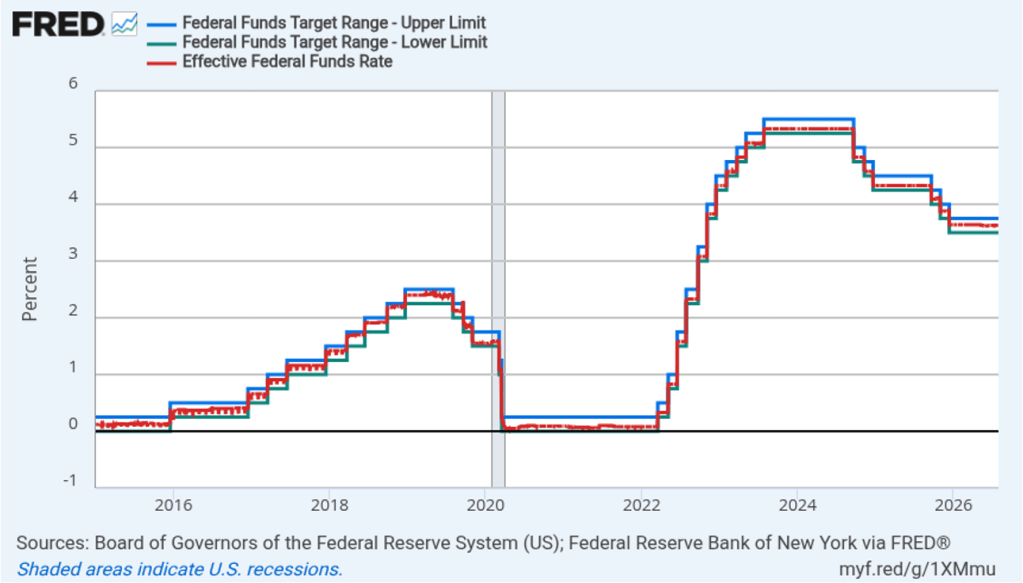
The FOMC has left its target for federal funds rate unchanged since lowering it by 25 basis points on December 10 of last year. The following figure shows for the period since January 2015, the upper bound (the blue line) and the lower bound (the green line) for the FOMC’s target range for the federal funds rate, as well as the actual values for the federal funds rate (the red line). Note that the Fed has been successful in keeping the value of the federal funds rate in its target range. (We discuss the monetary policy tools the FOMC uses to maintain the federal funds rate within its target range in Macroeconomics, Chapter 15, Section 15.2 (Economics, Chapter 25, Section 25.2).)

As with the policy statement issued following Fed Chair Kevin Warsh’s first FOMC meeting in June, today’s policy statement was short and did not include any discussion of the circumstances under which policy might change in the future—so-called forward guidance. We discuss forward guidance in Macroeconomics, Chapter 15 (Economics, Chapter 25).

In his press conference following the meeting, Warsh expanded on his approach to monetary policy, highlighting differences with previous Fed chairs. He noted that he believed that FOMC policy statements should present “just the facts,” providing only a brief summary of current economic conditions and avoiding mention of future monetary policy apart from the assertion—which also closed the policy statement following the June meeting—that “The Committee will deliver price stability.”

He stressed that the committee was in the process of reassessing its approach to monetary policy. The reassessment will rely in part on the findings of the five committees he has formed, although he noted that the FOMC would not feel bound by the recommendations of the five committees. He emphasized that the committee would focus more on trends in economic data and wouldn’t be “holding our breath” waiting for any particular data release. In reply to questions from reporters, he noted that despite the committee leaving its target for the federal funds rate unchanged, there hadn’t been a “pause” in policy because the committee had continued its “rigorous review of big, hard questions.”

Warsh noted that by avoiding forward guidance, the committee wasn’t attempting to surprise financial markets when at some point it announces a policy change. Instead, he argued that prices in financial markets would now better reflect the opinions of market participants, which will provide the committee with useful information.

On two issues, Warsh noted continuity with committee procedures under previous Fed chairs. First, at his June press conference, Warsh had indicated that he would only hold press conferences after FOMC meetings if there was new information to convey. Today, he stated that, through at least the end of the year, he would continue the recent tradition of holding a press conference after each FOMC meeting. Second, when asked about his statements that new measures of inflation were needed, Warsh indicated that, at least through the end of the year, the committee would continue to measure progress toward its 2 percent annual inflation goal using the inflation rate as measured by the personal consumption expenditures (PCE) price index.

Finally, this afternoon, investors in the federal funds rate futures market assigned a 63.4 percent probability to the committee increasing its target range by 25 basis points at its next meeting on September 15–16, a decrease from 76.0 percent yesterday.

A Double Dose of Bad Inflation News

Image generated by ChatGPT

This morning, the Bureau of Labor Statistics (BLS) released its report on the consumer price index (CPI) for March. Yesterday,  the Bureau of Economic Analysis (BEA) released monthly data on the personal consumption expenditures (PCE) price index for February as part of its “Personal Income and Outlays” report.  Both reports showed that the inflation has worsened. Note that data for the PCE were collected before the beginning of the conflict with Iran.

CPI Inflation jumped to a level well above the Federal Reserve’s 2 percent annual inflation target. The following figure compares headline CPI inflation (the blue line) and core CPI inflation (the red line). Because of the effects of the federal government shutdown, the BLS didn’t report inflation rates for October or November, so both lines show gaps for those months.  

  • The headline inflation rate, which is measured by the percentage change in the CPI from the same month in the previous year, was 3.3 percent in March, up from 2.4 percent in February. 
  • The core inflation rate, which excludes the prices of food and energy, was 2.6 percent in March, up only slightly from 2.5 percent in February. 

Headline inflation was equal to the forecast of economists surveyed by the Wall Street Journal but well below the 3.7 percent rate forecast by economists surveyed by FactSet. Core inflation was slightly below the forecast of 2.7 percent in both surveys. Higher energy prices drove the jump in CPI inflation.

In the following figure, we look at the 1-month inflation rate for headline and core inflation—that is the annual inflation rate calculated by compounding the current month’s rate over an entire year. Calculated as the 1-month inflation rate, headline inflation (the blue line) was 10.9 percent in March, up from 3.2 percent in February. Core inflation (the red line) actually decreased to 2.4 in March from 2.6 percent in February.

The following figure emphasizes the role paid by energy prices in causing the jump in inflation. The blue line shows the 1-month inflation rate in all energy prices included in the CPI. The red line shows the 1-month inflation rate in gasoline prices—which was an astounding 907.4 percent.

Did the jump in energy prices pass through to increases in food prices, which are a key concern for many consumers? The following figure shows 1-month inflation in the CPI category “food at home” (the blue bar)—primarily food purchased at grocery stores—and the category “food away from home” (the red bar)—primarily food purchased at restaurants. Inflation in both measures fell in March, indicating that they hadn’t (yet?) been affected by rising energy prices. Food at home actually decreased by 1.9 percent in March after increasing by 5.4 percent in February. Food away from home increased 2.9 percent in March, down from 3.9 percent in February.

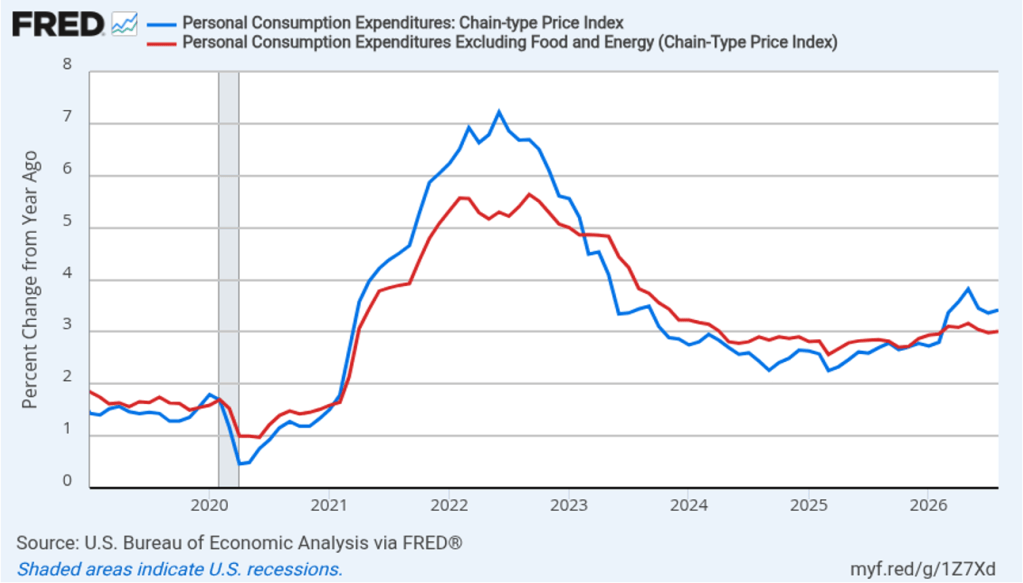
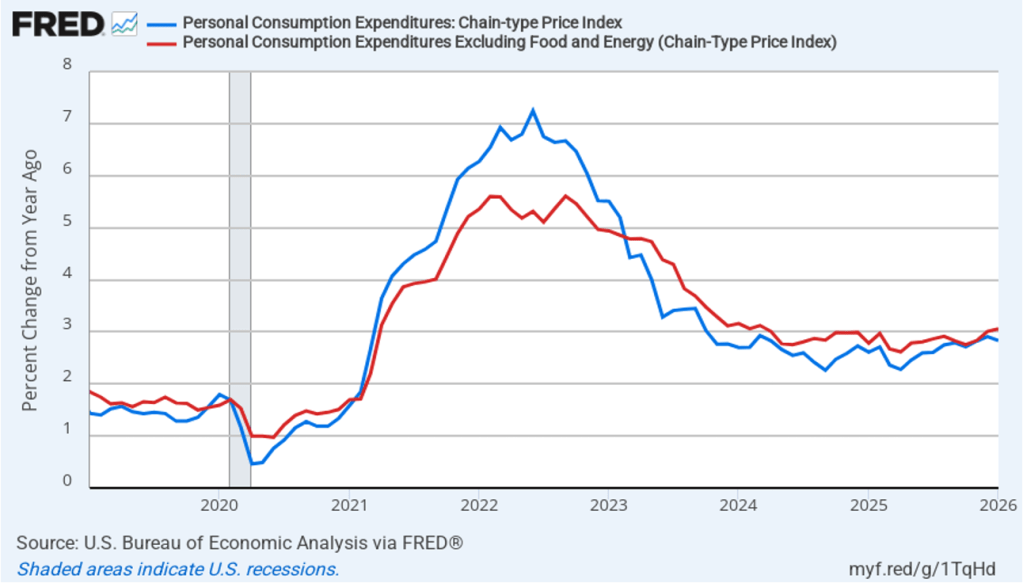
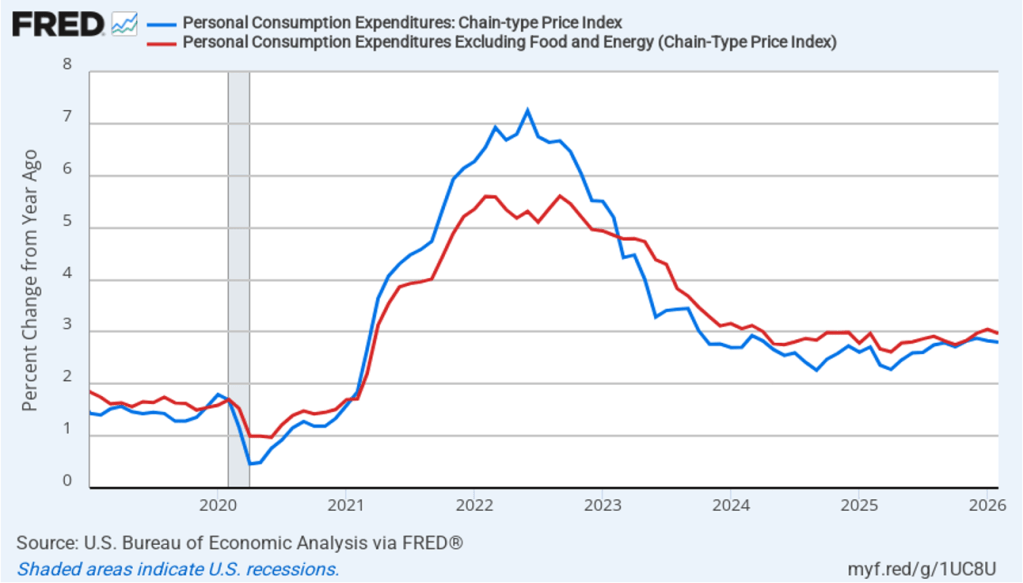
Turning now to PCE inflation for February. The following figure shows headline PCE inflation (the blue line) and core PCE inflation (the red line)—which excludes energy and food prices—with inflation measured as the percentage change in the PCE from the same month in the previous year. Headline PCE inflation was 2.8 percent in February, unchanged from January. Core PCE inflation was 3.0 percent in February, down slight from 3.1 percent in January . Headline inflation was slightly higher and core inflation was equal to the forecast of economists surveyed by FactSet.

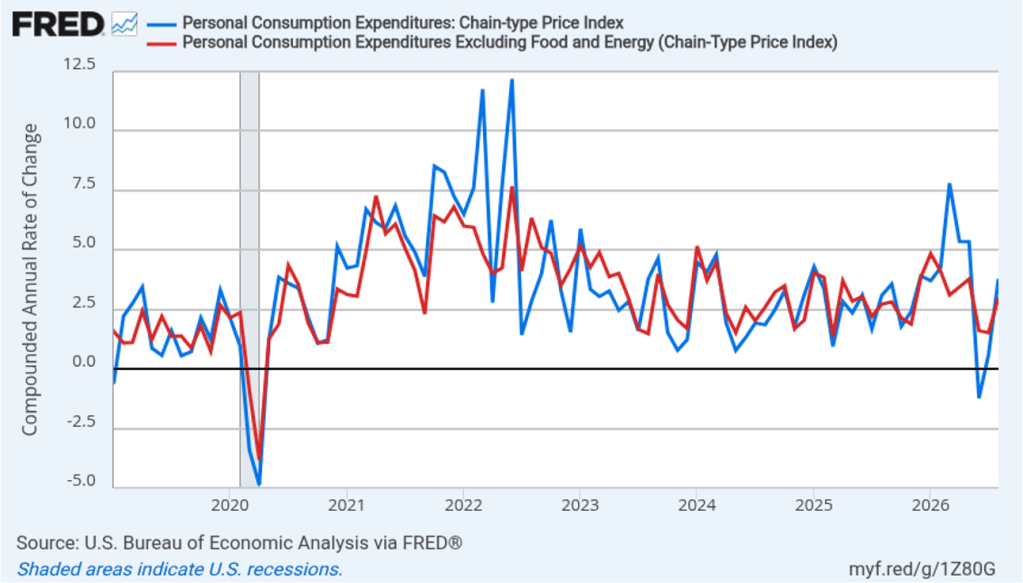
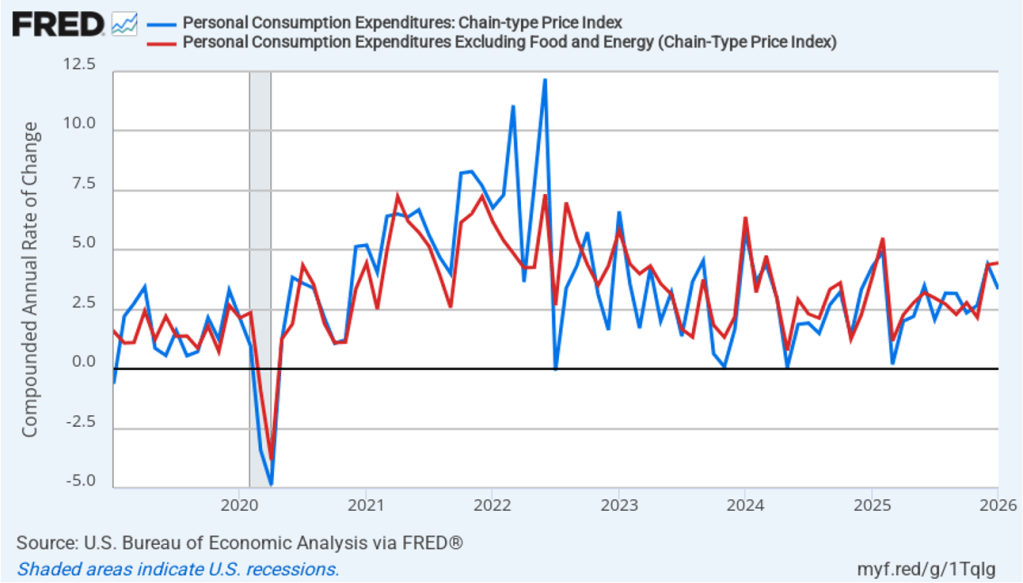
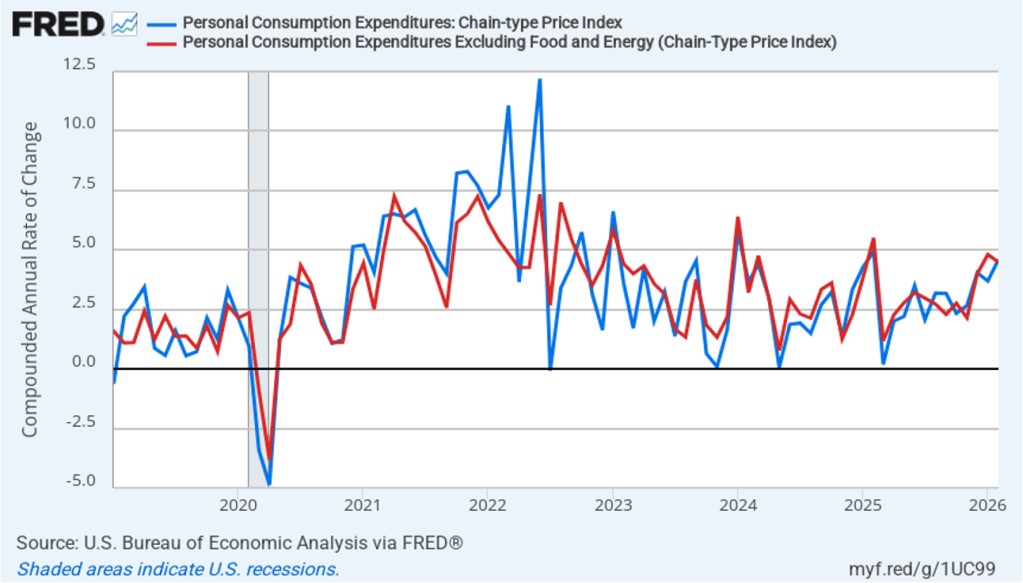
The following figure shows 1-month headline PCE inflation and core PCE. Measured this way, headline PCE inflation increased from 3.7 percent in January to 4.6 percent in February. Core PCE inflation declined from 4.8 percent in January to 4.5 percent in February. So, even before the effects of the escalation in energy prices, both 1-month and 12-month PCE inflation are telling the same story of inflation above the Fed’s target—well above in the case of 1-month inflation. These numbers raise significant concern about whether inflation was making progress toward the Fed’s 2 percent target even before the effects of the rise in energy prices.

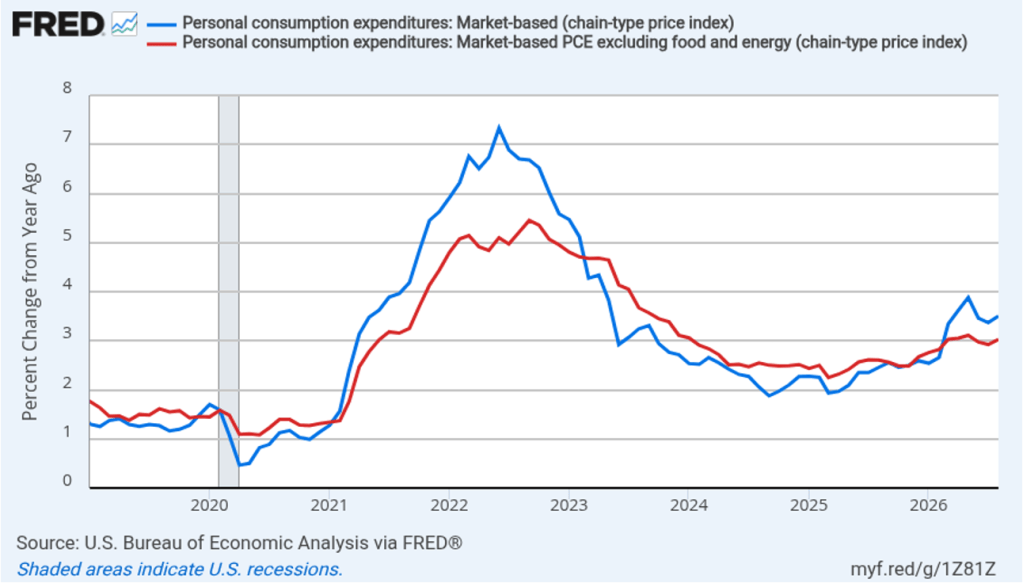
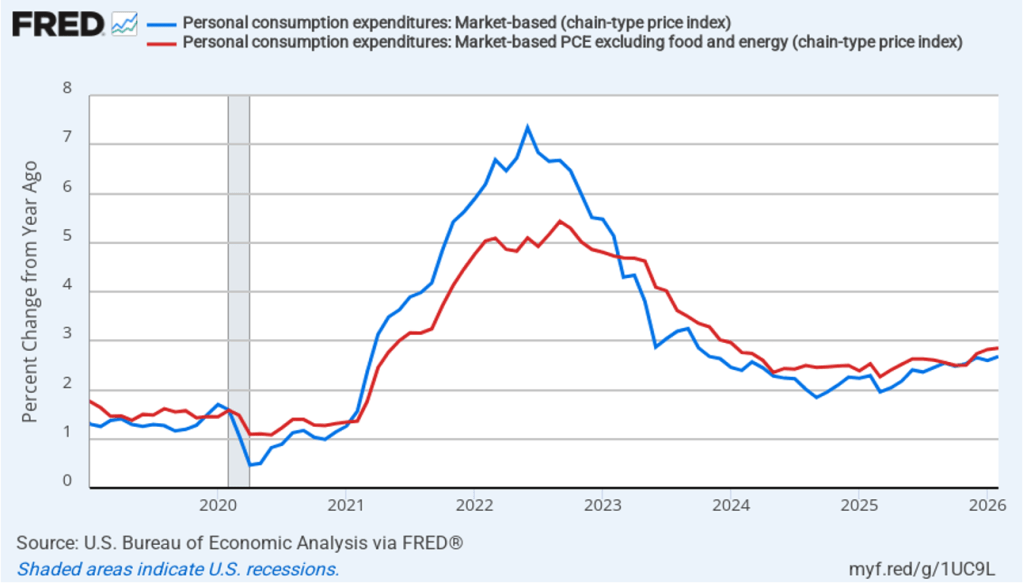
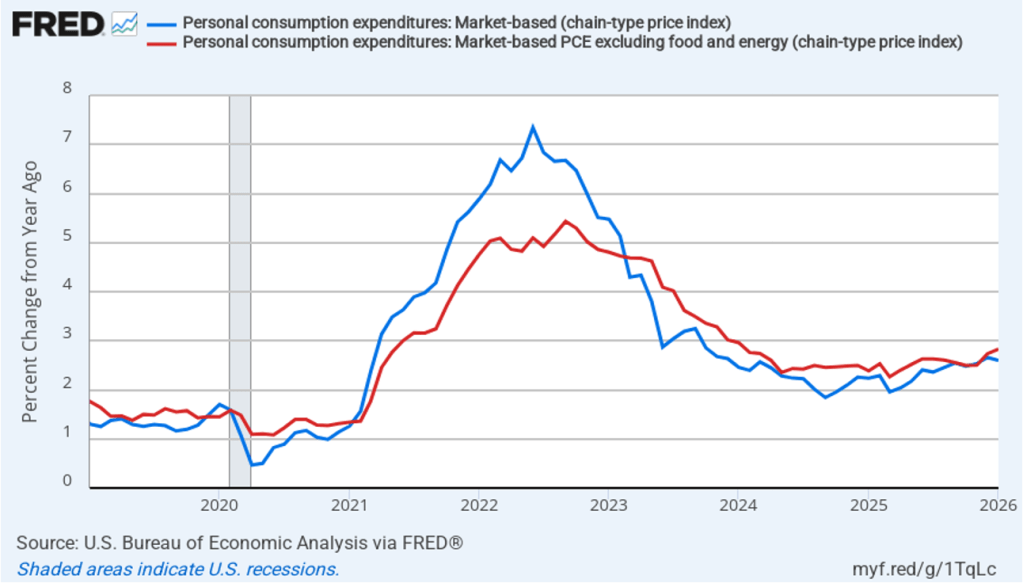
Fed Chair Jerome Powell has frequently mentioned that inflation in non-market services can skew PCE inflation. Non-market services are services whose prices the BEA imputes rather than measures directly. For instance, the BEA assumes that prices of financial services—such as brokerage fees—vary with the prices of financial assets. So that if stock prices rise, the prices of financial services included in the PCE price index also rise. Powell has argued that these imputed prices “don’t really tell us much about … tightness in the economy. They don’t really reflect that.” The following figure shows 12-month headline inflation (the blue line) and 12-month core inflation (the red line) for market-based PCE. (The BEA explains the market-based PCE measure here.)

Headline market-based PCE inflation was 2.7 percent in February, up slightly from 2.6 percent in January. Core market-based PCE inflation was 2.9 percent in February, up slightly from 2.8 percent in January. So, both market-based measures show inflation as stable but well above the Fed’s 2 percent target.

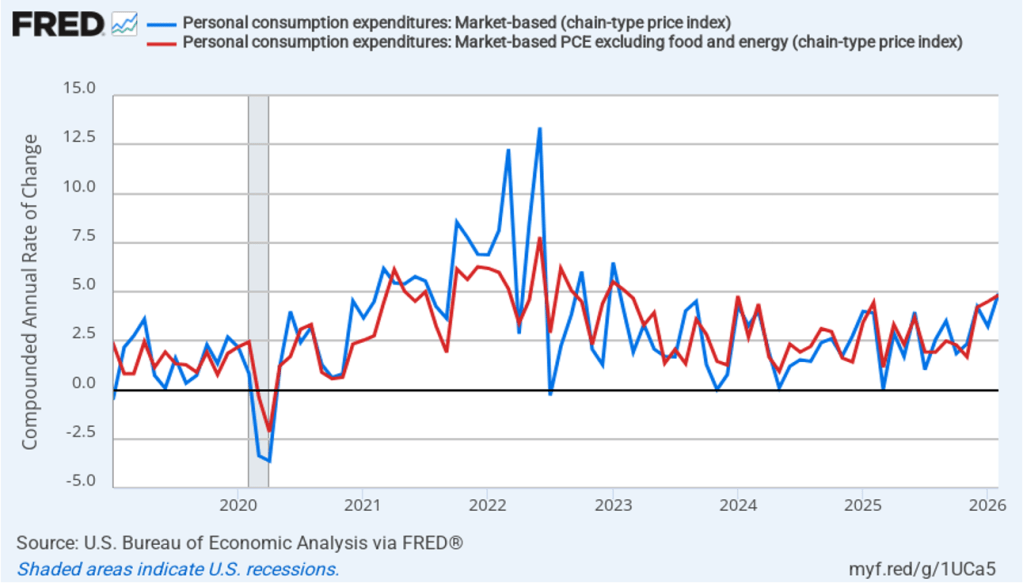
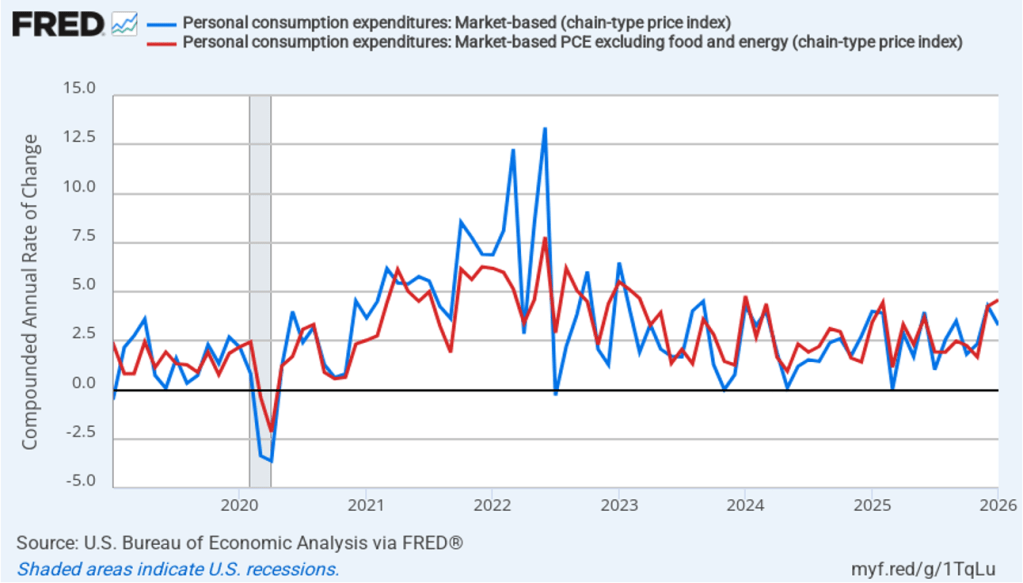
In the following figure, we look at 1-month inflation using these measures. One-month headline market-based inflation increased to 2.1 percent in November from 1.3 percent in October. One-month core market-based inflation fell to 1.3 percent in November from 2.0 percent in October. So, in November, 1-month market-based inflation was at or below the Fed’s annual inflation target. As the figure shows, the 1-month inflation rates are more volatile than the 12-month rates, which is why the Fed relies on the 12-month rates when gauging how close it is coming to hitting its target inflation rate.

What effect are these troubling inflation reports likely to have on the Fed’s policymaking Federal Open Market Committee (FOMC) at its next meeting on April 28–29—likely Jerome Powell’s last meeting as Fed chair? Economists generally recommend that central banks “look through”—that is, take no action—in response to a supply shock. A supply shock ordinarily results in a one-time increase in the price level, rather than a long-lasting increase in inflation. Fed policymakers, though, are aware that inflation has been running above their 2 percent target for more than five years. The possibility that even a temporary spike in inflation might result in a significant increase in the inflation rate that households and firms expect is a concern. At this point, investors in the federal funds futures market assign only a very small probability to the FOMC raising or lowering its target for the federal funds rate at the next several meetings. Following the next meeting, Powell will give his thoughts on these and other issues at a press conference.

Job Market Bounces Back from Weak Start to the Year

Image created by ChatGPT

This morning (April 3), the Bureau of Labor Statistics (BLS) released its “Employment Situation” report (often called the “jobs report”) for March. The report showed a stronger than expected increase in employment.

The jobs report has two estimates of the change in employment during the month: one estimate from the establishment survey, often referred to as the payroll survey, and one from the household survey. As we discuss in Macroeconomics, Chapter 9, Section 9.1 (Economics, Chapter 19, Section 19.1), many economists and Federal Reserve policymakers believe that employment data from the establishment survey provide a more accurate indicator of the state of the labor market than do the household survey’s employment data and unemployment data. (The groups included in the employment estimates from the two surveys are somewhat different, as we discuss in this post.)

According to the establishment survey, there was a net increase of 178,000 nonfarm jobs during March. Economists surveyed by the Wall Street Journal had forecast an increase of only 59,000 jobs.  Economists surveyed by FactSet had a similar forecast of a net increase of 60,000 jobs. The BLS revised downward its previous estimates of employment in January and February by a combined 7,000 jobs. (The BLS notes that: “Monthly revisions result from additional reports received from businesses and government agencies since the last published estimates and from the recalculation of seasonal factors.”)

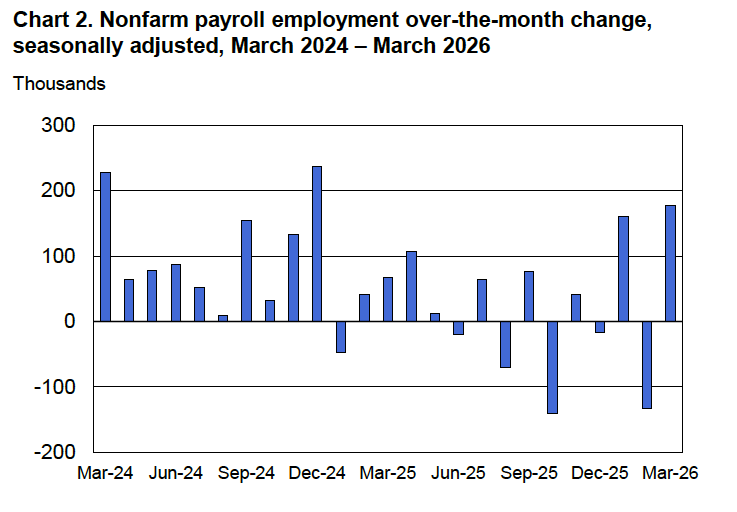
The following figure from the jobs report shows the net change in nonfarm payroll employment for each month in the last two years. The figure shows an unusual pattern in the job market since the middle of 2025 in which months of declining employment and months of increasing employment alternate.

These fluctuations of net employment gains around zero are consistent with a recent analysis from economists at the Federal Reserve Bank of Dallas that estimates the break-even rate of employment growth—the rate of employment growth at which the unemployment rate remains constant. They note that “continued net outflows of unauthorized immigrants, together with shifts in labor force participation, have pushed the monthly break-even employment growth lower than previously thought.” They conclude that: “The break-even rate [of employment growth] peaked at about 250,000 jobs per month in 2023, fell to roughly 10,000 by July 2025, and declined to near zero thereafter, averaging about –3,000 jobs per month from August to December 2025, indicating, if anything, a modest net jobs loss over this period.” In other words, in the current labor market, the break-even rate of employment growth may actually be negative.

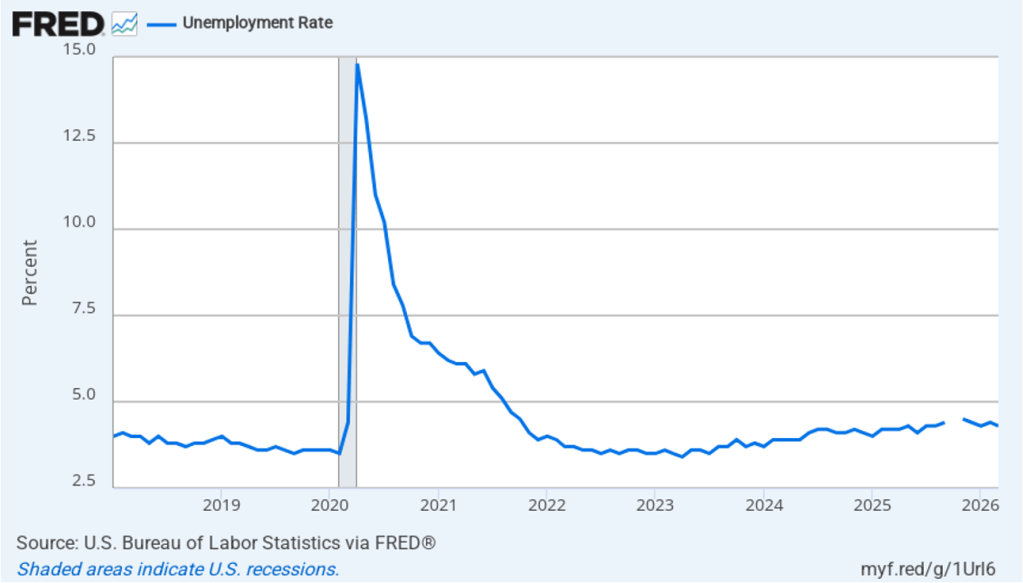
The unemployment rate, which is calculated from data in the household survey, declined from 4.4 percent in February for 4.3 percent in March. As the following figure shows, the unemployment rate has been remarkably stable over the past year and a half, staying between 4.0 percent and 4.4 percent in each month since May 2024. The Federal Open Market Committee’s current estimate of the natural rate of unemployment—the normal rate of unemployment over the long run—is 4.2 percent. So, unemployment is slightly above that estimate of the natural rate. (We discuss the natural rate of unemployment in Macroeconomics, Chapter 9 and Economics, Chapter 19.)

As the following figure shows, the monthly net change in jobs from the household survey moves much more erratically than does the net change in jobs from the establishment survey. As measured by the household survey, there was a net decrease of 64,000 in March. (Note that because of last year’s shutdown of the federal government, there are no data for October or November.) In any particular month, the story told by the two surveys can be inconsistent. In this case, the establishment survey shows a strong increase in net employment, while the household survey shows a decline. (In this blog post, we discuss the differences between the employment estimates in the two surveys.)

The household survey has another important labor market indicator: the employment-population ratio for prime age workers—those workers aged 25 to 54. In March the ratio was 80.7 percent, unchanged from February. The prime-age population ratio remains above its value for most of the period since 2001. The continued high levels of the prime-age employment-population ratio indicate some continuing strength in the labor market.

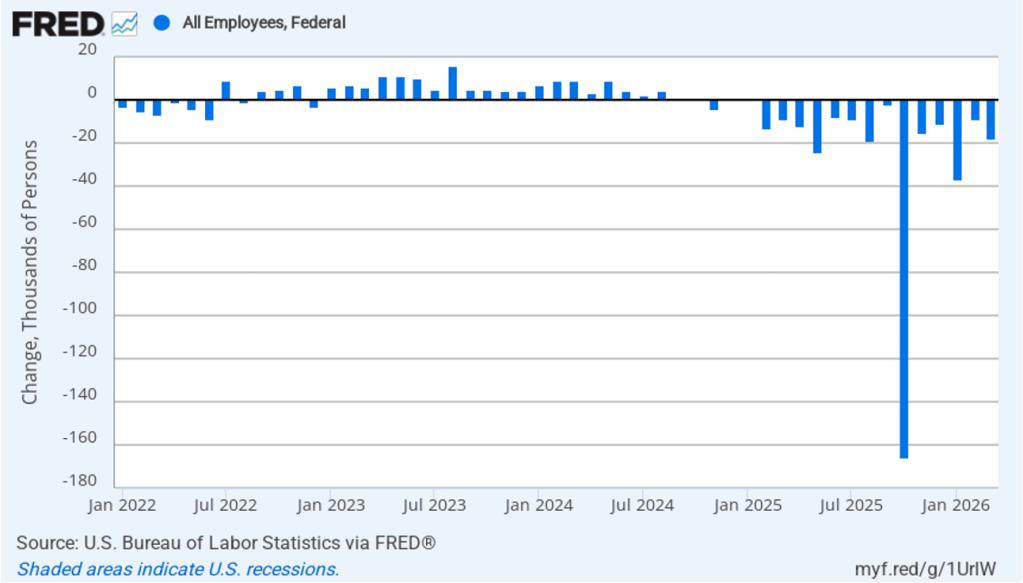
The Trump Administration’s layoffs of some federal government workers are clearly shown in the estimate of total federal employment for October, when many federal government employees exhausted their severance pay. (The BLS notes that: “Employees on paid leave or receiving ongoing severance pay are counted as employed in the establishment survey.”) As the following figure shows, there was a decline in federal government employment of 166,000 in October, with additional declines in the following five months. The total decline in federal government employment since the beginning of February 2025 is 352,000. But the decline has been slowing, with a net decrease of 18,000 jobs in March. So, the effect of layoffs of federal government workers is no longer a major factor in month-to-month changes in total employment.

The establishment survey also includes data on average hourly earnings (AHE). As we noted in this post, many economists and policymakers believe the employment cost index (ECI) is a better measure of wage pressures in the economy than is the AHE. The AHE does have the important advantage of being available monthly, whereas the ECI is only available quarterly. The following figure shows the percentage change in the AHE from the same month in the previous year. The AHE increased 3.5 percent in March, down from 3.8 percent in February.

The following figure shows wage inflation calculated by compounding the current month’s rate over an entire year. (The figure above shows what is sometimes called 12-month wage inflation, whereas this figure shows 1-month wage inflation.) One-month wage inflation is much more volatile than 12-month wage inflation—note the very large swings in 1-month wage inflation in April and May 2020 during the business closures caused by the Covid pandemic. In March, the 1-month rate of wage inflation was 2.9 percent, down from 4.6 percen in February. So both 12-month and 1-month wage inflation show wages increasing slowing.

What effect is this jobs report likely to have on the decisions of the Federal Reserve’s policymaking Federal Open Market Committee at its next meeting on April 28–29? Although employment growth has been slow in recent months, as noted earlier, even that slow rate may be close to the break-even rate of employment growth. So, it’s unlikely that the FOMC will see current conditions in the job market as warranting a cut in the committee’s target range for the federal funds rate. In addition, disruptions to the world oil market as a result of the conflict in Iran have caused oil prices to rise, putting upward pressure on the price level. These factors make it likely that the committee will keep its target range for the federal funds rate unchanged at its next meeting. 

The probability that investors in the federal funds futures market assign to the FOMC keeping its target rate unchanged at its April meeting was 99.5 percent this afternoon, only a slight decrease from 100.0 percent yesterday.

Real GDP Growth Revised Downward as PCE Inflation Is Slightly Lower than Expected

Image generated by ChatGPT

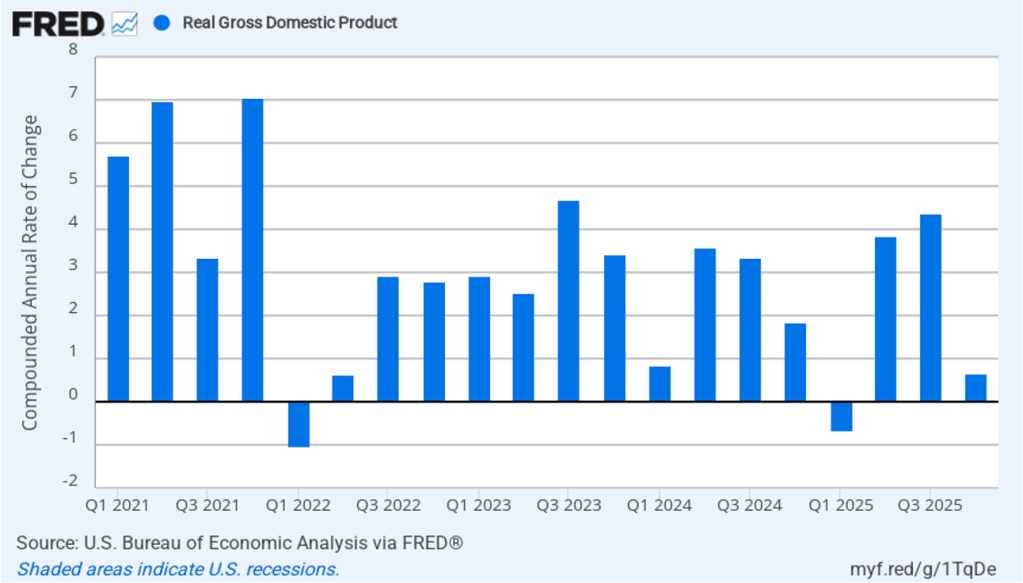
The Burea of Economic Analysis (BEA) released two reports this morning. One report included a revision of estimated growth in real GDP during the fourth quarter of 2025 from an advance estimate of 1.4 percent—which was already lower than had been expected—to 0.7 percent. Economists surveyed by the Wall Street Journal had expected that fourth quarter growth would be revised upward to 1.5 percent. The BEA’s “Personal Income and Outlays, January 2026” report indicated that the personal consumption expenditures (PCE) price index had increased 2.8 percent over the past year, slightly below the 2.9 percent that economists had expected.

The following figure shows the estimated rates of GDP growth in each quarter beginning with the first quarter of 2021.

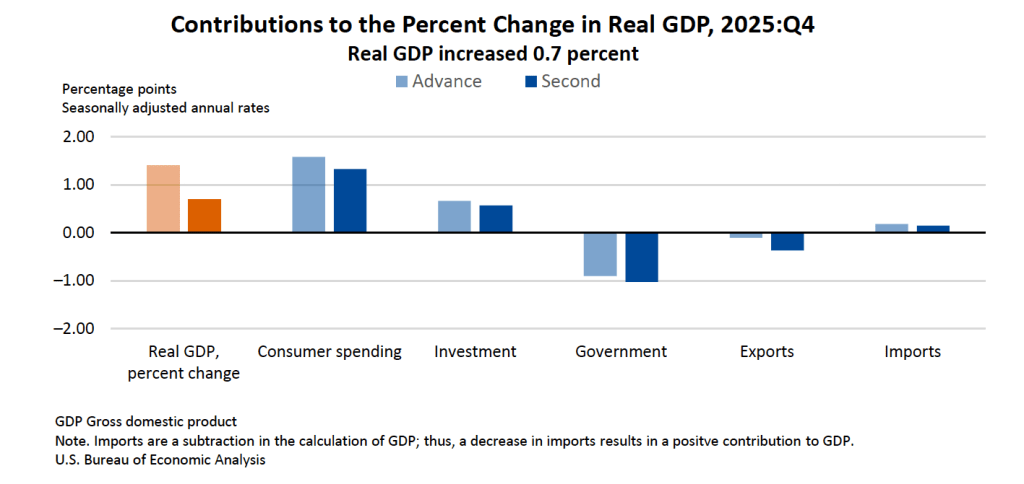
As the following figure—taken from the BEA report—shows, consumer spending, investment spending, government spending, and net exports were all revised downward from the original advance estimates. The decline in real government expenditures of –1.0 percent at an annual rate—revised downward from –0.9 percent—was  the most important factor contributing to the slowing growth in real GDP during the fourth quarter. The decline in government expenditures is largely attributable to the federal government shutdown, which lasted from October 1, 2025 to November 12, 2025.

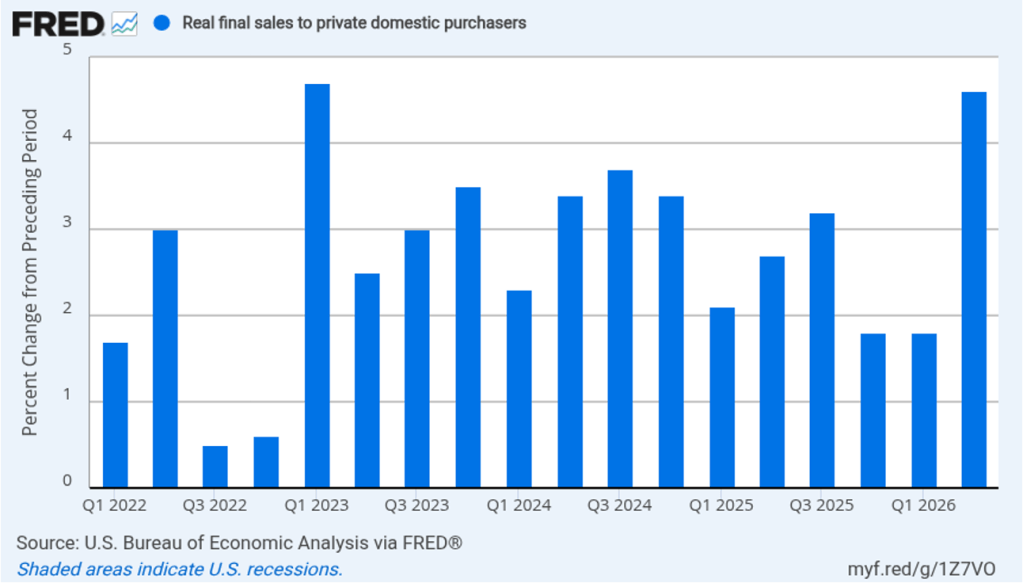
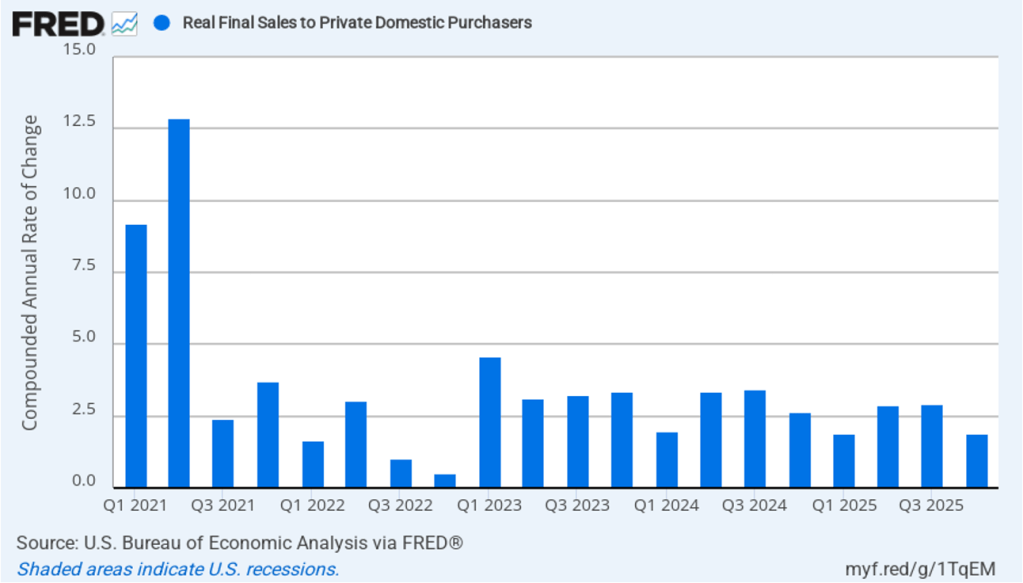
As we’ve discussed in previous blog posts, to better gauge the state of the economy, policymakers—including Fed Chair Jerome Powell—often prefer to strip out the effects of imports, inventory investment, and government expenditures—which can be volatile—by looking at real final sales to private domestic purchasers, which includes only spending by U.S. households and firms on domestic production. As the following figure shows, real final sales to domestic purchasers increased by 1.9 percent in the fourth quarter at an annual rate—revised downward from the advance estimate of 2.4 percent—which was well above the 0.9 percent increase in real GDP and slightly above the U.S. economy’s expected long-run annual real growth rate of 1.8 percent. Note also that real final sales to private domestic purchasers grew by 2.9 percent in the third quarter, during which real GDP grew by 4.4 percent, and by 1.9 percent in the first quarter of 2025, when real GDP declined by 0.6 percent. So this measure of output is more stable and likely is a better indicator of the underlying growth rate in the economy than is growth in real GDP.

The second BEA report this morning included monthly data on the personal consumption expenditures (PCE) price index for January 2026. The Fed relies on annual changes in the PCE price index to evaluate whether it’s meeting its 2.0 percent annual inflation target. The following figure shows headline PCE inflation (the blue line) and core PCE inflation (the red line)—which excludes energy and food prices— with inflation measured as the percentage change in the PCE from the same month in the previous year. In January 2026, headline PCE inflation was 2.8 percent, down slightly from 2.9 percent in December 2025 (which was also the inflation rate economists had expected for January 2026). Core PCE inflation in January was 3.1 percent, up slightly from 3.0 in December. Both headline PCE inflation and core PCE inflation remained above the Fed’s 2.0 percent annual inflation target.

The following figure shows headline PCE inflation and core PCE inflation calculated by compounding the current month’s rate over an entire year. (The figure above shows what is sometimes called 12-month inflation, while the figure below shows 1-month inflation.) Measured this way, headline PCE inflation declined to 3.4 percent in January, from to 4.4 percent in December. Core PCE inflation fell to 4.4 percent in January from 4.5 percent in December. Measured this way, both core and headline PCE inflation were well above the Fed’s target.


Fed Chair Jerome Powell has frequently mentioned that inflation in non-market services can skew PCE inflation. Non-market services are services whose prices the BEA imputes rather than measures directly. For instance, the BEA assumes that prices of financial services—such as brokerage fees—vary with the prices of financial assets. So that if stock prices fall, the prices of financial services included in the PCE price index also fall. Powell has argued that these imputed prices “don’t really tell us much about … tightness in the economy. They don’t really reflect that.” The following figure shows 12-month headline inflation (the blue line) and 12-month core inflation (the red line) for market-based PCE. (The BEA explains the market-based PCE measure here.)

Headline market-based PCE inflation was 2.6 percent in January, down from 2.7 percent in December. Core market-based PCE inflation was 2.8 percent in January, up from 2.7 in December. So, both market-based measures show inflation as stable but above the Fed’s 2 percent target.

In the following figure, we look at 1-month inflation using these measures. One-month headline market-based inflation was 3.3 percent in January, down from 4.3 percent in December. One-month core market-based inflation increased to 4.6 percent in January from 4.4 percent in December. As the figure shows, the 1-month inflation rates are more volatile than the 12-month rates, which is why the Fed relies on the 12-month rates when gauging how close it is coming to hitting its target inflation rate.

Today’s data arrive against the backdrop of the conflict in Iran. According to the AAA, gasoline prices have risen to an average of $3.63 per gallon from $2.94 a month ago. Assuming that the conflict is resolved relatively soon, that increase should have only a transitory effect on inflation. Chair Powell as indicated that he believes that the upward pressure of tariffs on the price level is also still working its way through the economy.

Recent macroeconomic data, along with the effects of tariffs and the conflict in Iran, make it unlikely that members of the Fed’s policymaking Federal Open Market Committee (FOMC) will reduce their target range for the federal funds rate any time soon. The probability that investors in the federal funds futures market assign to the FOMC keeping its target rate unchanged at its March 17–18 meeting decreased only slightly this afternoon to 99.1 percent from rom 99.9 percent yesterday. Investors don’t assign a greater than 50 percent probability to the FOMC cutting its federal funds rate target at any meeting before the meeting on October 27–28.

Surprising Decline in Employment in the February Jobs Report

Image created by ChatGPT

This morning (March 6), the Bureau of Labor Statistics (BLS) released its “Employment Situation” report (often called the “jobs report”) for February. The jobs report for January showed a much stronger than expected increase in employment. Today’s report was a surprise in the opposite direction with employment unexpectedly declining.

The jobs report has two estimates of the change in employment during the month: one estimate from the establishment survey, often referred to as the payroll survey, and one from the household survey. As we discuss in Macroeconomics, Chapter 9, Section 9.1 (Economics, Chapter 19, Section 19.1), many economists and Federal Reserve policymakers believe that employment data from the establishment survey provide a more accurate indicator of the state of the labor market than do the household survey’s employment data and unemployment data. (The groups included in the employment estimates from the two surveys are somewhat different, as we discuss in this post.)

According to the establishment survey, there was a net decrease of 92,000 nonfarm jobs during February. Economists surveyed by the Wall Street Journal had forecast an increase of 50,000 jobs.  Economists surveyed by FactSet had a higher forecast of a net increase of 70,000 jobs. The BLS revised downward its previous estimates of employment in December and January by a combined 69,000 jobs. The revised estimate indicates that employment fell in December by 17,000 rather than increasing by 48,000 as in the previous estimate. (The BLS notes that: “Monthly revisions result from additional reports received from businesses and government agencies since the last published estimates and from the recalculation of seasonal factors.”)

The following figure from the jobs report shows the net change in nonfarm payroll employment for each month in the last two years. The current estimates show a net decrease in employment during five of the last nine months.

The unemployment rate, which is calculated from data in the household survey, increased to 4.4 percent in February for 4.3 percent in January. As the following figure shows, the unemployment rate has been remarkably stable over the past year and a half, staying between 4.0 percent and 4.4 percent in each month since May 2024. The Federal Open Market Committee’s current estimate of the natural rate of unemployment—the normal rate of unemployment over the long run—is 4.2 percent. So, unemployment is slightly above that estimate of the natural rate. (We discuss the natural rate of unemployment in Macroeconomics, Chapter 9 and Economics, Chapter 19.)

As the following figure shows, the monthly net change in jobs from the household survey moves much more erratically than does the net change in jobs from the establishment survey. As measured by the household survey, there was a net decrease of 185,000 in February. (Note that because of last year’s shutdown of the federal government, there are no data for October or November.) In any particular month, the story told by the two surveys can be inconsistent. In this case, both surveys indicate a net decline in employment. (In this blog post, we discuss the differences between the employment estimates in the two surveys.)

The household survey has another important labor market indicator: the employment-population ratio for prime age workers—those workers aged 25 to 54. In February the ratio was 80.7 percent, down slightly from 80.8 percent in January. The prime-age population ratio remains above its value for most of the period since 2001. The continued high levels of the prime-age employment-population ratio indicate some continuing strength in the labor market.

The Trump Administration’s layoffs of some federal government workers are clearly shown in the estimate of total federal employment for October, when many federal government employees exhausted their severance pay. (The BLS notes that: “Employees on paid leave or receiving ongoing severance pay are counted as employed in the establishment survey.”) As the following figure shows, there was a decline in federal government employment of 166,000 in October, with additional declines in the following four months. The total decline in federal government employment since the beginning of February 2025 is 327,000. But the decline has been slowing, with a net decrease of 10,000 jobs in February.

The establishment survey also includes data on average hourly earnings (AHE). As we noted in this post, many economists and policymakers believe the employment cost index (ECI) is a better measure of wage pressures in the economy than is the AHE. The AHE does have the important advantage of being available monthly, whereas the ECI is only available quarterly. The following figure shows the percentage change in the AHE from the same month in the previous year. The AHE increased 3.8 percent in February, up slightly from 3.7 percent in January.

The following figure shows wage inflation calculated by compounding the current month’s rate over an entire year. (The figure above shows what is sometimes called 12-month wage inflation, whereas this figure shows 1-month wage inflation.) One-month wage inflation is much more volatile than 12-month wage inflation—note the very large swings in 1-month wage inflation in April and May 2020 during the business closures caused by the Covid pandemic. In February, the 1-month rate of wage inflation was 5.0 percent, unchanged from January. This high rate of wage growth is surprising given the decline in employment. But two month’s data from such a volatile series may not accurately reflect longer-run trends in wage inflation.

What effect is this weak jobs report likely to have on the decisions of the Federal Reserve’s policymaking Federal Open Market Committee at its next meeting on March 17–18? Taken by itself, employment having fallen in five of the last nine months might be expected to cause the committee to cut its target range for the federal funds rate. But disruptions to the world oil market as a result of the U.S. and Israeli bombing campaign in Iraq have caused oil prices to rise, putting upward pressure on the price level. In addition, wage growth in the United States appears higher than is consistent with price inflation returning to the Fed’s 2 percent annual target. These factors make it likely that the committee will keep its target range for the federal funds rate unchanged at its next meeting.

The probability that investors in the federal funds futures market assign to the FOMC keeping its target rate unchanged at its March meeting was largely unchanged this morning at 95.6 percent, only a slight decrease from 96.3 percent yesterday.

Surprisingly Strong Jobs Report Accompanied by a Large Downward Annual Benchmark Revision

Image created by ChatGPT

This morning (February 11), the Bureau of Labor Statistics (BLS) released its “Employment Situation” report (often called the “jobs report”) for January. The report was originally scheduled to be released last Friday but was postponed by the brief federal government shutdown. The data in the report show that the labor market was much stronger than expected in January. 

The jobs report has two estimates of the change in employment during the month: one estimate from the establishment survey, often referred to as the payroll survey, and one from the household survey. As we discuss in Macroeconomics, Chapter 9, Section 9.1 (Economics, Chapter 19, Section 19.1), many economists and Federal Reserve policymakers believe that employment data from the establishment survey provide a more accurate indicator of the state of the labor market than do the household survey’s employment data and unemployment data. (The groups included in the employment estimates from the two surveys are somewhat different, as we discuss in this post.)

According to the establishment survey, there was a net increase of 130,000 nonfarm jobs during January. This increase was well above the increase of 55,000 that economists surveyed by the Wall Street Journal had forecast.  Economists surveyed by Bloomberg had a higher forecast of 65,000 net jobs. The BLS revised downward its previous estimates of employment in November and December by a combined 17,000 jobs. (The BLS notes that: “Monthly revisions result from additional reports received from businesses and government agencies since the last published estimates and from the recalculation of seasonal factors.”)

The following figure from the jobs report shows the net change in nonfarm payroll employment for each month in the last two years. The increase in net jobs in January was the largest since December 2024.

The unemployment rate, which is calculated from data in the household survey, fell from 4.4 percent in December to 4.3 percent in January. As the following figure shows, the unemployment rate has been remarkably stable over the past year and a half, staying between 4.0 percent and 4.4 percent in each month since May 2024. The Federal Open Market Committee’s current estimate of the natural rate of unemployment—the normal rate of unemployment over the long run—is 4.2 percent. So, unemployment is slightly above the natural rate. (We discuss the natural rate of unemployment in Macroeconomics, Chapter 9 and Economics, Chapter 19.)

As the following figure shows, the monthly net change in jobs from the household survey moves much more erratically than does the net change in jobs from the establishment survey. As measured by the household survey, there was a net increase of 528,000 in January, far above the increase in jobs from the payroll survey. (Note that because of last year’s shutdown of the federal government, there are no data for October or November.) In any particular month, the story told by the two surveys can be inconsistent. In this case, both surveys indicate unexpectedly strong job growth, with the increase in household employment being particularly strong. (In this blog post, we discuss the differences between the employment estimates in the two surveys.)

The household survey has another important labor market indicator: the employment-population ratio for prime age workers—those workers aged 25 to 54. In January the ratio was 80.9 percent, the highest since September 2024. In addition to matching the recent highs reached in mid-2024, the prime-age employment-population ratio is above what the ratio was in any month since April 2001. The continued high levels of the prime-age employment-population ratio indicates some continuing strength in the labor market.

The Trump Administration’s layoffs of some federal government workers are clearly shown in the estimate of total federal employment for October, when many federal government employees exhausted their severance pay. (The BLS notes that: “Employees on paid leave or receiving ongoing severance pay are counted as employed in the establishment survey.”) As the following figure shows, there was a decline federal government employment of 166,000 in October, with additional declines in the following three months. The total decline in federal government employment since the beginning of February 2025 is 324,000.

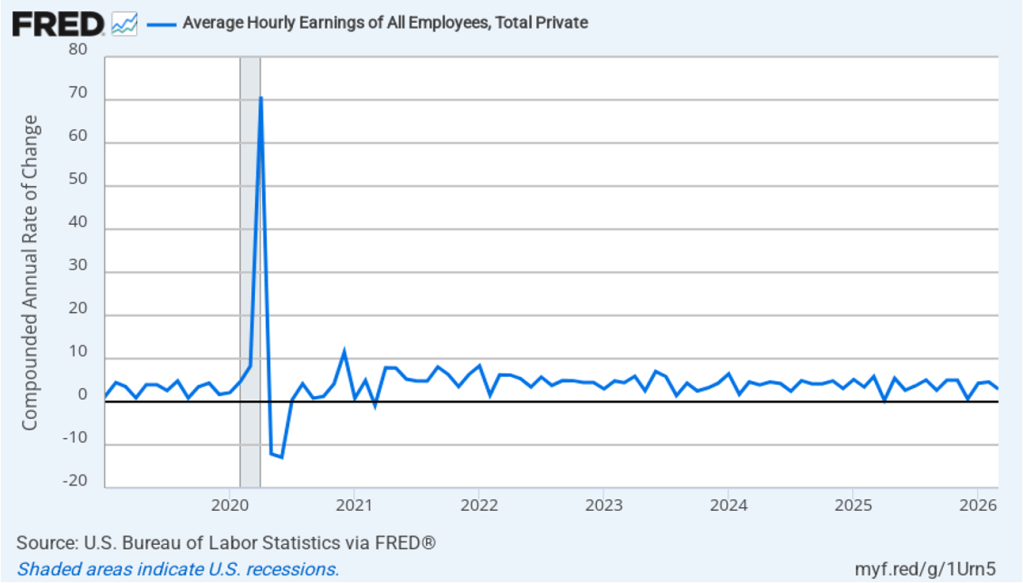
The establishment survey also includes data on average hourly earnings (AHE). As we noted in this post, many economists and policymakers believe the employment cost index (ECI) is a better measure of wage pressures in the economy than is the AHE. The AHE does have the important advantage of being available monthly, whereas the ECI is only available quarterly. The following figure shows the percentage change in the AHE from the same month in the previous year. The AHE increased 3.7 percent in January, the same as in December.

The following figure shows wage inflation calculated by compounding the current month’s rate over an entire year. (The figure above shows what is sometimes called 12-month wage inflation, whereas this figure shows 1-month wage inflation.) One-month wage inflation is much more volatile than 12-month wage inflation—note the very large swings in 1-month wage inflation in April and May 2020 during the business closures caused by the Covid pandemic. In January, the 1-month rate of wage inflation was 5.0 percent, up from 0.7 percent in December. This increase in wage growth may be an indication of a strengthening labor market. But one month’s data from such a volatile series may not accurately reflect longer-run trends in wage inflation.

In today’s jobs report, the BLS also included its final annual benchmark revision to the establishment employment data. (We discussed the preliminary annual revision in this blog post last September.) The following table from the jobs report indicates that the revision was quite substantial. The revised estimate of payroll employment is 1,029,000 jobs lower than the original estimate. The increase in total nonfarm employment in 2025 was revised down to only 181,000 from the original estimate of 584,000. Leaving aside the collapse in employment in 2020 during the Covid pandemic, job growth in 2025 was the slowest since 2010 in the immediate aftermath of the Great Recession of 2007–2009.

Despite the large downward revision to job growth in 2025, the strong job growth for January in today’s jobs report makes it unlikely that the Federal Reserve’s policymaking Federal Open Market Committee (FOMC) will lower its target for the federal funds rate at its next meeting on March 17–18. The probability that investors in the federal funds futures market assign to the FOMC keeping its target rate unchanged at that meeting jumped from 79.9 percent yesterday to 92.1 percent after the release of today’s jobs report.