How Should We Measure the Underlying Inflation Rate?

Photo of a meeting of the Federal Open Market Committee earlier this year from federalreserve.gov

What’s inflation? The answer seems easy: Inflation means that prices are rising …. but there are complications. When we experience inflation, does every price rise? If not, does it matter which prices or how many prices are rising? If a price rises one month and falls the next, is that still inflation?

We answer these questions in Macroeconomics, Chapter 19. As we discuss in that chapter, we measure inflation as the increase in the price level from one year to the next. We focus on the price level rather than on the prices of any particular goods or services because we want to know what is happening to a measure of average prices. Because we are looking at an average of prices, we would expect that when the economy experiences inflation, some prices will rise, but other prices may fall, and some prices may be unchanged.

Put another way, when we measure inflation, we are asking a macroeconomic question: Are there forces in the economy that are making an average of prices increase, and if so, by how much? When we look at individual prices, we are typically asking microeconomic questions: How much will an outbreak of avian flu increase the price of eggs? How much will a surge in constructing data centers increase the price of computer chips? Microeconomic developments do sometimes affect our inflation measures. For example, if conflict in the Middle East disrupts the flow of oil, raising oil prices, the effect may be large enough to increase the price level.

Image created by ChatGPT of oil tankers passing through the Strait of Hormuz

The two most closely watched measures of the price level are the consumer price index (CPI), which is compiled monthly by the Bureau of Labor Statistics (BLS), and the personal consumption expenditures (PCE) price index, which is compiled monthly by the Bureau of Economic Analysis (BEA). Economists and Federal Reserve policymakers prefer the PCE measure of the price level because it includes more goods and services than does the CPI.  Each month’s release of CPI and PCE data can help answer three questions:

  1. How much inflation are consumers experiencing?
  2. How well is the Federal Reserve meeting its mandate from Congress to achieve price stability?
  3. How likely is inflation to persist?

The public’s strongly negative reaction to the Covid-era surge in inflation that began in the spring of 2021 made it clear that high inflation rates were an important political issue. The persistence of inflation rates above the Fed’s 2 percent annual target caused “affordability” to be an important issue in the 2026 midterm elections in the United States.

The CPI is designed to answer question 1. Although the inflation any individual household experiences will depend on the particular mix of goods and services consumed, the percentage change in the CPI provides a good measure of the inflation experienced by the typical household. The Fed answers question 2. using the percentage change in the PCE from the same month in the previous year. Fed policymakers have met the Congressional mandate for stable prices if the annual inflation rate as measured by the PCE is 2 percent or less. (Note that there is some debate whether 2 percent inflation represents “price stability” in the way Congress intended.)

Question 3. is the most difficult to answer. Future inflation rates depend partly on macroeconomic policy, particularly monetary policy, and on geopolitical developments, such as the likelihood that conflict in the Middle East will be resolved or will accelerate. But the details of how particular prices have been changing can also provide clues as to how persistent inflation is likely to be. Federal statistical agencies, economists, and policymakers make adjustments to the CPI and PCE with the aim of better identifying the underlying rate of inflation—that is, the movement in average prices after eliminating prices that may be increasing or decreasing for short-run, microeconomic reasons.

The best-known adjustments to the CPI and PCE are the core measures that exclude the prices of food and energy. The BLS began issuing a monthly measure of core CPI in 1977 and the BEA began issuing a monthly measure of core PCE in 2000, although it had been compiling a similar measure since 1974.

Image created by ChatGPT

The BLS explains why it began issuing data on core CPI:

“Food and especially energy have been more volatile in recent years than almost everything else in the CPI, and their sharp short-term movements up and down can dominate the movement of the All items [CPI] index, obscuring longer term underlying trends or important changes in other categories. … Inflation due largely to higher food or energy prices might have different policy implications than broader inflation.”

Fed policymakers have looked at a number of other ways to adjust the PCE to gauge the underlying inflation rate. For example, as we discuss in a recent blog post, Fed policymakers believe that inflation in non-market services can skew PCE inflation. Non-market services are services whose prices the BEA imputes rather than measures directly. For instance, the BEA assumes that prices of financial services—such as brokerage fees—vary with the prices of financial assets. So that if stock prices rise, the prices of financial services included in the PCE price index also rise. Former Fed Chair Jerome Powell has argued that these imputed prices “don’t really tell us much about … tightness in the economy. They don’t really reflect that.”

Image created by ChatGPT of Kevin Warsh testifying before the Senate Banking Committee

At his confirmation hearing before the Senate Banking Committee, Fed Chair Kevin Warsh, addressed the issue of determining the underlying inflation rate:

“What I’m most interested in is, what’s the underlying inflation rate? Not what’s the one time change in prices because of a change in geopolitics or a change in beef, but what’s the underlying generalized change in prices in the economy? … The measures I prefer are looking at things that are called trimmed averages, where we take out all of the tail risks, all of the one-off items, and we ask ourselves whether the generalized change in prices is having second order effects on the economy. … Some in the economics profession are increasingly looking to these median type measures ….”

As we’ve discussed in previous blog posts, two widely available measures of the type Warsh is referring to are:

  1. Trimmed-mean PCE inflation, which drops the 31 percent of goods and services with the highest inflation rates and the 24 percent of goods and services with the lowest inflation rates, and
  2. Median PCE inflation, which is calculated by listing the inflation rate in each individual good or service included in the PCE and identifying the inflation rate of the good or service that is in the middle of the list—that is, the inflation rate in the price of the good or service that has an equal number of higher and lower inflation rates.

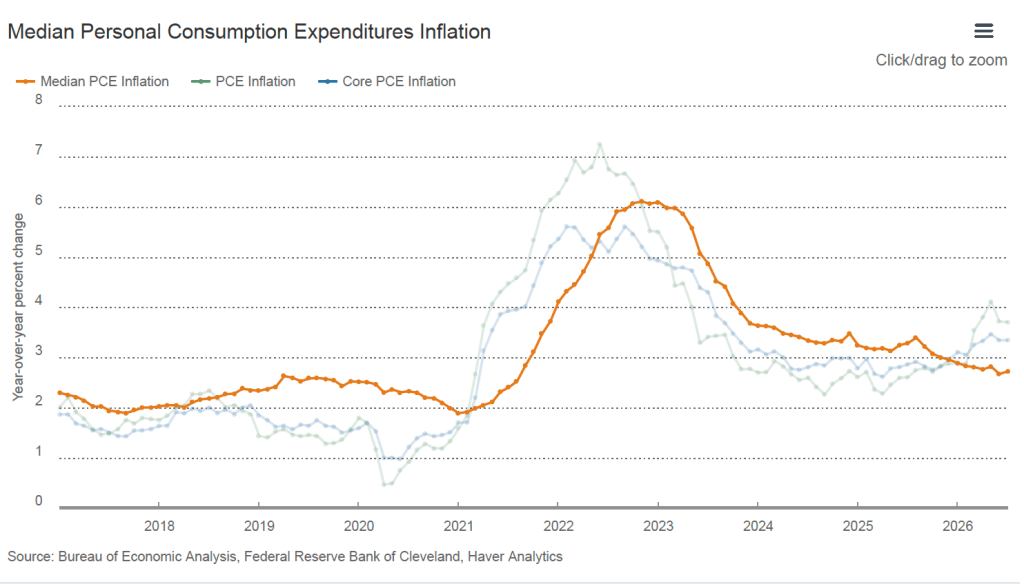
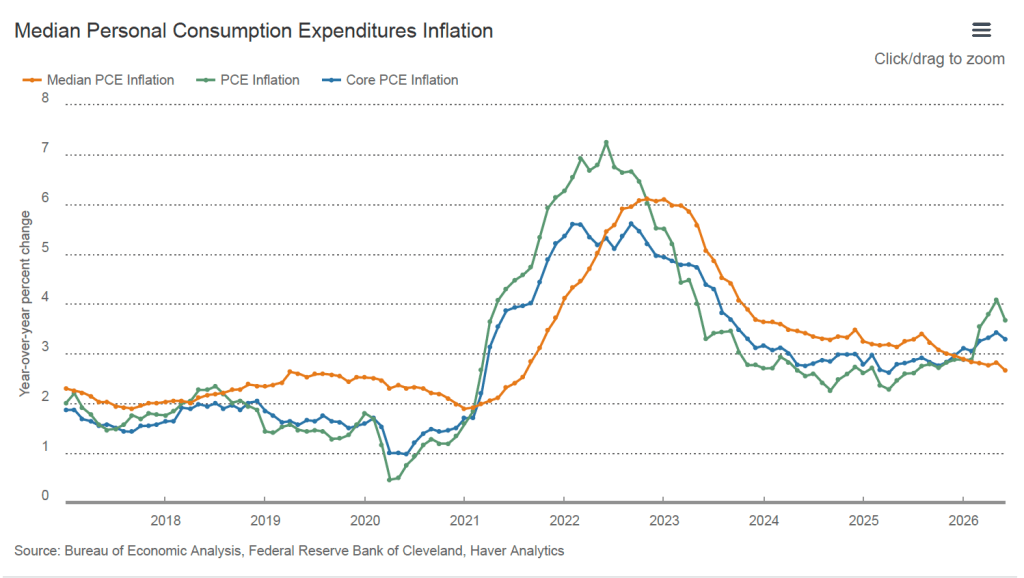
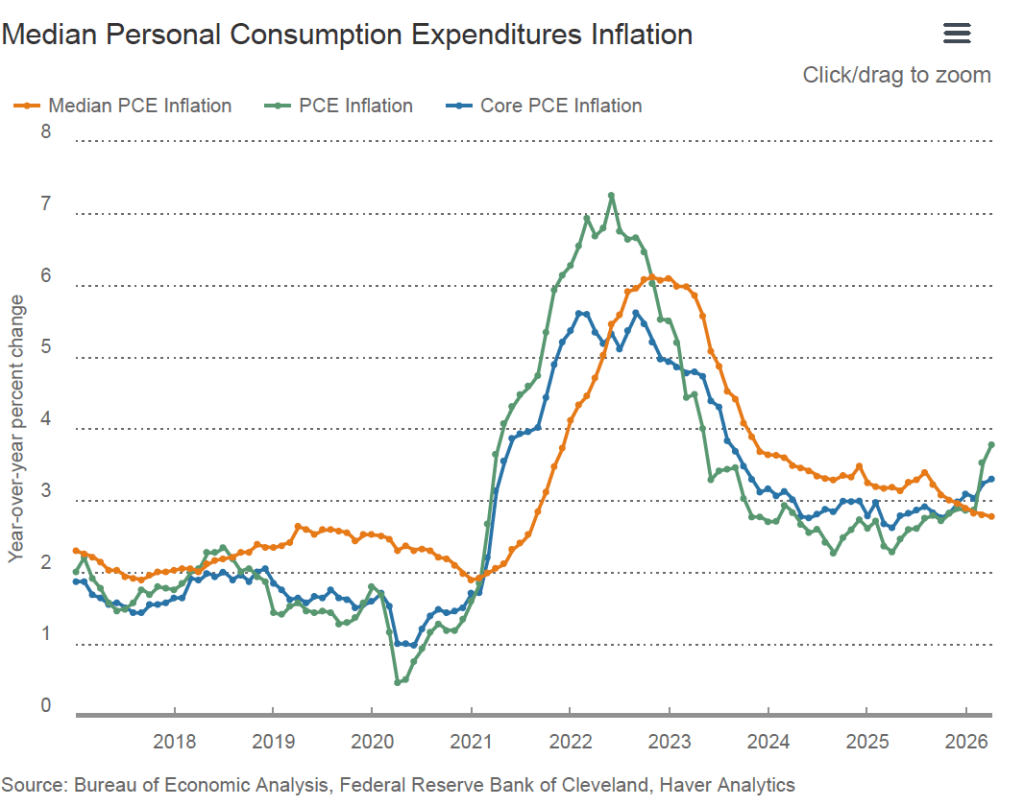
The following figure, from the website of the Federal Reserve Bank of Cleveland shows the relationship of headline PCE inflation (the green line), core PCE inflation (the blue line), and median PCE inflation (the brown line). Since March 2026, median inflation has been below both headline and core inflation, which may indicate that it is a better indicator of underlying inflation in the months since the conflict in the Middle East intensified.
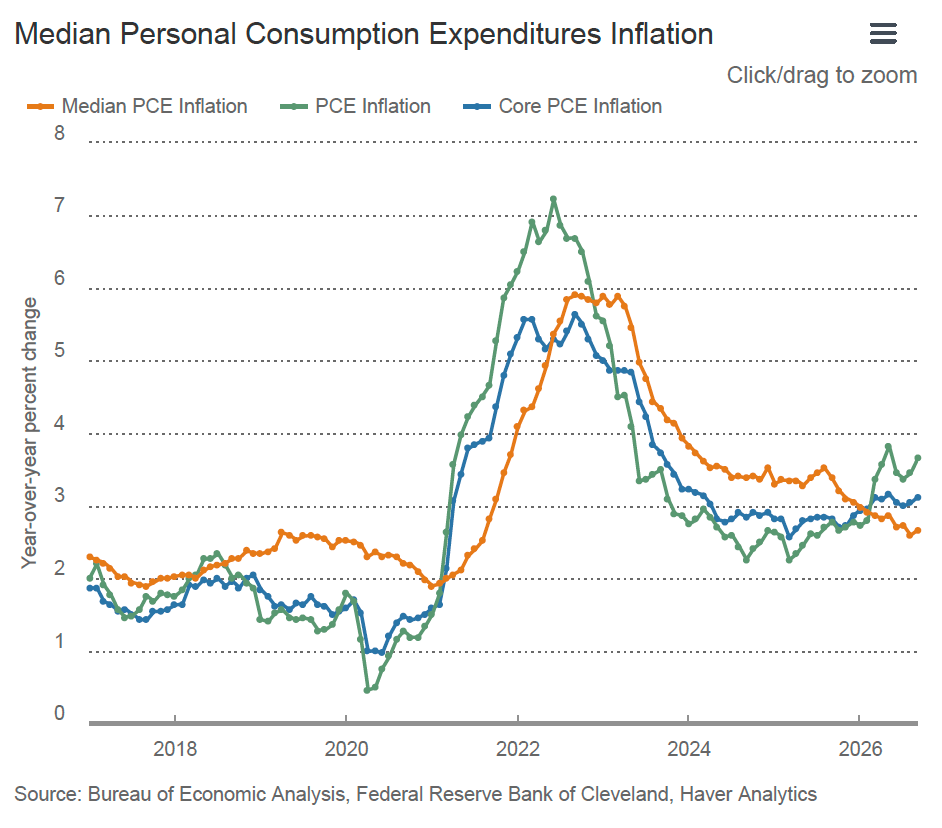
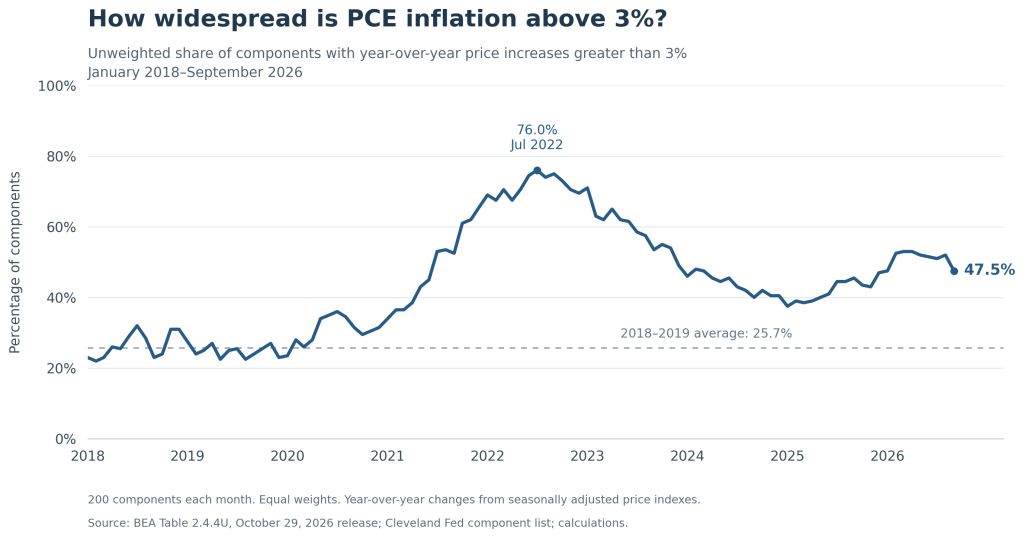
In an address in August at the Federal Reserve Bank of Kansas City’s economic policy symposium in Jackson Hole, Wyoming, Warsh discussed a less familiar indicator of underlying inflation: “To try to gauge underlying inflation, I find it instructive to disaggregate the 199 individual components of the PCE price measure. Over the past 12 months, 54 percent of goods and services in the PCE basket showed price increases above 3 percent. This is well below the post-pandemic highs of about 77 percent, but it remains well above the level of 32 percent in the two decades that preceded the pandemic.”

Image created by ChatGPT

The following figure shows for each month from January 2018 through September 2026, the fraction of PCE components that experienced price increases of greater than 3 percent. For instance, prices included in the PCE component “Personal computers/tablets and peripheral equipment” increased 9.7 percent from September 2025 to September 2026, while prices in the PCE component “Telephone and related communication equipment” decreased by 12.7 percent over the same period. The figure confirms Warsh’s statement: During 2018 and 2019, when headline PCE inflation was less than 2 percent in most months, 25.7 percent of PCE components experienced price increases of more than 3 percent, while in September 2026, 47.5 percent did.
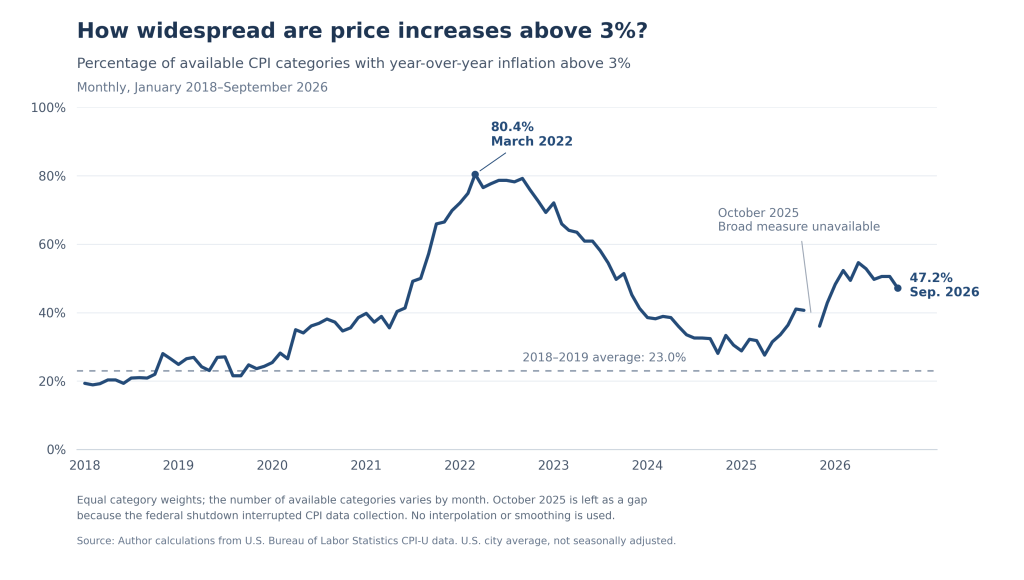
As the following figure shows, we get a similar result if we plot the same indicator for the CPI.
So, we have a number of ways of attempting to measure the underlying inflation rate. The reason, once again, why Fed policymakers are concerned about the underlying inflation rate rather than just the headline inflation rate is that monetary policy is better equipped to respond to movements in the underlying inflation rate than it is to respond to blips in the headline inflation rate that may be caused by transitory factors such as a sharp increase or decrease in energy prices.

Which measure of underlying inflation might be best? Here is ChatGPT’s (very long!) analysis.

ChatGPT on measures of underlying inflation

The three approaches answer different questions. A trimmed mean or median estimates a central rate of price increase after limiting the influence of unusually large increases and decreases. The percentage of categories rising more than 3% measures how widespread relatively rapid price increases are. My preference would be to use a trimmed mean and a median to assess the underlying inflation rate, and breadth to assess how generalized the pressure is.

The distinction matters because these measures can move in different directions without either being incorrectly calculated.

1. What each measure is trying to tell us

It helps to distinguish the measured change in the overall price index from indicators intended to extract a more persistent signal.

MeasureMain question it answersPrincipal strengthPrincipal limitation
Headline inflationHow much did the full price index increase?Includes the entire consumption basketLarge movements in a few components can obscure the broader trend
Conventional core inflationHow much did prices excluding food and energy increase?Simple, familiar, and consistently definedExcludes some informative movements while retaining large movements elsewhere
Trimmed meanWhat is the average increase among components in the middle of the price-change distribution?Reduces sensitivity to extremes while preserving information about the size of central price changesResults depend on trimming choices; excluded movements can contain useful information
MedianWhat price increase lies at the expenditure-weighted midpoint?Strong protection against unusually large increases and decreasesDiscards most information about the rest of the distribution
Share above 3%How much of the basket—or how many categories—has inflation above a chosen threshold?Makes the breadth of faster price increases easy to seeDoes not measure how far above or below the threshold prices are rising

The first conceptual caution is that an outlying price increase is not necessarily an error or a temporary disturbance. It can be a genuine, persistent change in a relative price. Removing its influence may help estimate the common inflation trend, but it also removes part of what consumers are paying.

A simple illustration

Suppose a hypothetical fixed-weight basket contains ten equally weighted categories. For illustration, calculate a trimmed mean by dropping the highest and lowest observations. All changes refer to the same period.

Category price changesFull-basket averageTrimmed meanMedianShare above 3%
All ten rise 2%2%2%2%0%
Nine rise 2%; one rises 22%4%2%2%10%
Nine rise 4%; one falls 16%2%4%4%90%

These are hypothetical calculations, not the precise construction of any published index.

The second row captures the usual argument for robust inflation measures: one exceptionally large increase raises the average even though most categories are rising moderately.

The third row is equally important. One exceptionally large decline can hold down headline inflation while most prices rise rapidly. Median and trimmed mean measures can therefore indicate more inflation pressure than the headline measure. Their purpose is to reduce the influence of both tails, rather than systematically produce a lower number.

2. Trimmed mean: a useful compromise between robustness and information

A trimmed mean ranks component price changes and removes a specified portion from each end of the distribution. It averages the remaining changes using their expenditure weights.

The precise implementation matters:

  • The Dallas Fed trimmed mean PCE removes 24% of expenditure weight from the lower tail and 31% from the upper tail, retaining the middle 45%.
  • The Cleveland Fed 16% trimmed mean CPI removes 8% of expenditure weight from each tail, retaining the middle 84%.

These are percentages of expenditure weight, not percentages of the number of category names. They are also quite different degrees of trimming, so “the trimmed mean” does not identify a unique estimator. Sources: Dallas methodologyand Cleveland methodology.

Advantages

It adapts to where the unusual movements occur. Conventional core inflation always excludes food and energy. A trimmed mean instead excludes whichever components have the most extreme changes that month. Food or energy can remain in the calculation when their changes are near the middle; a large movement elsewhere can be removed.

That is attractive because the economic reason for discounting a price movement is generally its usefulness as a signal of continuing inflation, rather than its membership in a permanently excluded category.

It retains information about the magnitude of many price changes. If numerous components in the retained middle rise from 2% to 4%, the trimmed mean responds to the size of those increases. It uses more of the distribution than a median and substantially more information about magnitude than a threshold count.

It limits offsetting distortions from the two tails. It can help identify whether low headline inflation reflects broadly moderate increases or a combination of substantial increases and a few very large declines.

Disadvantages

The trimming rule requires judgment. How much should be trimmed? Should the upper and lower tails be treated symmetrically? The answers depend partly on the distribution of relative-price changes and the statistical objective being pursued.

The Dallas proportions were selected using historical data. That provides an empirical foundation, but it does not guarantee that the same proportions will remain optimal in every subsequent inflation regime. Its asymmetric trimming also illustrates that a simple symmetric distribution of price changes cannot be taken for granted. Dallas methodology

It can remove economically important signals. An extreme increase may be the first sign of pressure that will spread to other categories. Alternatively, a sector may experience sustained inflation for several years. The trimming procedure classifies observations by their position in the distribution; it does not know whether the underlying cause is temporary, persistent, supply driven, or demand driven.

It cannot remove a shock merely because the shock is temporary. If a temporary common disturbance moves most prices, it moves the middle of the distribution too. A trimmed mean is robust to sufficiently concentrated extremes, not to every disturbance that policymakers might wish to look through.

My assessment is that a trimmed mean offers an appealing balance: it reduces the influence of exceptional observations while retaining meaningful information about the size of price changes across a substantial portion of spending.

3. Median inflation: greater resistance to extremes, greater loss of information

The published Cleveland Fed median measures are expenditure weighted. The components are ranked by their monthly price changes, and the median is the change at the 50th percentile of expenditure weight. It is not the inflation rate of the middle category in a list where every category receives one vote. See the median CPI and median PCE descriptions.

Advantages

The median is highly resistant to the size of extreme observations. If a component already in the upper tail rises 30% instead of 10%, that change generally has no effect on the median. The same applies to exceptionally large declines.

It provides a clear indication of movement in the center of the distribution. An increase in the median suggests that the distribution’s midpoint has shifted. It is less vulnerable to the interpretation that a rise in the average reflects only one or two extreme observations.

It avoids having to choose particular trimming percentages. Within the family of measures that focus on the middle of the distribution, the median has a transparent definition. That does not eliminate every methodological choice—component definitions, weights, and seasonal adjustment still matter—but it removes the choice between, say, an 8% and a 15% trim.

Disadvantages

A large amount of inflation pressure can occur away from the midpoint. Suppose 51% of expenditure weight has inflation of 2%, while the remaining 49% has inflation of 8%. In a simple fixed-weight calculation:

  • Average inflation is 4.94%.
  • Median inflation is 2%.

The median accurately describes the midpoint, but a policymaker would lose important information by looking only at that number.

It can also change abruptly. Reverse the weights to 49% at 2% and 51% at 8%, and the median jumps from 2% to 8%, even though average inflation rises only from 4.94% to 5.06%. Real data are more complicated, but the example shows why the median is not always a smooth measure of changes in the whole distribution.

Large expenditure categories can have considerable influence over which observation becomes the median. A large category occupies a wide interval of cumulative expenditure weight. Housing is particularly relevant. Cleveland revised its CPI methodology by dividing owners’ equivalent rent into four regional components to reduce the distortion that a single large OER component could create. This is a concrete example of how the level of aggregation affects a median. Cleveland methodology revision

The median need not have the same long-run average as headline inflation. Persistent relative-price trends and asymmetry in the distribution can create a systematic gap between the median and the mean. A Cleveland study found such a positive gap for median PCE in its historical sample. Consequently, a median reading of 2% is not automatically equivalent to aggregate PCE inflation being at the Fed’s 2% objective. Carroll and Verbrugge, 2019

I would use the median as a valuable check on whether the center is moving, while continuing to examine what is happening on either side of it.

4. The share above 3%: particularly useful for breadth, limited as an estimate of the inflation rate

For the unweighted version we have been considering, the calculation is:\[ \text{Breadth}_t = 100\times \frac{\text{number of categories with inflation above 3%}} {\text{number of categories observed}}. \]

An expenditure-weighted version instead adds up the spending shares of the categories above 3%. Those two calculations answer different questions.

Advantages

It directly addresses whether inflation is concentrated or widespread. An aggregate rate can be high because of a few exceptional increases or because of moderate increases across many categories. Breadth helps distinguish those situations.

Extreme observations have bounded influence. In an unweighted count, a category rising 50% contributes exactly as much as a category rising 4%. Each category can change the numerator by at most one. This makes the measure well suited to the particular question of how widely elevated inflation is distributed.

It can reveal changes that the median misses. Suppose the share above 3% rises from 20% to 45%. The median can remain below 3% throughout, yet the growing upper portion of the distribution may be informative. Breadth shows that development directly.

An unweighted count can reveal generalization across sectors without being dominated by the largest spending categories. That can be useful when each category is being treated as a separate signal about price-setting behavior. Equal weighting has a coherent purpose, even though it sacrifices a direct interpretation in terms of household spending.

Disadvantages

It throws away information about magnitude

Consider two hypothetical changes:

  • Every category slows from 10% inflation to 4%. The share above 3% remains 100%, despite substantial disinflation.
  • Every category moves from 2.9% to 3.1%. The share jumps from 0% to 100%, despite an increase of only 0.2 percentage point in every category.

The first example shows how breadth can miss major progress. The second shows how a hard threshold can exaggerate the apparent importance of a small movement.

This is why I would examine several thresholds or inflation-rate ranges, rather than place too much weight on whether a single 3% line has been crossed.

Weighting changes the economic interpretation

Suppose six small categories each account for 5% of spending and have inflation of 4%, while four larger categories each account for 17.5% of spending and have inflation of 1%.

Then:

StatisticResult
Percentage of categories above 3%60%
Percentage of expenditure weight above 3%30%
Expenditure-weighted median1%
Simple expenditure-weighted average1.9%

The unweighted measure correctly reports that most categories have relatively rapid increases. It does not establish that most consumer spending is experiencing those increases.

Both versions are useful, provided their interpretation is explicit. For example, the Federal Reserve’s 2026 research on inflation breadth uses weighted shares of the CPI basket, as specified in its accessible figures. Those shares should not be compared directly with unweighted counts. Federal Reserve, Figures 2–3

The category classification can materially change the answer

If a category with inflation above 3% is divided into ten subcategories, each with the same inflation rate, its influence on an unweighted count increases even though nothing economic has changed.

A count therefore requires a consistent set of mutually exclusive categories at a reasonably stable level of detail. Counting both a broad category and its subcategories would effectively give some prices multiple votes.

Expenditure weighting avoids the particular problem of splitting an otherwise identical category: its total spending weight remains unchanged. But aggregation can still matter when subcategories have different inflation rates.

There is no universal “normal” share implied by the 2% target

The Fed’s objective concerns aggregate PCE inflation, not the inflation rate of every individual component.

For example, five equally weighted categories with inflation rates of:\[ -1\%,\quad 1\%,\quad 2\%,\quad 4\%,\quad 4\% \]

have average inflation of 2%, median inflation of 2%, and 40% of categories above 3%.

A substantial share above 3% can therefore coexist with aggregate inflation at target. What matters is how the share compares with an appropriate historical benchmark calculated in the same way. Warsh’s comparison with the prepandemic 32% is informative for that reason. But the historical average is an empirical benchmark, not an additional policy target.

5. Time horizon creates an especially important difference

There are two separate issues here.

Annual breadth can remain elevated after current price increases have stopped

Suppose many prices rise 4% once and then remain unchanged. Their year-over-year inflation rates will continue to exceed 3% for roughly a year after the increase.

A persistently high annual breadth measure could therefore reflect the continued presence of a past price-level adjustment in the calculation. It does not necessarily mean that comparable increases are continuing each month.

Shorter horizons help. Six-month annualized inflation responds more quickly than twelve-month inflation, while three-month inflation responds more quickly still. The tradeoff is greater sensitivity to short-run fluctuations and seasonal-adjustment issues.

Warsh’s 49% six-month share, compared with 54% over twelve months, is consistent with less widespread rapid increases in the more recent window. It does not, by itself, establish how much the aggregate inflation rate has slowed or where it will go next.

Published annual median inflation is not the median of annual component inflation

This is easy to overlook.

The published median and trimmed mean measures are constructed from monthly component price changes. Their longer-horizon rates accumulate those monthly robust changes. Taking the median across components first and then accumulating through time can produce a different answer from calculating annual inflation for every component first and then taking the median. Cleveland median PCE methodology; Dallas calculation code

A hypothetical example makes the difference clear:

  • There are three equally weighted categories.
  • Category A rises 4% in January and is otherwise unchanged.
  • Category B is unchanged throughout the year.
  • Category C rises 4% in July and is otherwise unchanged.

Every month, at least two categories have zero inflation. The monthly median is therefore always zero, and an index built by compounding those medians has zero annual inflation.

Yet at year-end, two of the three categories have risen 4%. The median of their annual inflation rates is 4%, and annual breadth above 3% is 66.7%.

This is one reason an annual breadth measure and a published annual median series can give different signals.

There is a useful mathematical connection when the weights, categories, and horizon are identical: if more than half the weight has inflation above 3%, the corresponding weighted median exceeds 3%. If Warsh’s 54% is an unweighted count, it implies that the unweighted median of those annual component changes exceeds 3%. It does not directly establish the value of the published expenditure-weighted median inflation series.

6. None of these measures identifies the cause or persistence of inflation by itself

The motivation for robust measures is strongest when unusually large component movements are mainly idiosyncratic disturbances around a more persistent common trend. But that is an economic interpretation of the distribution, rather than something established by trimming it.

A common supply shock can raise prices across many categories. Tariffs, for example, can affect final imported goods and domestic goods or services that use imported inputs. Federal Reserve research explicitly traces both channels across PCE categories. Minton and Somale, 2025

Consequently:

  • High breadth does not establish that excess aggregate demand is the cause.
  • A rise in the median does not establish that the shock will persist.
  • A concentrated increase does not establish that its effects will soon disappear.

Breadth does help assess the claim that high inflation is confined to a few unusual categories. But distinguishing an ongoing inflation process from a price-level adjustment requires additional evidence about subsequent price changes, quantities, expectations, and the propagation of the original shock.

The same caution applies to smoothness. A smoother series is easier to interpret, but smoothness alone does not establish that it is a better forecast of future inflation.

7. What does the empirical evidence say?

The research supports using robust measures, but it does not identify a universal winner across objectives, samples, and forecast horizons.

Dallas Fed research finds a useful distinction between filtering and forecasting. Dolmas and Koenig’s 2019 comparison concludes that trimmed mean PCE is helpful for filtering transitory variation and has advantages as an estimate of underlying inflation. However, it does not clearly dominate conventional core PCE in real-time forecasts of headline PCE inflation. Those are different tests of usefulness. “Two Measures of Core Inflation: A Comparison”

Cleveland research finds that many trimming choices perform similarly. Meyer and Venkatu find a broad range of trimmed mean estimators with statistically indistinguishable performance, including the median. Their results support the usefulness of focusing on the middle of the distribution, while providing less support for claiming that one finely chosen trim is uniquely best. “Trimmed-Mean Inflation Statistics: Just Hit the One in the Middle”

Relative performance can change across periods. Carroll and Verbrugge’s comparison of median PCE, trimmed mean PCE, and conventional core measures finds that the performance of the median measures changed after the Great Recession. Their analysis emphasizes the role of changes in the asymmetry of the component-price distribution. “Behavior of a New Median PCE Measure: A Tale of Tails”

For breadth, an additional distinction is necessary. A measure can correlate closely with inflation in the same periodwithout being an especially good predictor of future inflation. The Federal Reserve’s 2026 breadth study estimates contemporaneous relationships and examines how those relationships changed after the pandemic. It does not establish that a count above 3% forecasts future inflation better than median or trimmed mean measures. Federal Reserve breadth study

These studies also cover different historical samples. Their results provide reasons to use the measures and evaluate them carefully, rather than guarantees about their ranking in the current environment.

8. How I would use them together

For assessing the inflation outlook relevant to Fed policy, I would give the measures distinct roles.

  1. Keep headline PCE as the outcome to explain and forecast. It is the index to which the Fed’s inflation objective applies. Conventional core PCE remains a useful, familiar comparison.
  2. Use trimmed mean PCE as a central estimate of underlying inflation, with median PCE as a check. My preference for the trimmed mean reflects its retention of more information about the magnitude of price changes. Agreement between it and the median increases confidence that the center of the distribution is moving. Disagreement is a reason to inspect the distribution.
  3. Use breadth to assess generalization. I would look at both category counts and expenditure-weighted shares, with consistent definitions and historical benchmarks. Examining several thresholds would reveal whether a change reflects a substantial distributional shift or many observations barely crossing 3%.
  4. Compare horizons and investigate the components driving disagreement. Twelve-month measures provide perspective; shorter-horizon measures help identify recent changes. The sector composition matters when deciding whether the signal reflects continuing pressure, an earlier adjustment, or an unusual pattern of offsetting increases and declines.

Applied to Warsh’s speech, the comparison of 54% with a prepandemic 32% is meaningful evidence that faster price growth was more widespread than in the benchmark period, assuming a consistent calculation. The fall from about 77% also documents a substantial reduction in breadth. Neither fact supplies a numerical estimate of the underlying inflation rate or determines its future persistence.

Breadth adds valuable distributional information to median and trimmed mean inflation. Its strongest role is as a complement: it tells us how far relatively rapid price increases extend across the basket, while the robust rate measures tell us more about the pace of price increases near the center.

New BEA Data Releases Show Higher GDP Growth and Higher Inflation

Image created by ChatGPT

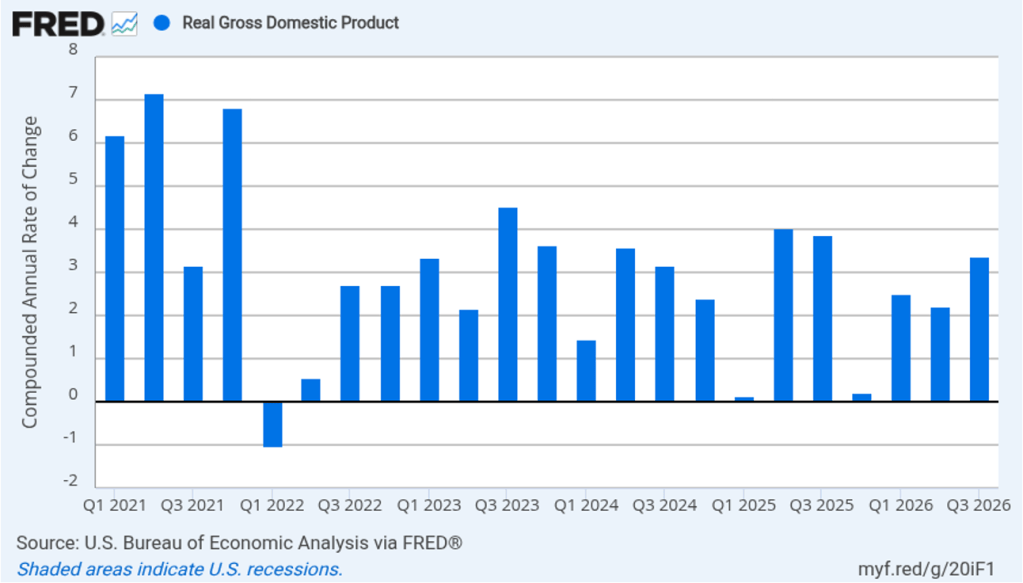
This morning (October 29), the Bureau of Economic Analysis (BEA) released two reports that show economic growth increased in the third quarter of 2026 compared with the second quarter and that inflation in September as measured by the percentage increase in personal consumption expenditures (PCE) price index also increased.

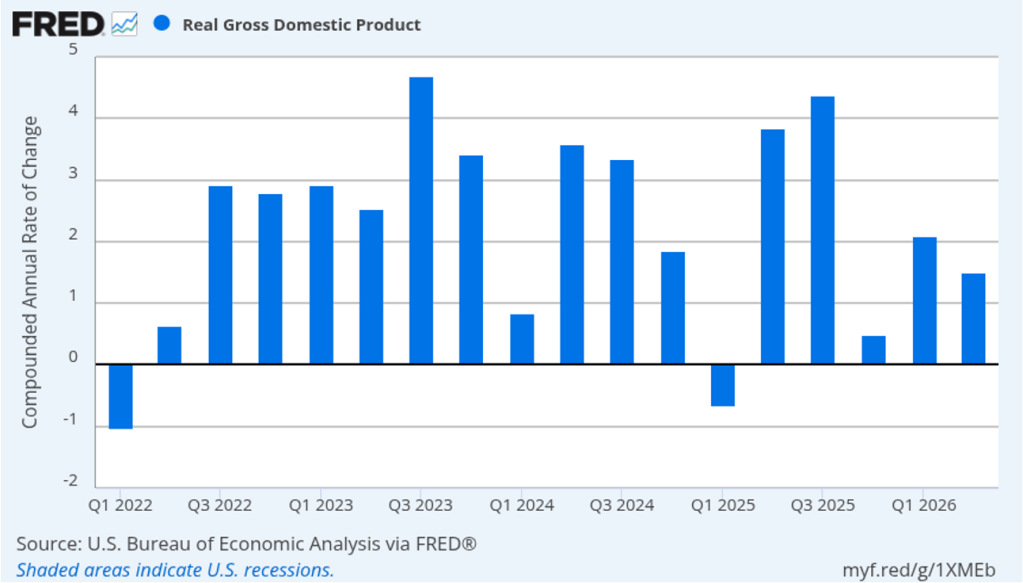
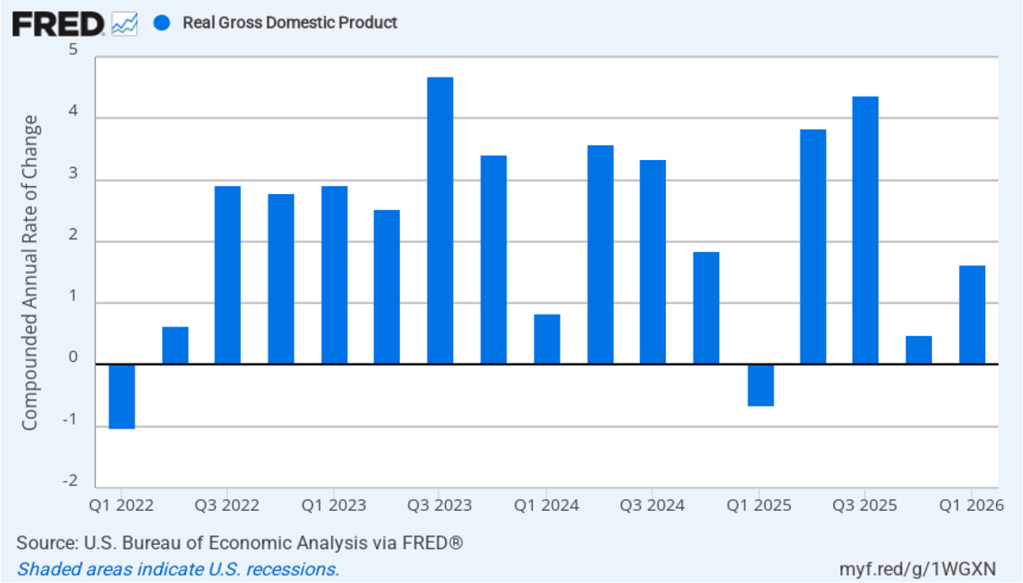
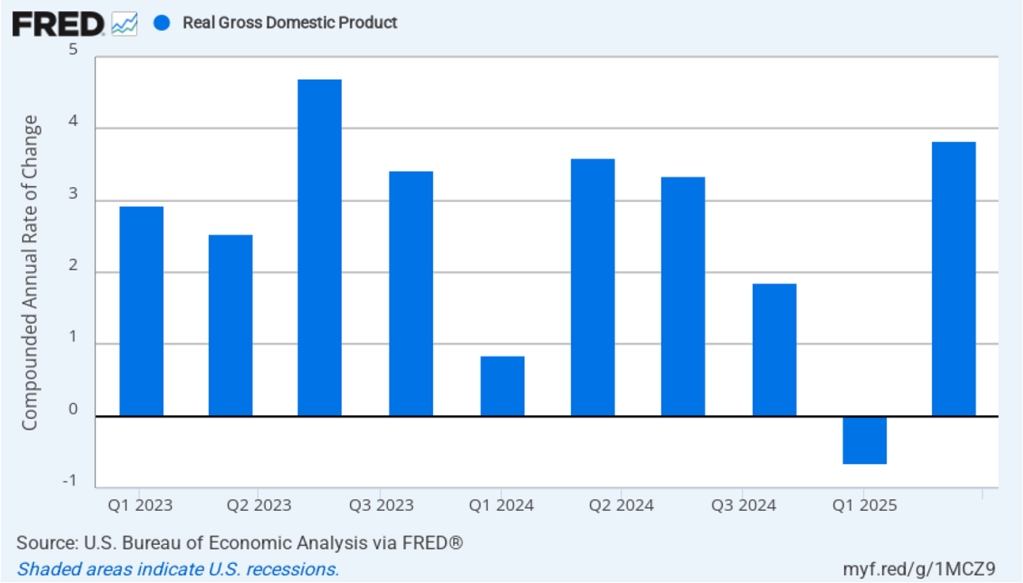
The BEA estimates that real GDP increased at an annual rate of 3.4 percent in the third quarter (July, August and September) of 2026, which is an increase from a 2.2 percent annual growth rate in the second quarter. As the following figure shows, real GDP grew at the fastest rate since the third quarter of 2025. Economists surveyed by the Wall Street Journal had expected real GDP to grow at a slower 3.1 percent rate in the third quarter.
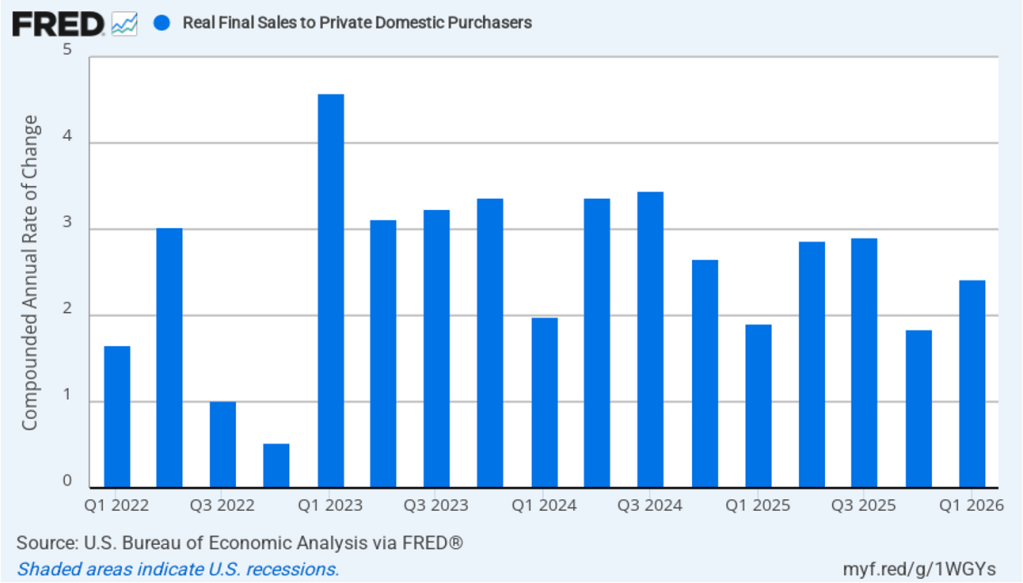
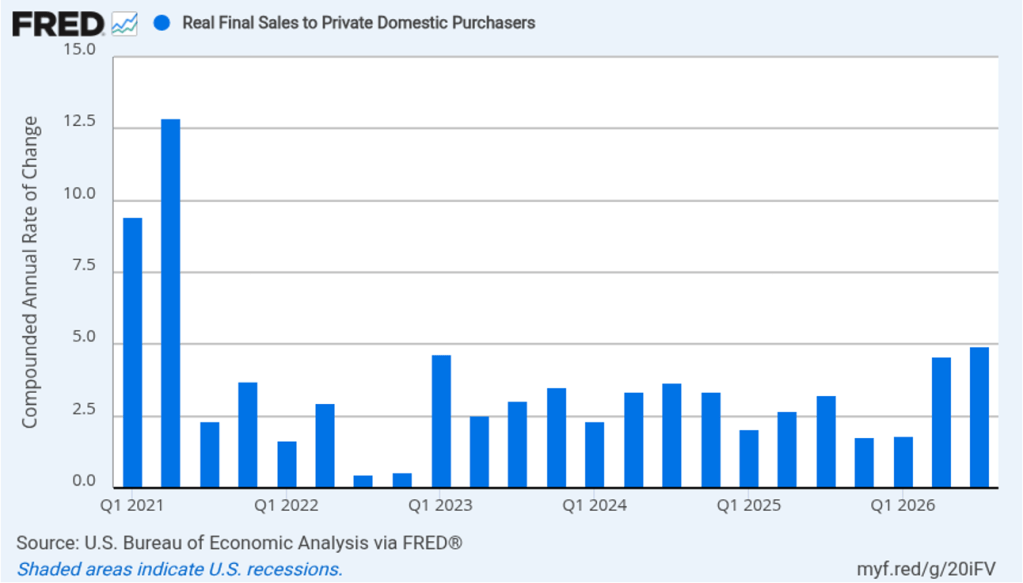
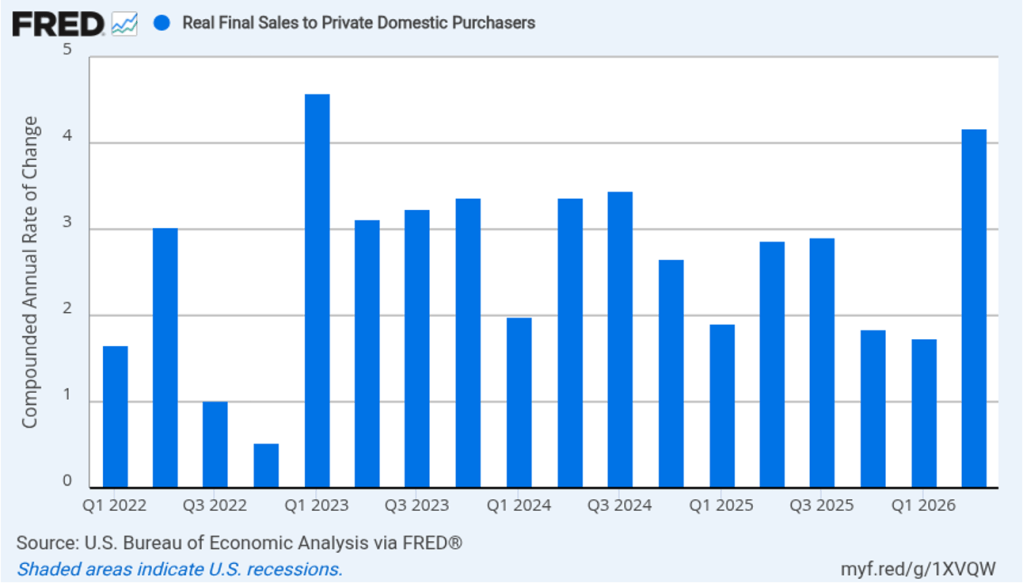
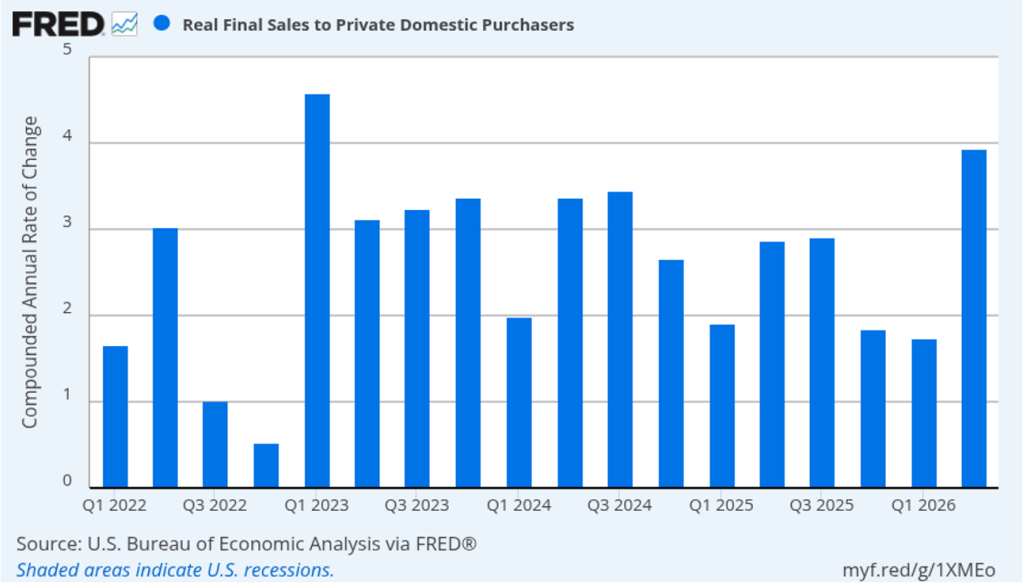
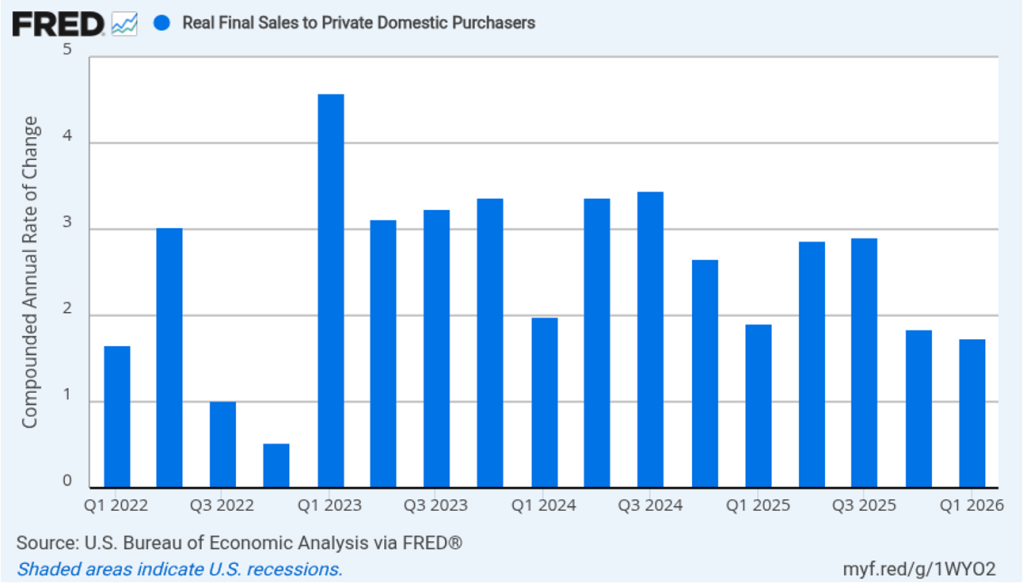
As we’ve discussed in previous blog posts, to better gauge the state of the economy, Federal Reserve policymakers often prefer to strip out the effects of imports, inventory investment, and government expenditures—which can be volatile—by looking at real final sales to private domestic purchasers, which includes only spending by U.S. households and firms on domestic production. As the following figure shows, real final sales to domestic purchasers increased at an annual rate of 4.9 percent in the third quarter, up from 4.6 percent in the second quarter. The growth rate in real final sales to domestic purchasers was well above the growth rate of real GDP, as well as more than twice the U.S. economy’s expected long-run annual real growth rate of 1.8 percent. So estimated growth in real final sales to domestic purchasers indicates that the U.S. economy is expanding more rapidly than is indicated by estimated growth in real GDP. Typically, growth in real final sales to domestic purchasers is steadier than growth in real GDP and is likely a better indicator of the underlying growth rate in the economy.
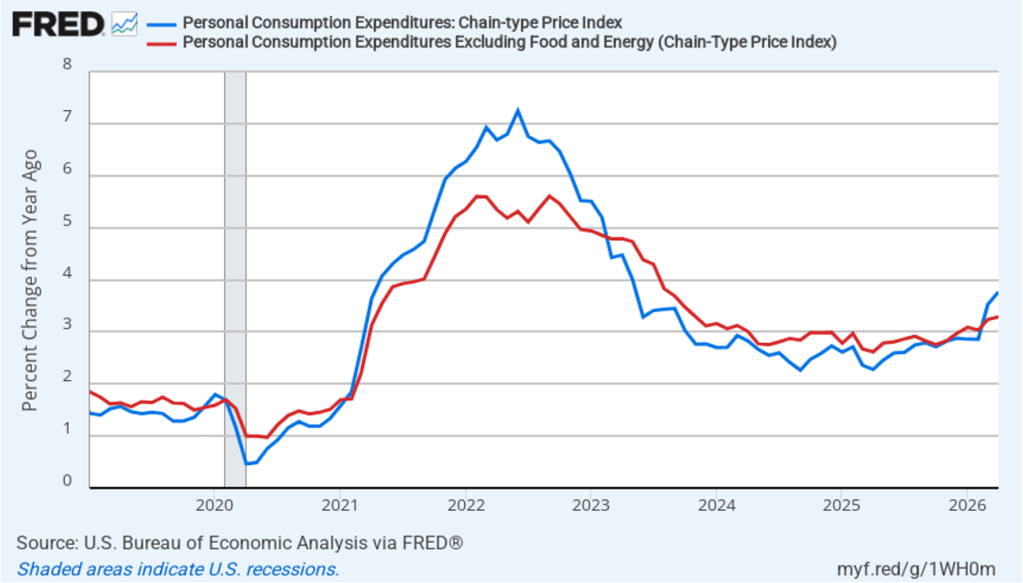
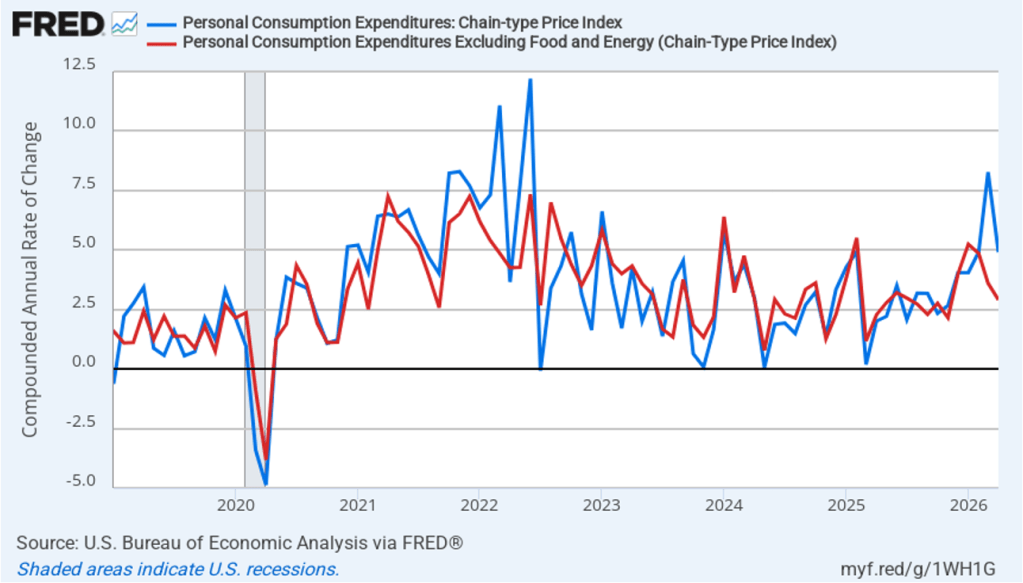
Today’s BEA “Personal Income and Outlays” report included monthly data on the personal consumption expenditures (PCE) price index. The Fed relies on annual changes in the PCE price index to evaluate whether it’s meeting its 2 percent annual inflation target. As we noted in an earlier blog post, Fed Chair Kevin Warsh indicated in his press conference following the July meeting of the Federal Open Market Committee (FOMC) that the committee intended to continue using the PCE price index as its gauge of inflation, although that decision would be revisited early next year. Some analysts have interpreted Warsh’s statement as an indication that he favored moving to a measure that would show lower rates of inflation than those shown by the PCE.

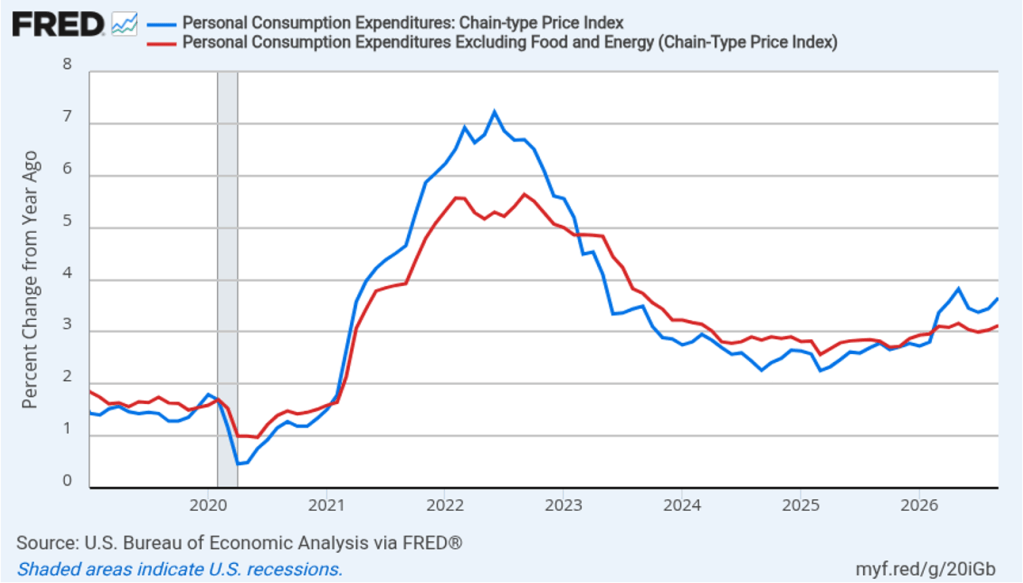
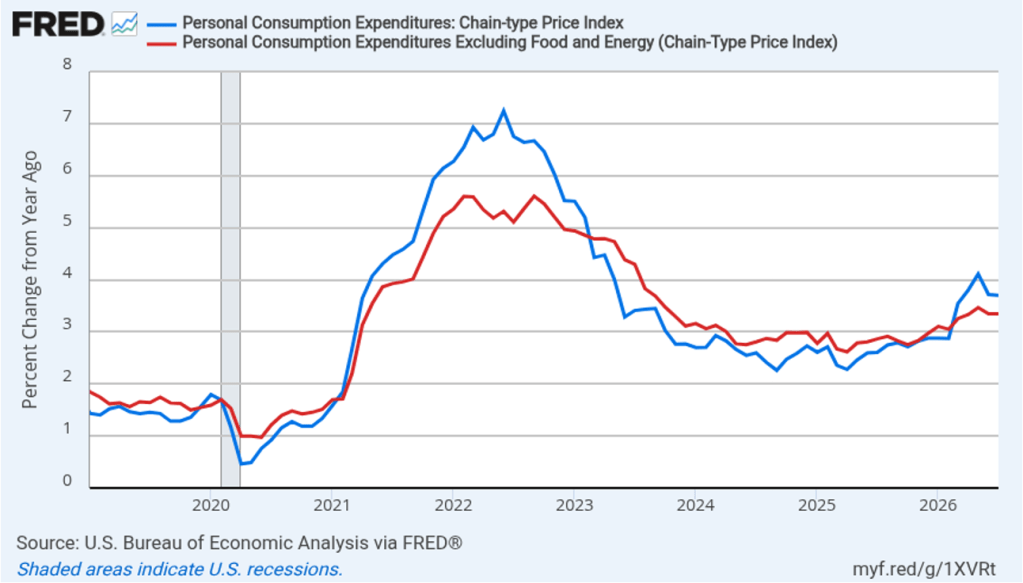
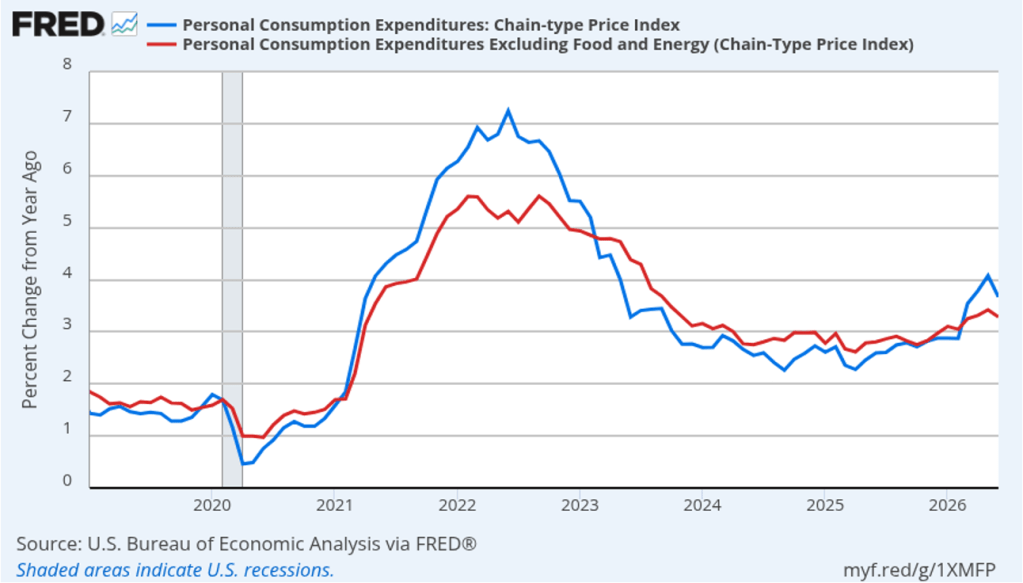
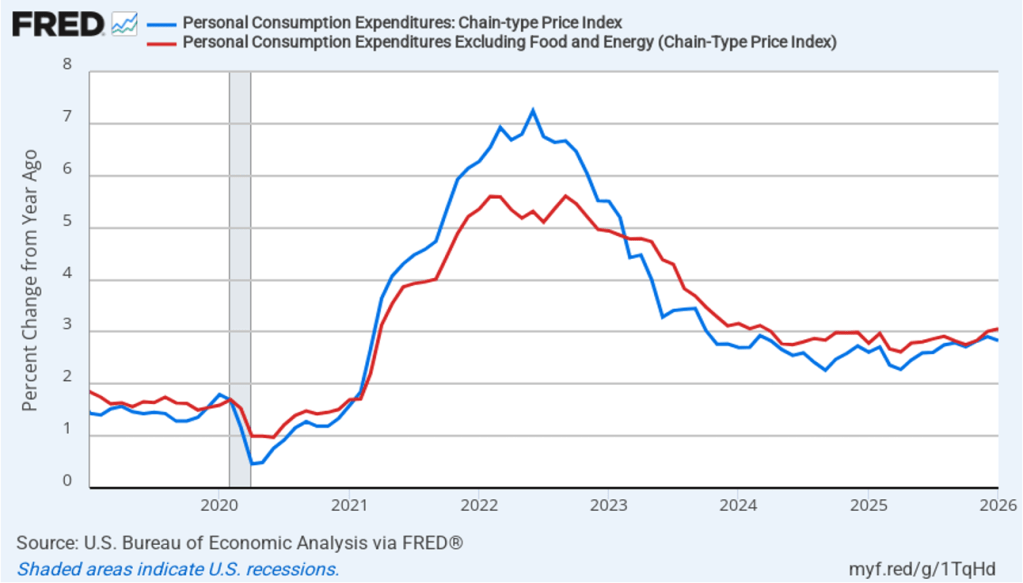
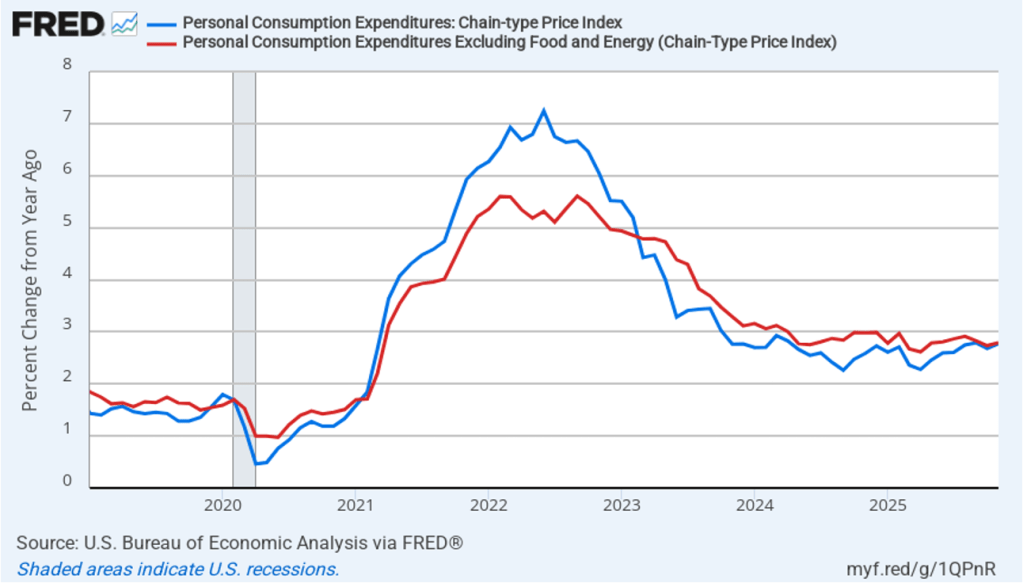
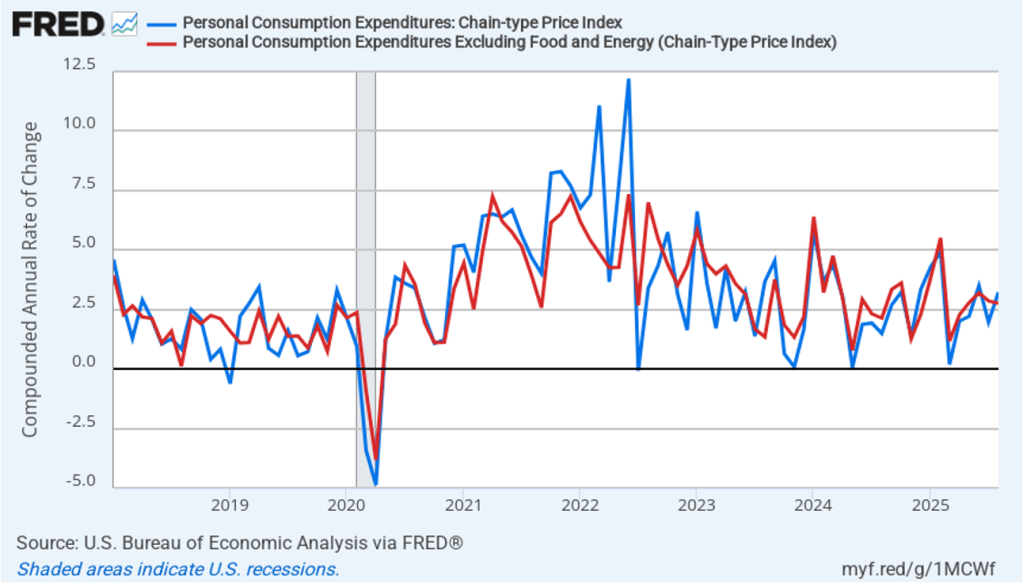
The following figure shows headline PCE inflation (the blue line) and core PCE inflation (the red line)—which excludes energy and food prices—for the period since January 2019, with inflation measured as the percentage change in the PCE from the same month in the previous year. In September, headline PCE inflation was 3.6 percent, up from 3.4 percent in August. Core PCE inflation in September was 3.1 percent, up form 3.0 percent in August. Headline PCE inflation was slightly below and core PCE inflation was equal to the forecast of economists surveyed by FactSet. Both headline PCE inflation and core PCE inflation remain well above the Fed’s 2 percent annual inflation target.

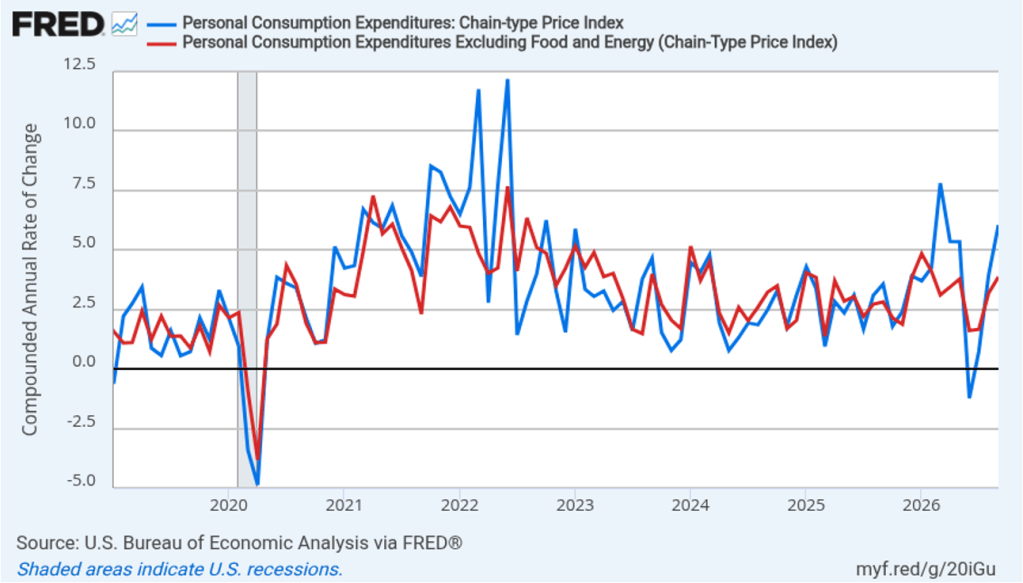
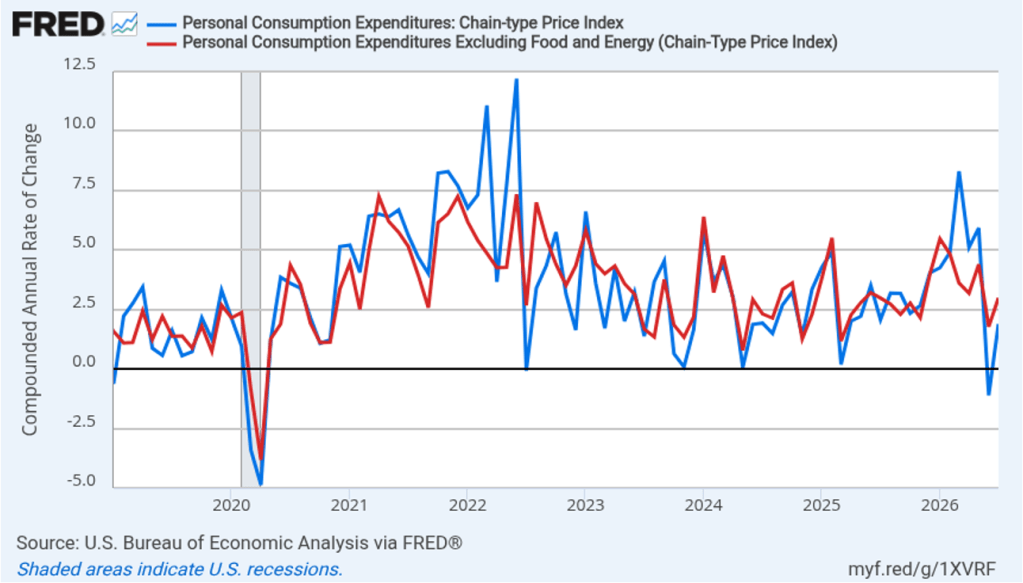
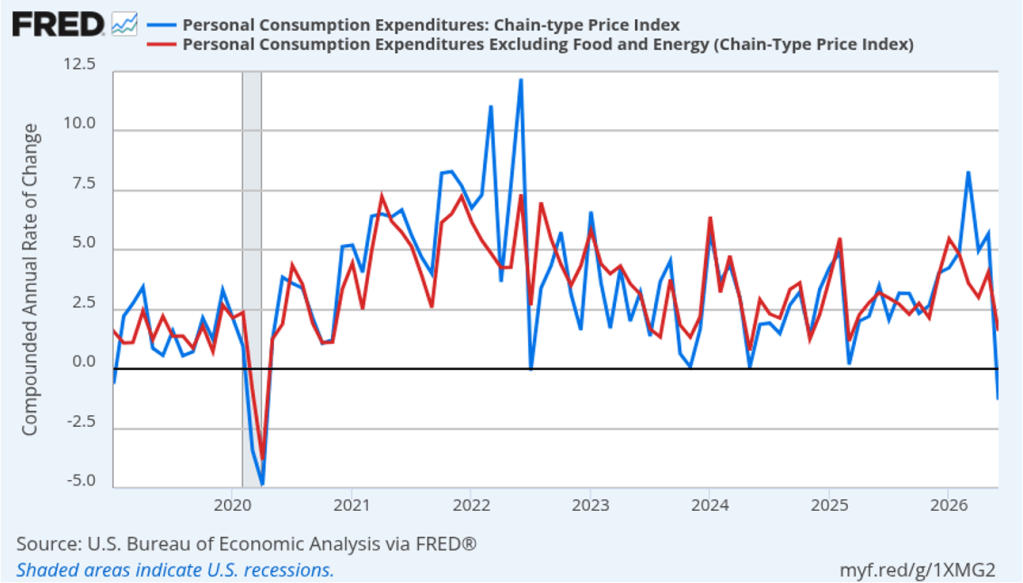
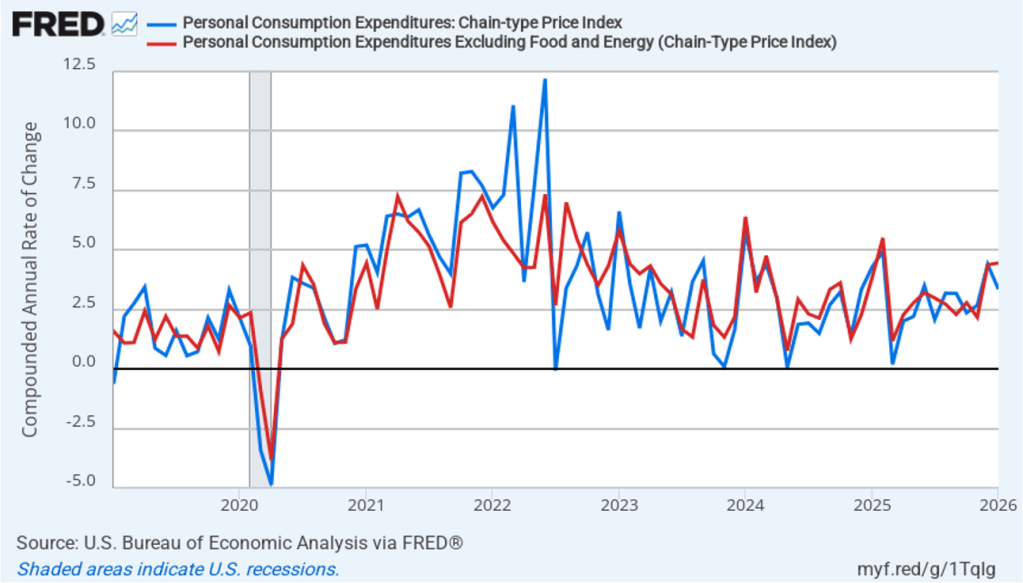
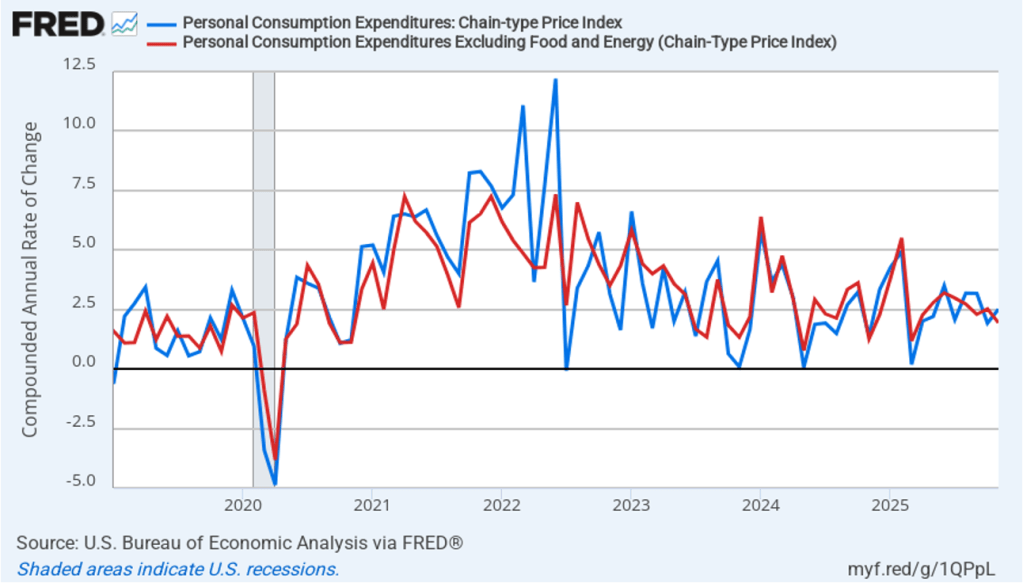
The following figure shows headline PCE inflation and core PCE inflation calculated by compounding the current month’s rate over an entire year. (Often referred to as 1-month inflation.) Measured this way, headline PCE inflation increased 6.1 percent in September from 3.9 percent in August. Core PCE inflation increased to 3.9 percent in September from 3.2 percent in August. The very high 1-month headline PCE inflation rate reflects the sharp increase in energy prices, particularly gasoline prices, during September. One-month core inflation shows a smaller, although still substantial, acceleration in inflation during September.

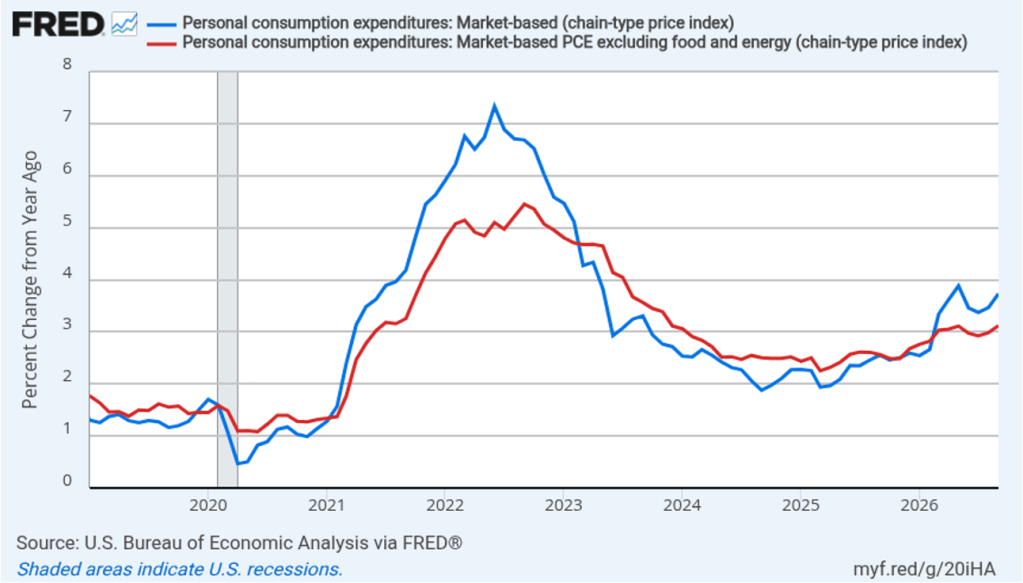
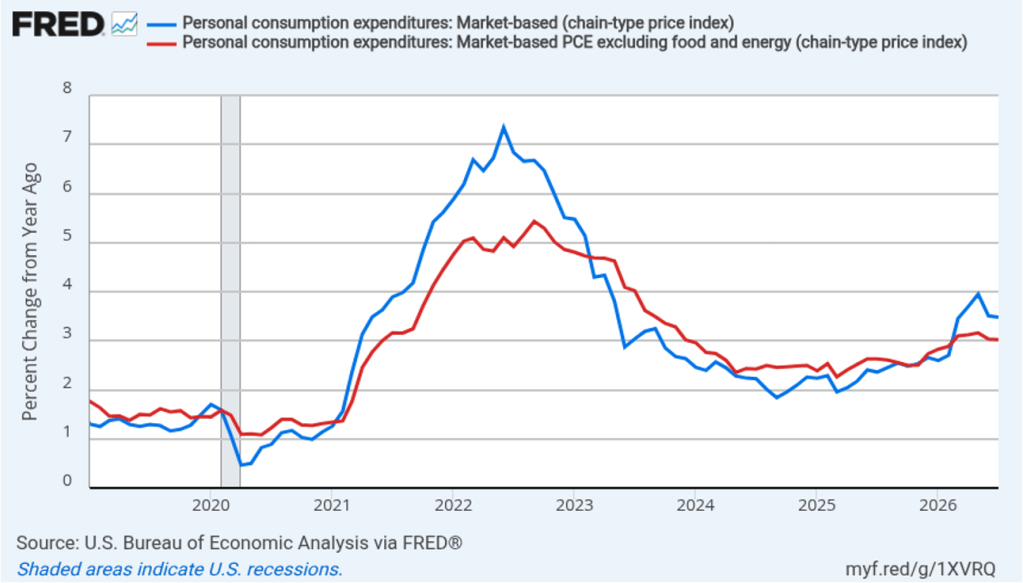
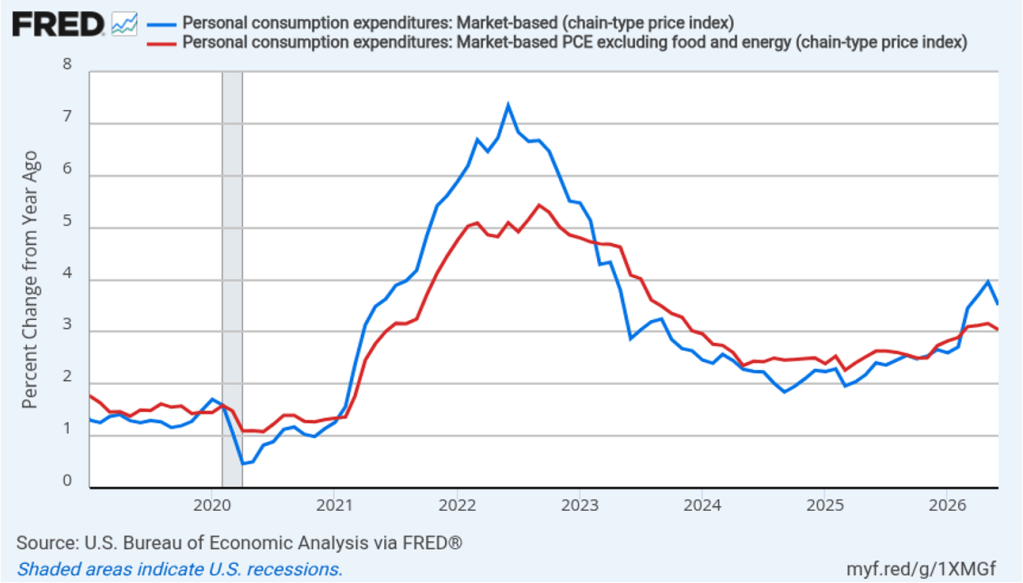
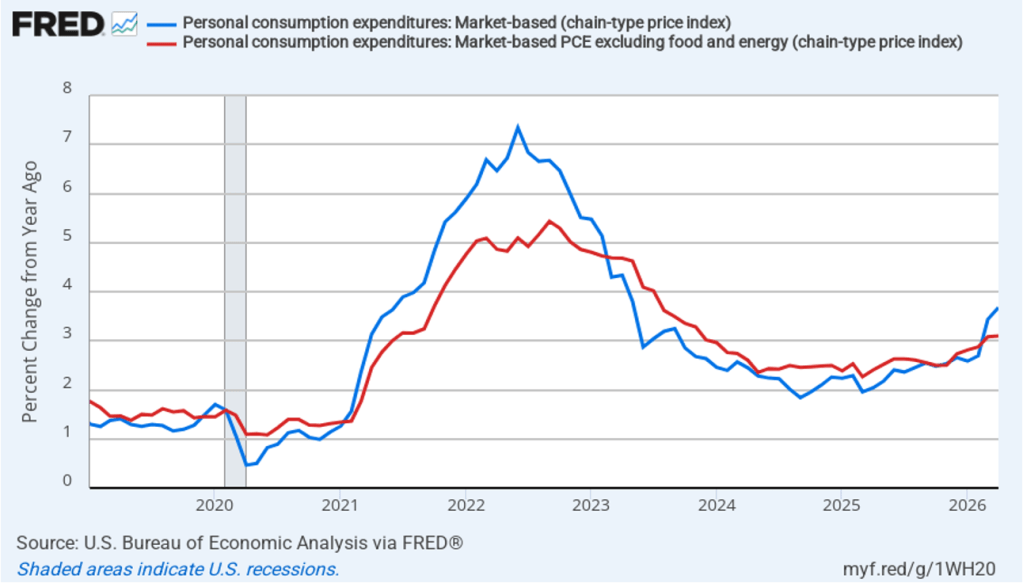
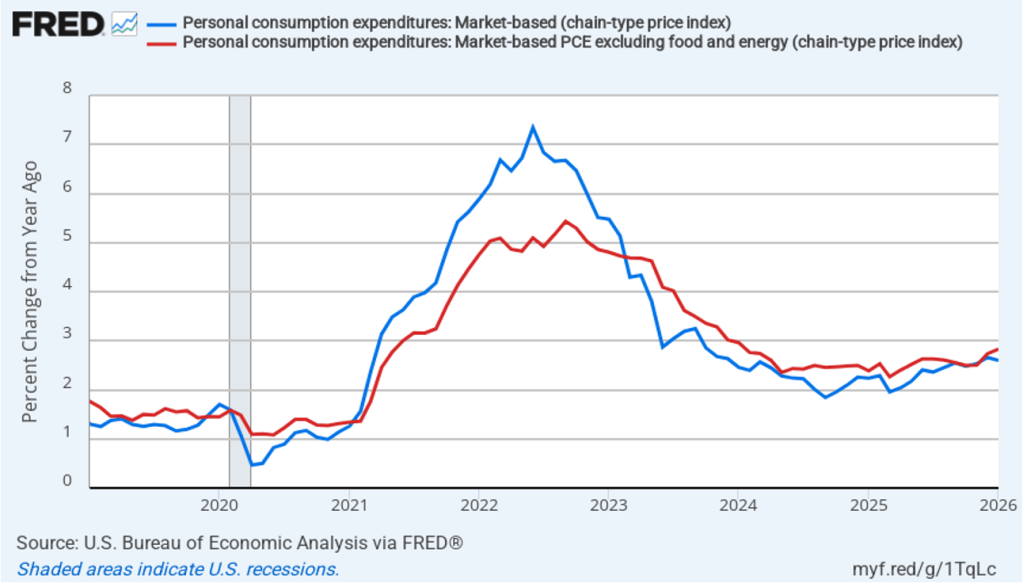
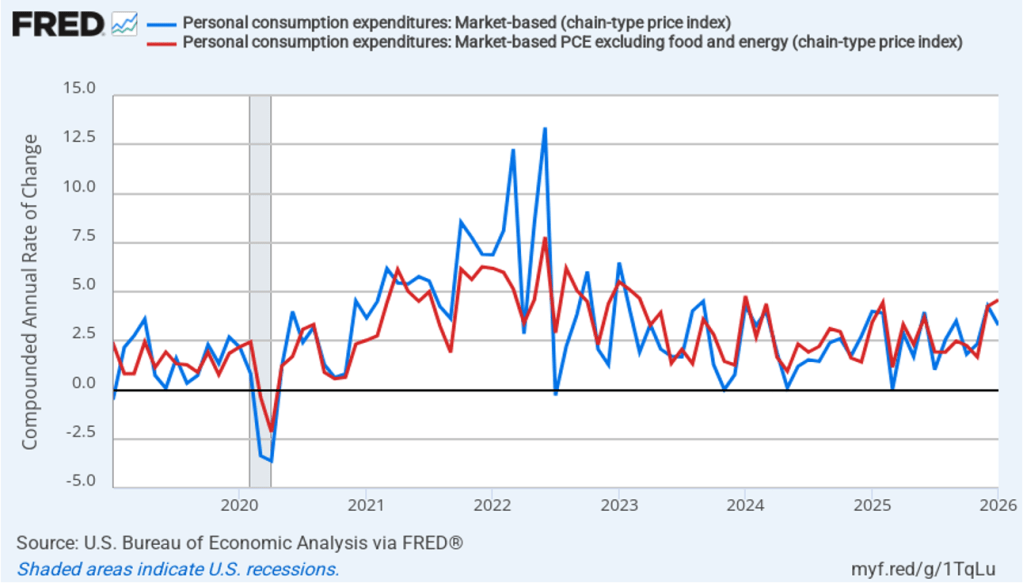
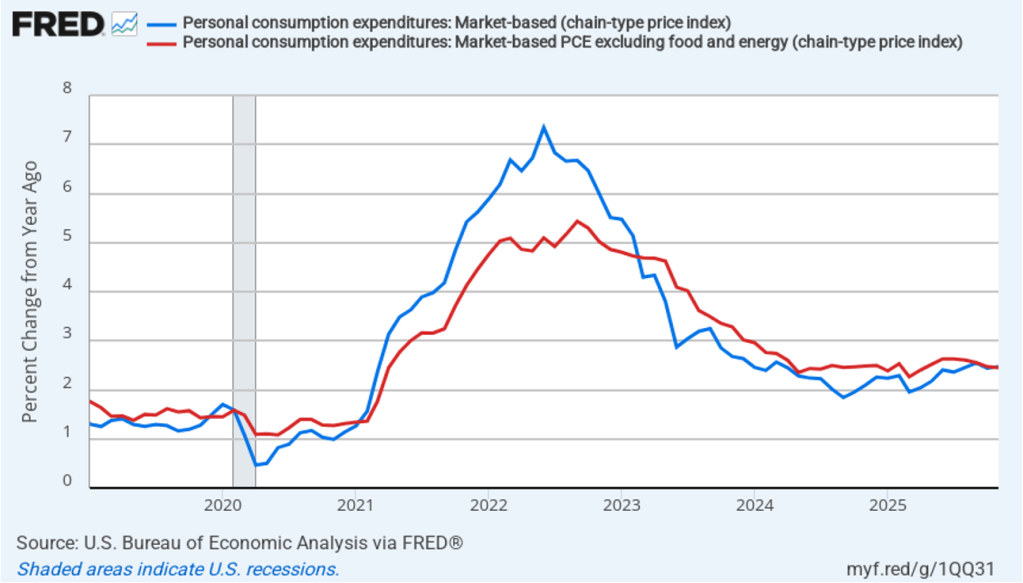
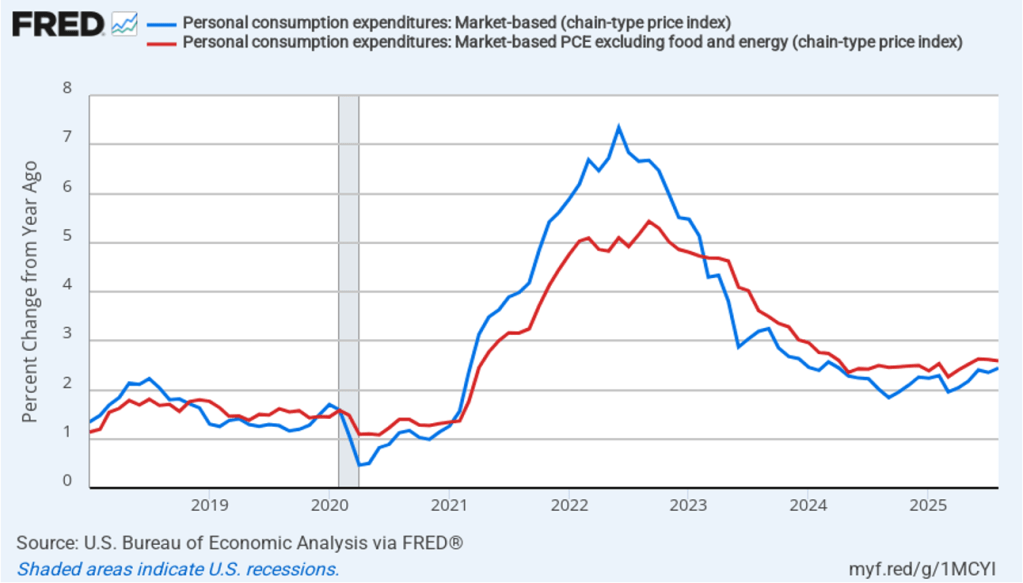
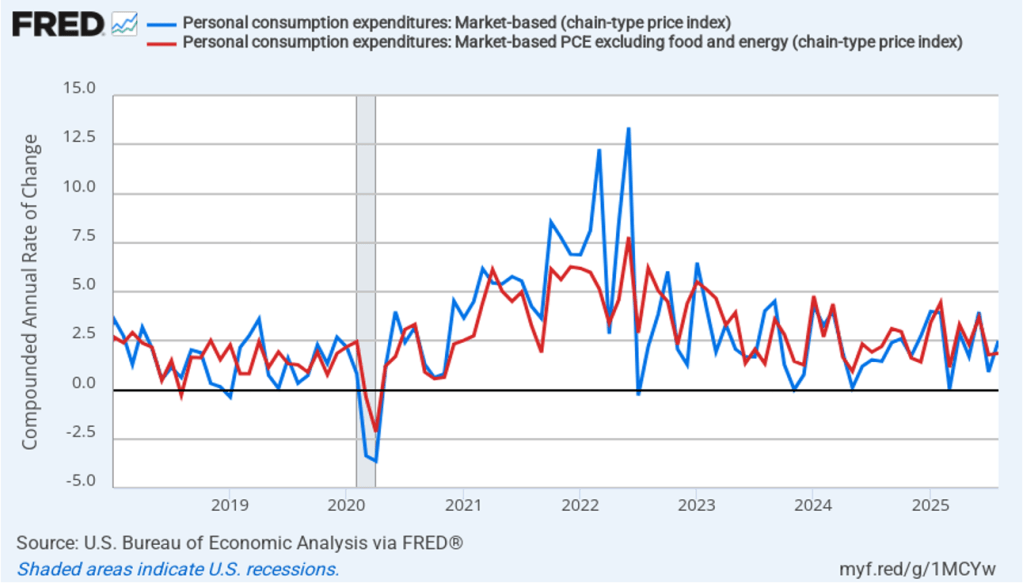
Fed policymakers believe that inflation in non-market services can skew PCE inflation. Non-market services are services whose prices the BEA imputes rather than measures directly. For instance, the BEA assumes that prices of financial services—such as brokerage fees—vary with the prices of financial assets. So that if stock prices rise, the prices of financial services included in the PCE price index also rise. Former Fed Chair Jerome Powell has argued that these imputed prices “don’t really tell us much about … tightness in the economy. They don’t really reflect that.” The following figure shows 12-month headline inflation (the blue line) and 12-month core inflation (the red line) for market-based PCE. (The BEA explains the market-based PCE measure here.)

Headline market-based PCE inflation was 3.7 percent in September, up from 3.5 percent in August. Core market-based PCE inflation was 3.1 percent in September, up from 3.0 percent in August. So both market-based measures show inflation in September remaining well above the Fed’s 2 percent target.

Fed Chair Kevin Warsh argued in testimony at his confirmation hearing before the Senate that the Fed should stop relying on headline PCE inflation: “The measures [of inflation] I prefer are looking at things that are called trimmed averages. We take out all of the tail-risks, all of the one-off items, and we ask ourselves whether the generalized change in prices is having second-order effects on the economy.”

Trimmed-mean PCE inflation drops the 31 percent of goods and services with the highest inflation rates and the 24 percent of goods and services with the lowest inflation rates. A closely related measure, median PCE inflation, is calculated by listing the inflation rate in each individual good or service included in the PCE and identifying the inflation rate of the good or service that is in the middle of the list—that is, the inflation rate in the price of the good or service that has an equal number of higher and lower inflation rates.

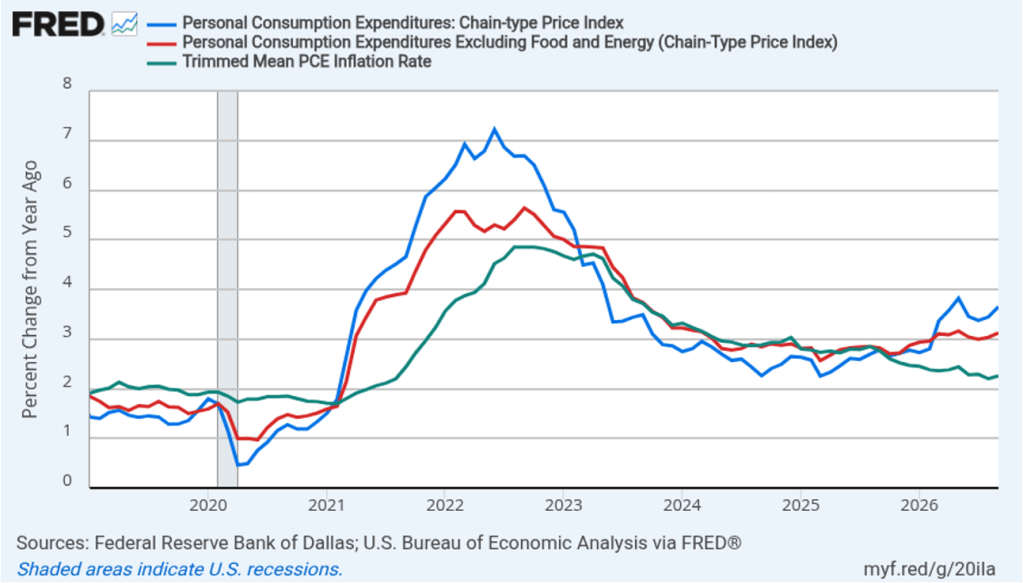
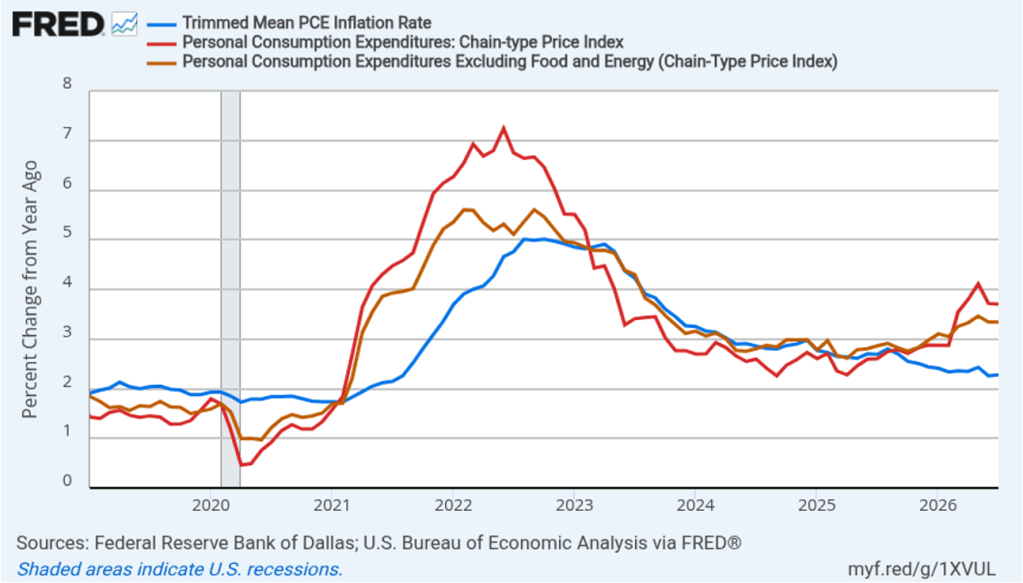
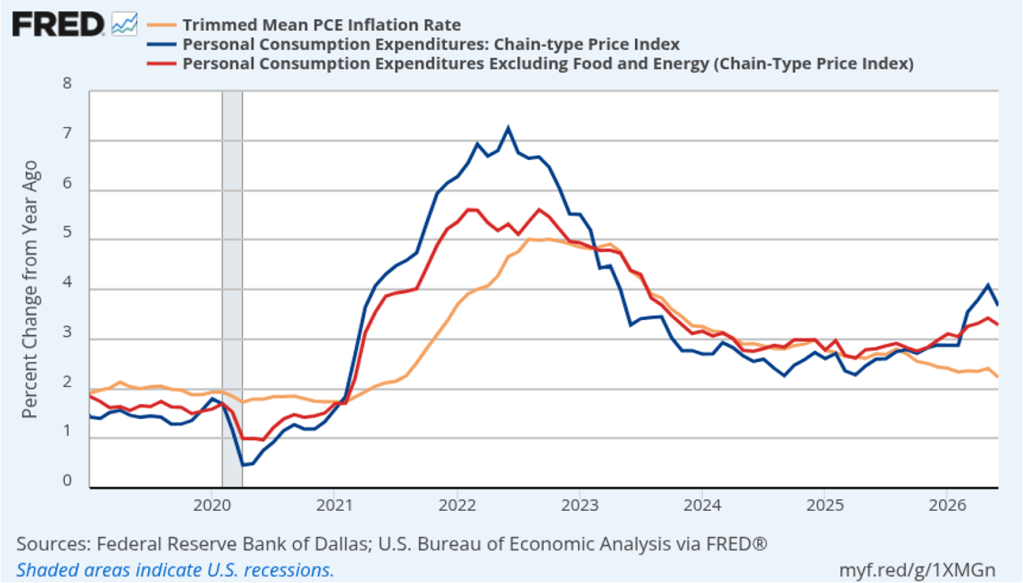
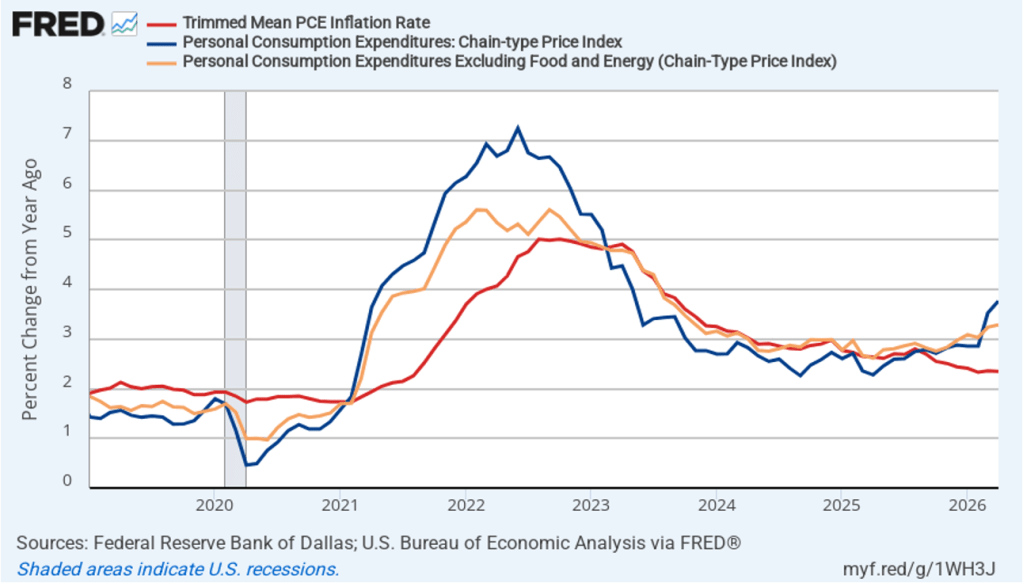
The following figure shows 12-month headline PCE inflation the (blue line), core PCE inflation (the red line) and trimmed-mean PCE inflation (the green line). Trimmed-mean PCE inflation in September was 2.3 percent, well below both headline and core PCE inflation.

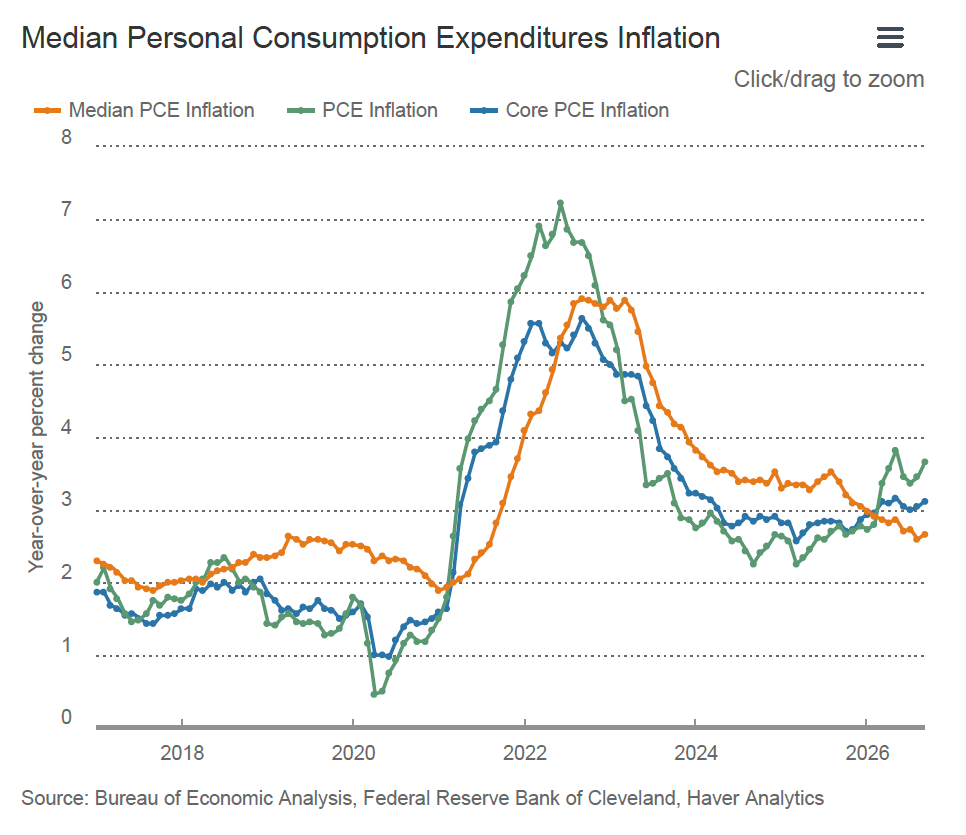
The following figure from the website of the Federal Reserve Bank of Cleveland shows headline PCE inflation (the green line), core PCE inflation (the blue line), and median PCE inflation (the brown line). In September, median PCE inflation was 2.7 percent, which was up from 2.6 percent in August. So Warsh has a point that these two measures of inflation, which are less affected by particularly high or low rates of inflation in some goods and services, indicate that inflation has been running below the Fed’s currently preferred measure of 12-month headline PCE inflation. But these measures also show inflation still running well above the Fed’s 2 percent annual inflation target.

Today’s macro data releases appear to have caused investors who buy and sell federal funds futures contracts to believe that the Federal Open Market Committee (FOMC) is now somewhat less likely to raise its target for the federal funds rate at the committee’s next meeting on December 8–9. Trading on the federal funds futures market today implies that the probability of a target rate increase at that meeting is 74.9 percent, down from a probability of 84.2 percent yesterday.

New BEA Releases Show Steady Inflation and Higher Output Growth

Image created by ChatGPT

The Bureau of Economic Analysis (BEA) released two reports this morning (August 26): “GDP (Second Estimate) and Corporate Profits, 2nd Quarter 2026” and “Personal Income and Outlays, July 2026.” The BEA’s second estimate is that real GDP grew at annual rate of 1.5 percent in second quarter of 2026, which is unchanged from the BEA’s initial estimate released last month and is equal to the forecast of economists surveyed by the Wall Street Journal. 

As we’ve discussed in previous blog posts, to better gauge the state of the economy, Federal Reserve policymakers often prefer to strip out the effects of imports, inventory investment, and government expenditures—which can be volatile—by looking at real final sales to private domestic purchasers, which includes only spending by U.S. households and firms on domestic production. As the following figure shows, real final sales to domestic purchasers increased at an annual rate of 4.2 percent in the second quarter, up from 3.9 percent in last month’s initial estimate. The growth rate in real final sales to domestic purchasers was more than twice the rate of growth of real GDP, as well as far above the U.S. economy’s expected long-run annual real growth rate of 1.8 percent. So growth in real final sales to domestic purchasers indicates that the U.S. economy is expanding rapidly, as opposed to the much weaker growth shown by real GDP data. Typically, growth in real final sales to domestic purchasers is steadier than growth in real GDP and is likely a better indicator of the underlying growth rate in the economy.

The BEA’s “Personal Income and Outlays” report this morning included monthly data on the personal consumption expenditures (PCE) price index. The Fed relies on annual changes in the PCE price index to evaluate whether it’s meeting its 2 percent annual inflation target. As we noted in a recent blog post, Fed Chair Kevin Warsh indicated in his press conference following the July meeting of the Federal Open Market Committee (FOMC) that the committee intended to continue using the PCE price index as its gauge of inflation, although that decision would be revisited early next year. Warsh may have intended this statement to reassure financial markets that there would be continuity in the Fed’s measure of inflation. However, some investors appear to have interpreted Warsh’s statement that the decision would be revisited next year as an indication that he favored moving to a measure that would show lower rates of inflation than those shown by the PCE.

In other words, some investors believe that in the future the FOMC might be willing to accept higher levels of PCE inflation. Perhaps in response to this interpretation, the yield on the 30-year U.S. Treasury bond increased in the days following Warsh’s press conference. Higher expected inflation can lead to lower bond prices and higher bond yields. (We discuss this point in Money, Banking, and the Financial System, Chapter 5, which is now available in a new edition.) Warsh is scheduled to speak on Friday at the Kansas City Fed’s annual Jackson Hole Economic Policy Symposium. His speech will cover his views on the current state of the economy and may give clues as to the future monetary policy actions he may support.

Image created by ChatGPT

The following figure shows headline PCE inflation (the blue line) and core PCE inflation (the red line)—which excludes energy and food prices—for the period since January 2019, with inflation measured as the percentage change in the PCE from the same month in the previous year. In July, headline PCE inflation was 3.7 percent, unchanged from June. Core PCE inflation in July was 3.3 percent, also unchanged from June. Headline PCE inflation was slightly higher than forecast by economists surveyed by the Wall Street Journal, while core PCE was equal to the forecast. Both headline PCE inflation and core PCE inflation remain well above the Fed’s 2 percent annual inflation target.

The following figure shows headline PCE inflation and core PCE inflation calculated by compounding the current month’s rate over an entire year. (Often referred to as 1-month inflation.) Measured this way, headline PCE inflation increased from –1.3 in June to 1.9 percent in July. Core PCE inflation increased from 1.8 percent in June to 3.0 percent in July. Headline inflation was very low in June—prices actually fell during the month—largely because of falling gasoline prices. Today’s data show here was a noticeable acceleration in inflation during July. Of course, it’s important not to overinterpret the data from a single month.

Fed policymakers believe that inflation in non-market services can skew PCE inflation. Non-market services are services whose prices the BEA imputes rather than measures directly. For instance, the BEA assumes that prices of financial services—such as brokerage fees—vary with the prices of financial assets. So that if stock prices rise, the prices of financial services included in the PCE price index also rise. Former Fed Chair Jerome Powell has argued that these imputed prices “don’t really tell us much about … tightness in the economy. They don’t really reflect that.” The following figure shows 12-month headline inflation (the blue line) and 12-month core inflation (the red line) for market-based PCE. (The BEA explains the market-based PCE measure here.)

Headline market-based PCE inflation was 3.5 percent in July, unchanged from June. Core market-based PCE inflation was 3.0 percent in July, also unchanged from June. So, both market-based measures show inflation in July remaining well above the Fed’s 2 percent target.

Fed Chair Kevin Warsh argued in testimony at his confirmation hearing before the Senate that the Fed should stop relying on headline PCE inflation: “The measures [of inflation] I prefer are looking at things that are called trimmed averages. We take out all of the tail-risks, all of the one-off items, and we ask ourselves whether the generalized change in prices is having second-order effects on the economy.” 

Trimmed-mean PCE inflation drops the 31 percent of goods and services with the highest inflation rates and the 24 percent of goods and services with the lowest inflation rates. A closely related measure, median PCE inflation, is calculated by listing the inflation rate in each individual good or service included in the PCE and identifying the inflation rate of the good or service that is in the middle of the list—that is, the inflation rate in the price of the good or service that has an equal number of higher and lower inflation rates. 

The following figure shows headline PCE inflation the (red line), core PCE inflation (the brown line) and trimmed-mean PCE inflation (the blue line). Trimmed-mean PCE inflation in July was 2.3 percent, well below both headline and core PCE inflation.

The following figure from the web site of the Federal Reserve Bank of Cleveland shows headline PCE inflation (the green line), core PCE inflation (the blue line), and median PCE inflation (the brown line). In July, median PCE inflation was 2.7 percent, which was unchanged from June. So Warsh has a point that these two measures of inflation, which are less affected by particularly high or low rates of inflation in some goods and services, indicate that inflation has been running below the Fed’s currently preferred measure. But these measures also show inflation still running well above the Fed’s 2 percent annual inflation target.

Today’s macro data releases appear to have had little effect on the views of investors who buy and sell federal funds futures contracts. These investors believe that the FOMC will likely not raise its target for the federal funds rate at its meeting on September 15–16 as some analysts have speculated. The probability that the committee will leave its target range unchanged at 3.50 percent to 3.75 percent declined only slightly from 60.4 percent yesterday to 59.9 percent this afternoon. Investors assign a probability of 54.7 percent to the FOMC raising its target range by o.25 percentage points (25 basis points) at its meeting on October 27–28.

New BEA Releases Show Slower Growth Than Expected and Lower Inflation

Image created by ChatGPT

The Bureau of Economic Analysis (BEA) released two reports this morning (July 30): “GDP (Advance Estimate), 2nd Quarter 2026” and “Personal Income and Outlays, June 2026.” The BEA’s initial—or advance—estimate is that real GDP grew in the second quarter of 2026 at annual rate of 1.5 percent, down from an annual rate of 2.1 percent in the first quarter. Economists surveyed by the Wall Street Journal had forecast that real GDP would grow at a rate of 1.8 percent in the second quarter. The following figure shows the BEA’s estimated rates of real GDP growth in each quarter beginning with the first quarter of 2022.

As we’ve discussed in previous blog posts, to better gauge the state of the economy, policymakers—including former Fed Chair Jerome Powell—often prefer to strip out the effects of imports, inventory investment, and government expenditures—which can be volatile—by looking at real final sales to private domestic purchasers, which includes only spending by U.S. households and firms on domestic production. As the following figure shows, real final sales to domestic purchasers increased at an annual rate of 3.9 percent in the second quarter, more than twice the rate of growth of real GDP, as well as far above the U.S. economy’s expected long-run annual real growth rate of 1.8 percent. So growth in real final sales to domestic purchasers indicates that the U.S. economy is expanding rapidly, as opposed to the much weaker growth shown by real GDP data. Typically, growth in real final sales to domestic purchasers is steadier than growth in real GDP and is likely a better indicator of the underlying growth rate in the economy.

There has been much discussion in the media of the surge in spending on new data centers to power artificial intelligence programs. This surge is reflected in following figure, which shows real domestic investment in information processing equipment. This category of investment spending has increased more than 40 percent since the fourth quarter of 2024.

The BEA’s “Personal Income and Outlays” report this morning included monthly data on the personal consumption expenditures (PCE) price index. The Fed relies on annual changes in the PCE price index to evaluate whether it’s meeting its 2 percent annual inflation target. As we noted in a blog post yesterday, Fed Chair Kevin Warsh indicated in his press conference following the meeting of the Federal Open Market Committee (FOMC) that the committee intended to continue using the PCE price index as its gauge of inflation, although that decision would be revisited early next year. Warsh may have intended this statement to reassure financial markets that there would be continuity in the Fed’s measure of inflation. However, some investors appear to have interpreted Warsh’s statement that the decision would be revisited next year as an indication that he favored moving to a measure that would show lower rates of inflation than those shown by the PCE.

In other words, some investors believe that in the future the FOMC might be willing to accept higher levels of PCE inflation. Perhaps in response to this interpretation, the yield on the 30-year U.S. Treasury bond rose to its highest level since 2007. Higher expected inflation can lead to lower bond prices and higher bond yields. (We discuss this point in Money, Banking, and the Financial System, Chapter 5, which is now available in a new edition.)

The following figure shows headline PCE inflation (the blue line) and core PCE inflation (the red line)—which excludes energy and food prices—for the period since January 2019, with inflation measured as the percentage change in the PCE from the same month in the previous year. In June, headline PCE inflation was 3.7 percent, down from 4.1 percent in May. Core PCE inflation in June was 3.3 percent, down slightly from 3.4 percent in May. Headline and core PCE inflation were both equal to the forecasts of economists surveyed by the Wall Street Journal. Both headline PCE inflation and core PCE inflation remain well above the Fed’s 2 percent annual inflation target.

The following figure shows monthly PCE inflation and monthly core PCE inflation calculated by compounding the current month’s rate over an entire year. (Often referred to as 1-month inflation.) Measured this way, headline PCE inflation declined from 5.7 percent in May to –1.3 percent in June; in other words, consumer prices fell in June. Core PCE inflation fell from 4.1 in May to 1.6 percent in June. Even leaving aside the effect of falling gasoline prices on headline PCE, these data show that in June there was a noticeable deceleration in inflation. Of course, it’s important not to overinterpret the data from a single month.

Former Fed Chair Jerome Powell frequently mentioned that inflation in non-market services can skew PCE inflation. Non-market services are services whose prices the BEA imputes rather than measures directly. For instance, the BEA assumes that prices of financial services—such as brokerage fees—vary with the prices of financial assets. So that if stock prices rise, the prices of financial services included in the PCE price index also rise. Powell has argued that these imputed prices “don’t really tell us much about … tightness in the economy. They don’t really reflect that.” The following figure shows 12-month headline inflation (the blue line) and 12-month core inflation (the red line) for market-based PCE. (The BEA explains the market-based PCE measure here.)

Headline market-based PCE inflation was 3.5 percent in May, down from 4.0 percent in May. Core market-based PCE inflation was 3.0 percent in June, down from 3.2 percent in May. So, both market-based measures, although lower than the full PCE measures, show inflation in June remaining well above the Fed’s 2 percent target.

Fed Chair Kevin Warsh argued in testimony at his confirmation hearing before the Senate that the Fed should stop relying on headline PCE inflation: “The measures [of inflation] I prefer are looking at things that are called trimmed averages. We take out all of the tail-risks, all of the one-off items, and we ask ourselves whether the generalized change in prices is having second-order effects on the economy.” 

Trimmed-mean PCE inflation drops the 31 percent of goods and services with the highest inflation rates and the 24 percent of goods and services with the lowest inflation rates. A closely related measure, median PCE inflation, is calculated by listing the inflation rate in each individual good or service included in the PCE and identifying the inflation rate of the good or service that is in the middle of the list—that is, the inflation rate in the price of the good or service that has an equal number of higher and lower inflation rates. 

The following figure shows headline PCE inflation the (blue line), core PCE inflation (the red line) and trimmed-mean PCE inflation (the brown line). Trimmed-mean PCE inflation in June was 2.2 percent, well below both headline and core PCE inflation.

The following figure from the web site of the Federal Reserve Bank of Cleveland shows headline PCE inflation (the green line), core PCE inflation (the blue line), and median PCE inflation (the brown line). In June, median PCE inflation was 2.7 percent, also below both headline and core inflation. So Warsh has a point that these two measures of inflation, which are less affected by particularly high or low rates of inflation in some goods and services, indicate that inflation has been running below the Fed’s currently preferred measure. But these measures also show inflation still running well above the Fed’s 2 percent annual inflation target.

Today’s macro data releases appear to have reinforced the view of investors who buy and sell federal funds futures contracts that the FOMC will raise its target for the federal funds rate by o.25 at its meeting on September 15–16. That probability increased from 58.3 percent yesterday to 65.4 percent this afternoon.

New BEA Releases Show Faster Growth and Higher Inflation

Image created by ChatGPT

The Bureau of Economic Analysis (BEA) released two reports this morning (June 25): “GDP (Third Estimate), Industries, Corporate Profits, State GDP, and State Personal Income, 1st Quarter 2026” and “Personal Income and Outlays, May 2026.” The BEA revised upward its estimate of real GDP growth in the first quarter of 2026 from an annual rate of 1.6 percent to an annual rate of 2.1 percent. Economists surveyed by LSEG had expected that the BEA would leave its estimate of real GDP growth in the first quarter unchanged. The following figure shows the BEA’s estimated rates of real GDP growth in each quarter beginning with the first quarter of 2022.

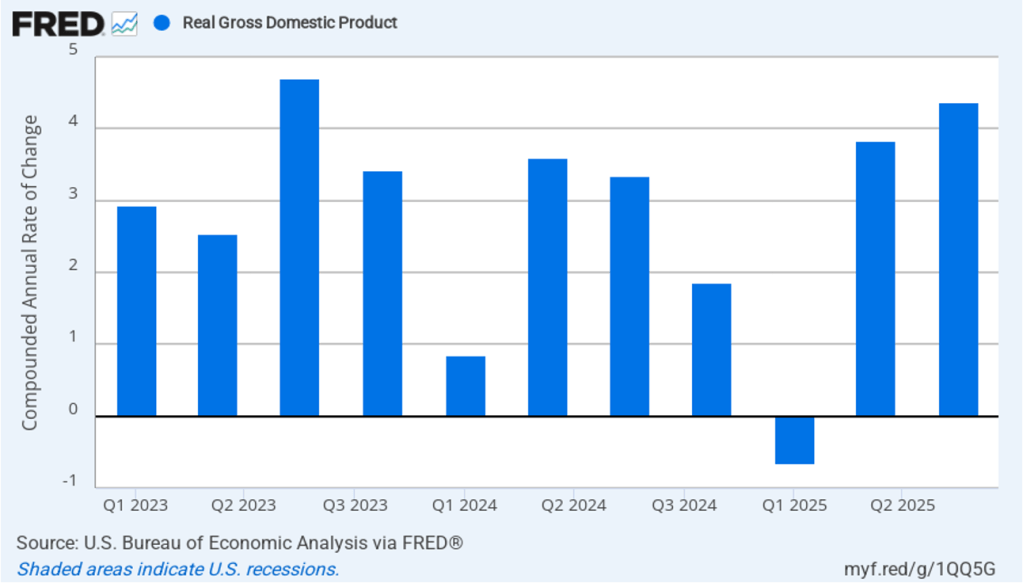
As we’ve discussed in previous blog posts, to better gauge the state of the economy, policymakers—including former Fed Chair Jerome Powell—often prefer to strip out the effects of imports, inventory investment, and government expenditures—which can be volatile—by looking at real final sales to private domestic purchasers, which includes only spending by U.S. households and firms on domestic production. As the following figure shows, real final sales to domestic purchasers increased at an annual rate of 1.7 percent in the first quarter, below the 2.1 percent rate of increase in real GDP and close to the U.S. economy’s expected long-run annual real growth rate of 1.8 percent. Note also that real final sales to private domestic purchasers grew by 2.9 percent in the third quarter of 2025, during which real GDP grew by 4.4 percent, and by 1.9 percent in the first quarter of 2025, when real GDP declined by 0.6 percent. So this measure of output is more stable, and likely is a better indicator of the underlying growth rate in the economy, than is the growth rate of real GDP.


The BEA’s “Personal Income and Outlays” report this morning included monthly data on the personal consumption expenditures (PCE) price index. The Fed relies on annual changes in the PCE price index to evaluate whether it’s meeting its 2 percent annual inflation target. (Fed Chair Kevin Warsh has indicated that in the future he may want the Fed to focus on a different measure of inflation.)

The following figure shows headline PCE inflation (the blue line) and core PCE inflation (the red line)—which excludes energy and food prices—for the period since January 2019, with inflation measured as the percentage change in the PCE from the same month in the previous year. In May, headline PCE inflation was 4.1 percent, up from 3.8 percent in April, and the highest rate since April 2023. Core PCE inflation in May was 3.4 percent, up slightly from 3.3 percent in April. Headline PCE inflation was equal to the forecasts of economists surveyed by FactSet, while core PCE inflation was slightly higher. Both headline PCE inflation and core PCE inflation remain well above the Fed’s 2 percent annual inflation target.

The following figure shows monthly PCE inflation and monthly core PCE inflation calculated by compounding the current month’s rate over an entire year. (Often referred to as 1-month inflation.) Measured this way, headline PCE inflation increased from 5.0 percent in April to 5.5 percent in May. Core PCE inflation rose from 3.0 in April to 3.9 percent in May. Even leaving aside the effect of rising gasoline prices on headline PCE, these data show that in May both core and headline PCE inflation were well above the Fed’s target.


Former Fed Chair Jerome Powell frequently mentioned that inflation in non-market services can skew PCE inflation. Non-market services are services whose prices the BEA imputes rather than measures directly. For instance, the BEA assumes that prices of financial services—such as brokerage fees—vary with the prices of financial assets. So that if stock prices rise, the prices of financial services included in the PCE price index also rise. Powell has argued that these imputed prices “don’t really tell us much about … tightness in the economy. They don’t really reflect that.” The following figure shows 12-month headline inflation (the blue line) and 12-month core inflation (the red line) for market-based PCE. (The BEA explains the market-based PCE measure here.)

Headline market-based PCE inflation was 3.9 percent in May, up from 3.7 percent in April. Core market-based PCE inflation was 3.2 percent in May, up slightly from 3.1 percent in April. So, both market-based measures, although lower than the full PCE measures, show inflation in May remaining well above the Fed’s 2 percent target.

New Fed Chair Kevin Warsh argued in testimony before the Senate that the Fed should stop relying on headline PCE inflation: “The measures [of inflation] I prefer are looking at things that are called trimmed averages. We take out all of the tail-risks, all of the one-off items, and we ask ourselves whether the generalized change in prices is having second-order effects on the economy.” 

Trimmed-mean PCE inflation drops the 31 percent of goods and services with the highest inflation rates and the 24 percent of goods and services with the lowest inflation rates. A closely related measure, median PCE inflation, is calculated by listing the inflation rate in each individual good or service included in the PCE and identifying the inflation rate of the good or service that is in the middle of the list—that is, the inflation rate in the price of the good or service that has an equal number of higher and lower inflation rates. 

The following figure shows headline PCE inflation the (blue line), core PCE inflation (the red line) and trimmed-mean PCE inflation (the brown line). Trimmed-mean PCE inflation in May was 2.4 percent, well below both headline and core PCE inflation.

The following figure from the web site of the Federal Reserve Bank of Cleveland shows headline PCE inflation (the green line), core PCE inflation (the blue line), and median PCE inflation (the brown line). In May, median PCE inflation was 2.8 percent, also below both headline and core inflation. So Warsh has a point that these two measures of inflation, which are less affected by particularly high or low rates of inflation in some goods and services, indicate that inflation has been running below the Fed’s currently preferred measure. But these measures also show inflation still running well above the Fed’s 2 percent annual inflation target.

Today’s macro data have had little effect on investors who buy and sell federal funds futures contracts. These investors still expect that the Federal Open Market Committee (FOMC) will leave its target for the federal funds rate unchanged at its meeting on July 28–29 but will raise the target by 0.25 percentage point at its September 15–16 meeting.

New BEA Releases Show Slower Growth and High Inflation

Image created by ChatGPT

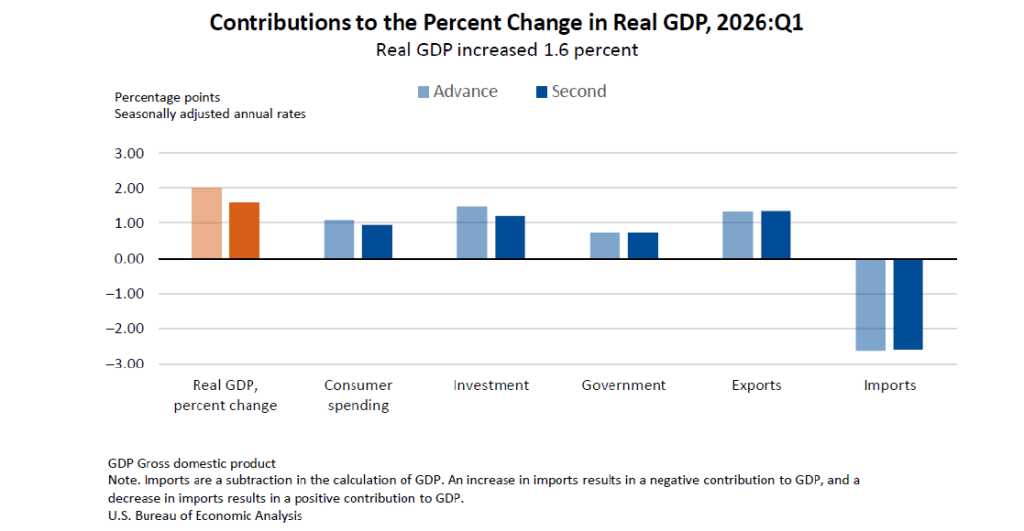
The Bureau of Economic Analysis (BEA) released two reports this morning (May 28): “GDP (Second Estimate) and Corporate Profits, 1st Quarter 2026” and “Personal Income and Outlays, April 2026.” The BEA revised downward its estimate of real GDP growth in the first quarter of 2026 from an annual rate of 2.0 percent to an annual rate of 1.6 percent. Economists surveyed by the Wall Street Journal had expected that the BEA would leave its estimate of real GDP growth in the first quarter unchanged. The following figure shows the BEA’s estimated rates of GDP growth in each quarter beginning with the first quarter of 2022.

The following figure—taken from the BEA report—shows the contributions of each component of spending to the BEA’s downward revision of its estimate of GDP growth. The growth of both consumption spending and investment spending, which are the largest component of GDP, were revised downward. The downward revision in consumption spending reflects lower spending on services and the downward revision in investment spending reflects lower business spending on inventories.

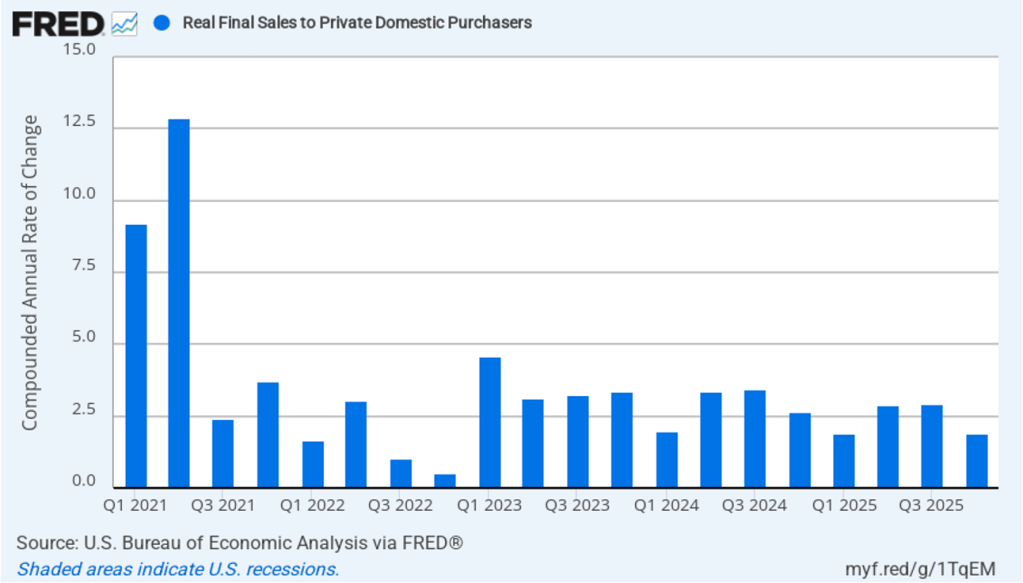
As we’ve discussed in previous blog posts, to better gauge the state of the economy, policymakers—including former Fed Chair Jerome Powell—often prefer to strip out the effects of imports, inventory investment, and government expenditures—which can be volatile—by looking at real final sales to private domestic purchasers, which includes only spending by U.S. households and firms on domestic production. As the following figure shows, real final sales to domestic purchasers increased at an annual rate of 2.4 percent in the first quarter, which was well above the 1.6 percent rate of increase in real GDP and also above the U.S. economy’s expected long-run annual real growth rate of 1.8 percent. Note also that real final sales to private domestic purchasers grew by 2.9 percent in the third quarter of 2025, during which real GDP grew by 4.4 percent, and by 1.9 percent in the first quarter of 2025, when real GDP declined by 0.6 percent. So this measure of output is more stable and likely is a better indicator of the underlying growth rate in the economy than is the growth rate of real GDP.

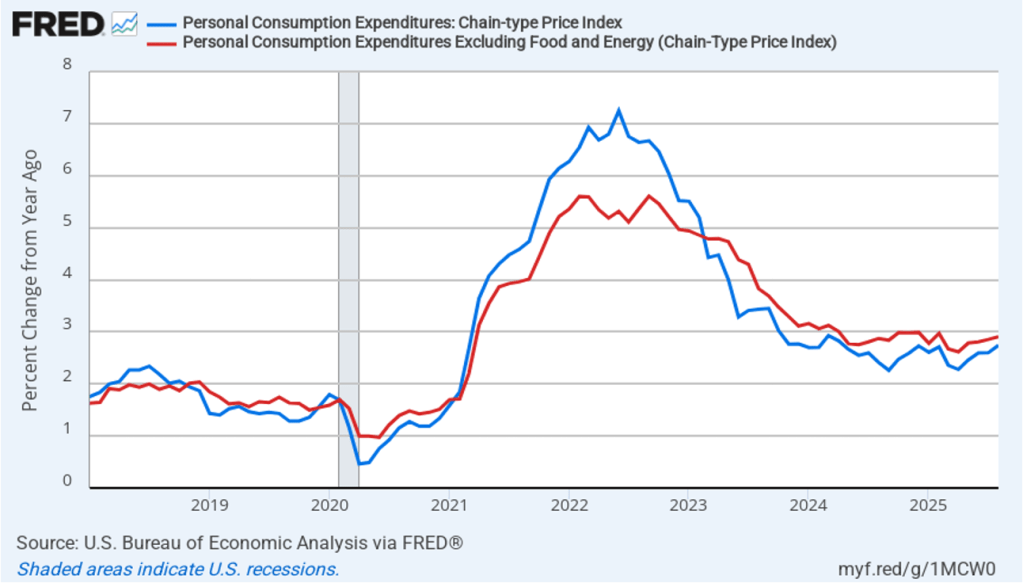
The BEA’s “Personal Income and Outlays” report this morning included monthly data on the personal consumption expenditures (PCE) price index. The Fed relies on annual changes in the PCE price index to evaluate whether it’s meeting its 2 percent annual inflation target. The following figure shows headline PCE inflation (the blue line) and core PCE inflation (the red line)—which excludes energy and food prices—for the period since January 2019, with inflation measured as the percentage change in the PCE from the same month in the previous year. In April, headline PCE inflation was 3.8 percent, up from 3.5 percent in March. Core PCE inflation in April was 3.3 percent, up slightly from 3.2 percent in March. Headline PCE inflation was slightly below and core PCE inflation was equal to the forecasts of economists surveyed by FactSet. Both headline PCE inflation and core PCE inflation remain well above the Fed’s 2 percent annual inflation target.

The following figure shows monthly PCE inflation and monthly core PCE inflation calculated by compounding the current month’s rate over an entire year. (Often referred to as 1-month inflation.) Measured this way, headline PCE inflation fell from the very high rate of 8.9 percent in March to a still high rate of 4.9 percent in April. Core PCE inflation declined from 3.6 in March to 2.9 percent in April. Even leaving aside the effect of rising gasoline prices on headline PCE, these data show that in March both core and headline PCE inflation were well above the Fed’s target.

Former Fed Chair Jerome Powell frequently mentioned that inflation in non-market services can skew PCE inflation. Non-market services are services whose prices the BEA imputes rather than measures directly. For instance, the BEA assumes that prices of financial services—such as brokerage fees—vary with the prices of financial assets. So that if stock prices rise, the prices of financial services included in the PCE price index also rise. Powell has argued that these imputed prices “don’t really tell us much about … tightness in the economy. They don’t really reflect that.” The following figure shows 12-month headline inflation (the blue line) and 12-month core inflation (the red line) for market-based PCE. (The BEA explains the market-based PCE measure here.)

Headline market-based PCE inflation was 3.7 percent in April, up from 3.4 percent in March. Core market-based PCE inflation was 3.1 percent in April, unchanged from March. So, both market-based measures, although lower than the full PCE measures, show inflation in April remaining well above the Fed’s 2 percent target.

New Fed Chair Kevin Warsh argued in testimony before the Senate that the Fed should stop relying on headline PCE inflation: “The measures [of inflation] I prefer are looking at things that are called trimmed averages. We take out all of the tail-risks, all of the one-off items, and we ask ourselves whether the generalized change in prices is having second-order effects on the economy.”

Trimmed-mean PCE inflation drops the 31 percent of goods and services with the highest inflation rates and the 24 percent of goods and services with the lowest inflation rates. A closely related measure, median PCE inflation, is calculated by listing the inflation rate in each individual good or service included in the PCE and identifying the inflation rate of the good or service that is in the middle of the list—that is, the inflation rate in the price of the good or service that has an equal number of higher and lower inflation rates. 

The following figure shows headline PCE inflation the (blue line), core PCE inflation (the brown line) and trimmed-mean PCE inflation (the red line). Trimmed-mean PCE inflation in April was 2.4 percent, well below both headline and core PCE inflation.

The following figure from the web site of the Federal Reserve Bank of Cleveland shows headline PCE inflation (the green line), core PCE inflation (the blue line), and median PCE inflation (the brown line). In April, median PCE inflation was 2.8 percent, also below both headline and core inflation. So Warsh has a point that these two measures of inflation, which are less affected by particularly high or low rates of inflation in some goods and services, indicate that inflation has been running below the Fed’s currently preferred measure. But these measures also show inflation running well above the Fed’s 2 percent annual inflation target.

Today’s macro data have had little effect on investors who buy and sell federal funds futures contracts. For some time, investors have seen little likelihood that the Fed’s policymaking Federal Open Market Committee would cut its target for the federal funds rate until sometime next year. These investors see it as far more likely that the committee will raise its target by the end of the year than that it will cut it.

A Double Dose of Bad Inflation News

Image generated by ChatGPT

This morning, the Bureau of Labor Statistics (BLS) released its report on the consumer price index (CPI) for March. Yesterday,  the Bureau of Economic Analysis (BEA) released monthly data on the personal consumption expenditures (PCE) price index for February as part of its “Personal Income and Outlays” report.  Both reports showed that the inflation has worsened. Note that data for the PCE were collected before the beginning of the conflict with Iran.

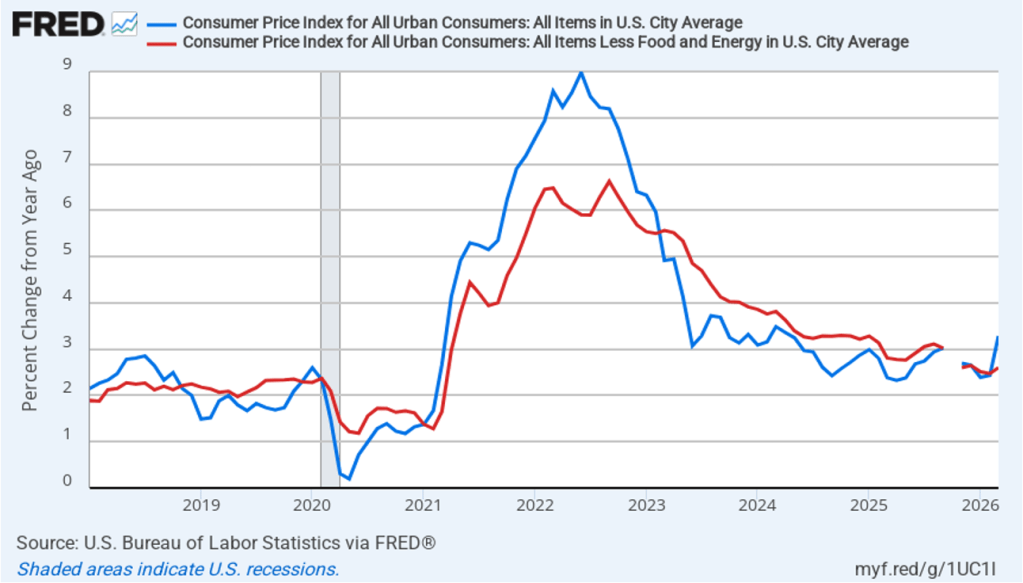
CPI Inflation jumped to a level well above the Federal Reserve’s 2 percent annual inflation target. The following figure compares headline CPI inflation (the blue line) and core CPI inflation (the red line). Because of the effects of the federal government shutdown, the BLS didn’t report inflation rates for October or November, so both lines show gaps for those months.  

  • The headline inflation rate, which is measured by the percentage change in the CPI from the same month in the previous year, was 3.3 percent in March, up from 2.4 percent in February. 
  • The core inflation rate, which excludes the prices of food and energy, was 2.6 percent in March, up only slightly from 2.5 percent in February. 

Headline inflation was equal to the forecast of economists surveyed by the Wall Street Journal but well below the 3.7 percent rate forecast by economists surveyed by FactSet. Core inflation was slightly below the forecast of 2.7 percent in both surveys. Higher energy prices drove the jump in CPI inflation.

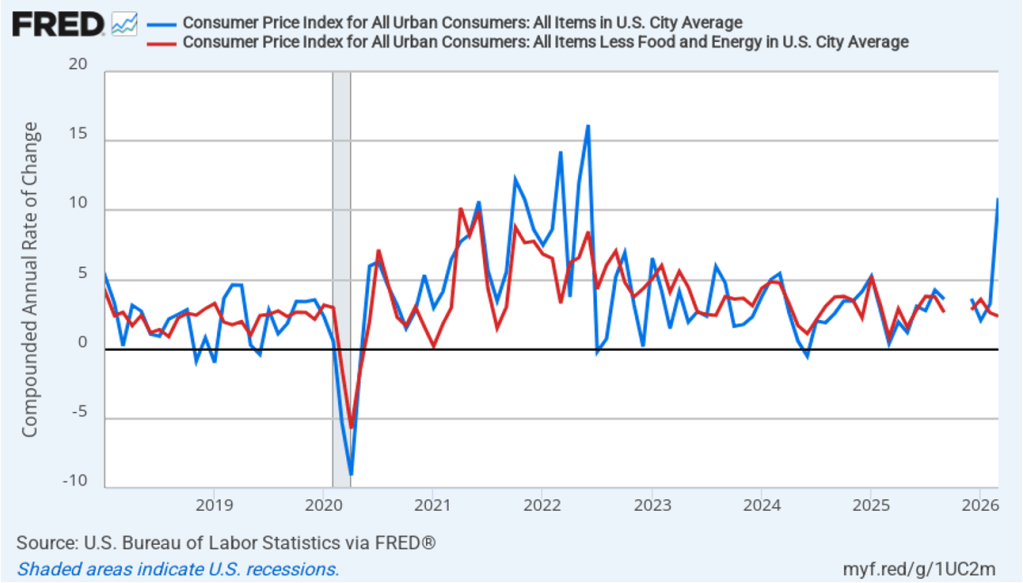
In the following figure, we look at the 1-month inflation rate for headline and core inflation—that is the annual inflation rate calculated by compounding the current month’s rate over an entire year. Calculated as the 1-month inflation rate, headline inflation (the blue line) was 10.9 percent in March, up from 3.2 percent in February. Core inflation (the red line) actually decreased to 2.4 in March from 2.6 percent in February.

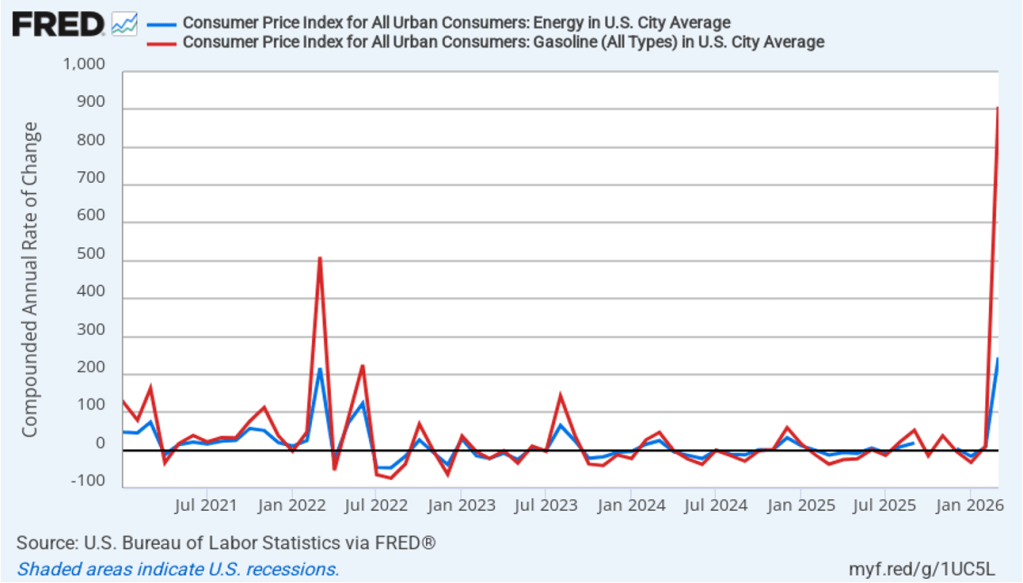
The following figure emphasizes the role paid by energy prices in causing the jump in inflation. The blue line shows the 1-month inflation rate in all energy prices included in the CPI. The red line shows the 1-month inflation rate in gasoline prices—which was an astounding 907.4 percent.

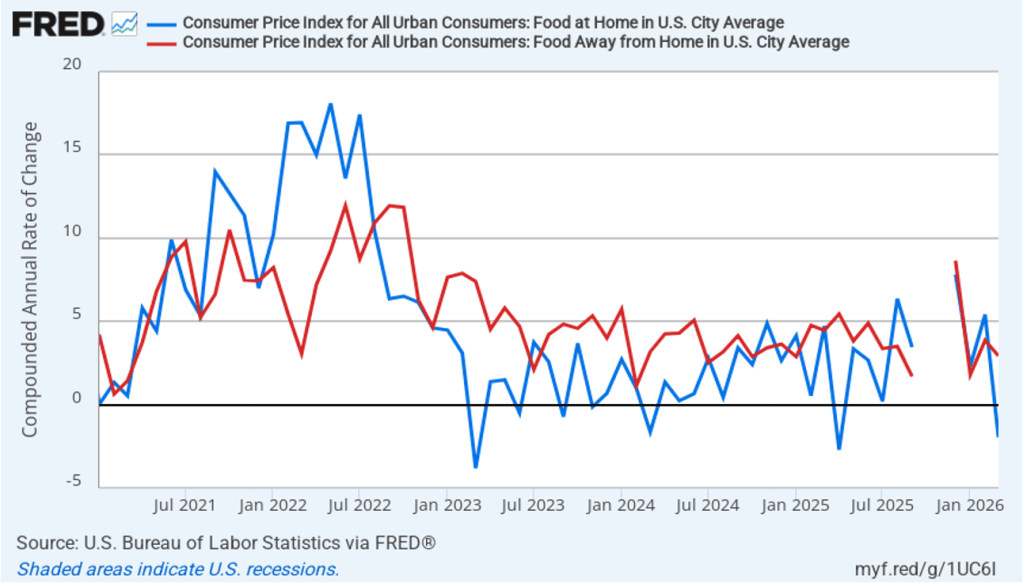
Did the jump in energy prices pass through to increases in food prices, which are a key concern for many consumers? The following figure shows 1-month inflation in the CPI category “food at home” (the blue bar)—primarily food purchased at grocery stores—and the category “food away from home” (the red bar)—primarily food purchased at restaurants. Inflation in both measures fell in March, indicating that they hadn’t (yet?) been affected by rising energy prices. Food at home actually decreased by 1.9 percent in March after increasing by 5.4 percent in February. Food away from home increased 2.9 percent in March, down from 3.9 percent in February.

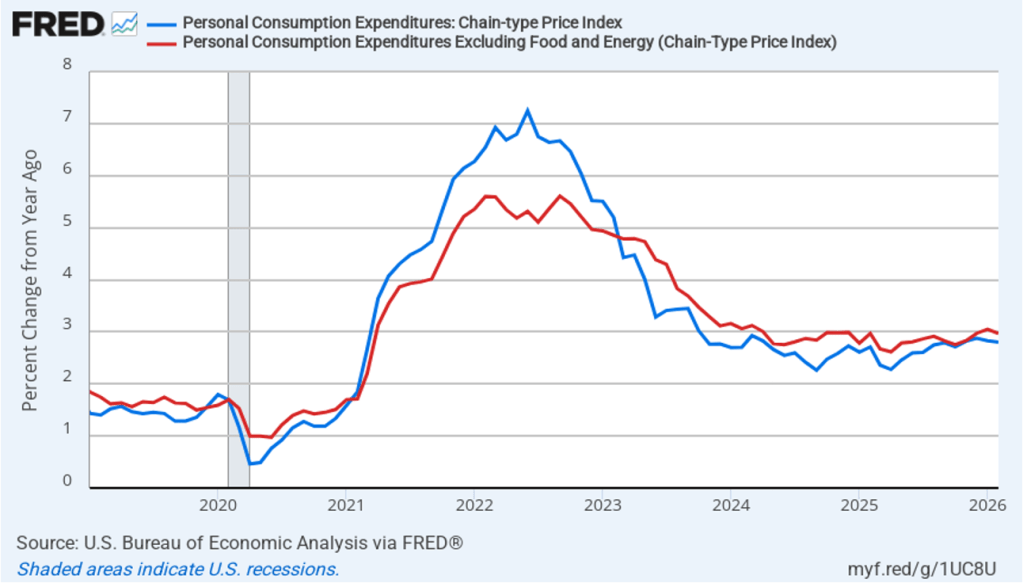
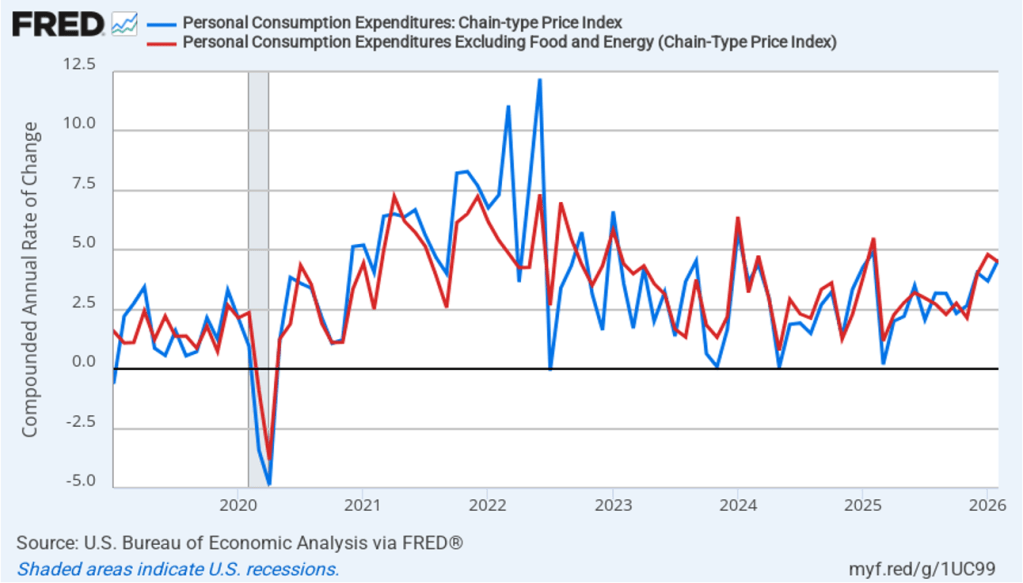
Turning now to PCE inflation for February. The following figure shows headline PCE inflation (the blue line) and core PCE inflation (the red line)—which excludes energy and food prices—with inflation measured as the percentage change in the PCE from the same month in the previous year. Headline PCE inflation was 2.8 percent in February, unchanged from January. Core PCE inflation was 3.0 percent in February, down slight from 3.1 percent in January . Headline inflation was slightly higher and core inflation was equal to the forecast of economists surveyed by FactSet.

The following figure shows 1-month headline PCE inflation and core PCE. Measured this way, headline PCE inflation increased from 3.7 percent in January to 4.6 percent in February. Core PCE inflation declined from 4.8 percent in January to 4.5 percent in February. So, even before the effects of the escalation in energy prices, both 1-month and 12-month PCE inflation are telling the same story of inflation above the Fed’s target—well above in the case of 1-month inflation. These numbers raise significant concern about whether inflation was making progress toward the Fed’s 2 percent target even before the effects of the rise in energy prices.

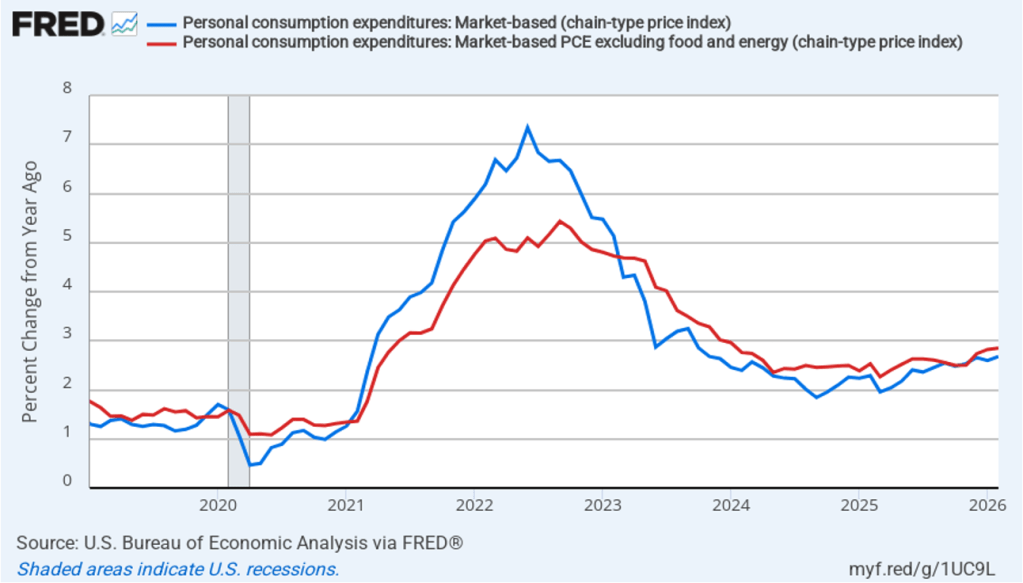
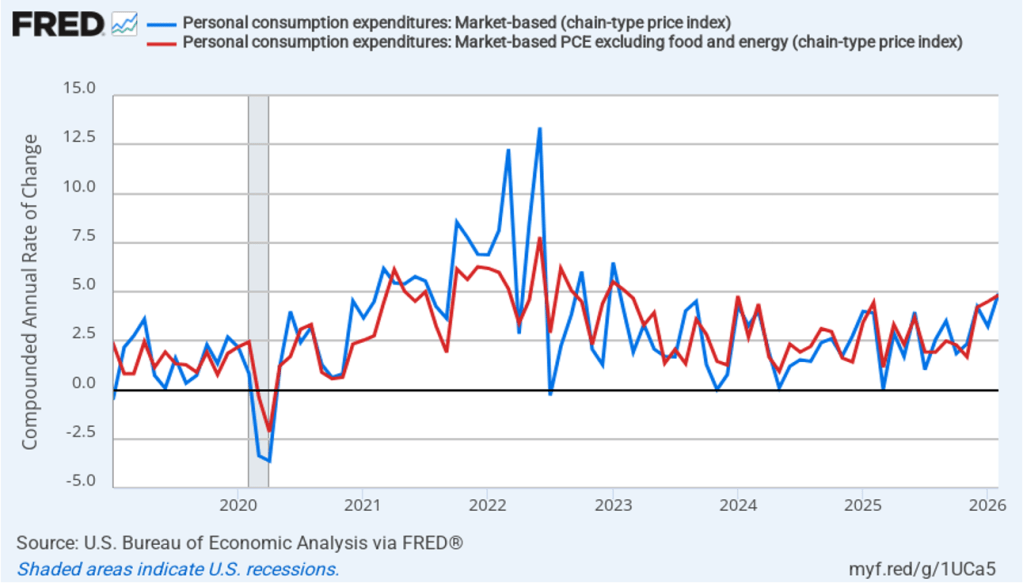
Fed Chair Jerome Powell has frequently mentioned that inflation in non-market services can skew PCE inflation. Non-market services are services whose prices the BEA imputes rather than measures directly. For instance, the BEA assumes that prices of financial services—such as brokerage fees—vary with the prices of financial assets. So that if stock prices rise, the prices of financial services included in the PCE price index also rise. Powell has argued that these imputed prices “don’t really tell us much about … tightness in the economy. They don’t really reflect that.” The following figure shows 12-month headline inflation (the blue line) and 12-month core inflation (the red line) for market-based PCE. (The BEA explains the market-based PCE measure here.)

Headline market-based PCE inflation was 2.7 percent in February, up slightly from 2.6 percent in January. Core market-based PCE inflation was 2.9 percent in February, up slightly from 2.8 percent in January. So, both market-based measures show inflation as stable but well above the Fed’s 2 percent target.

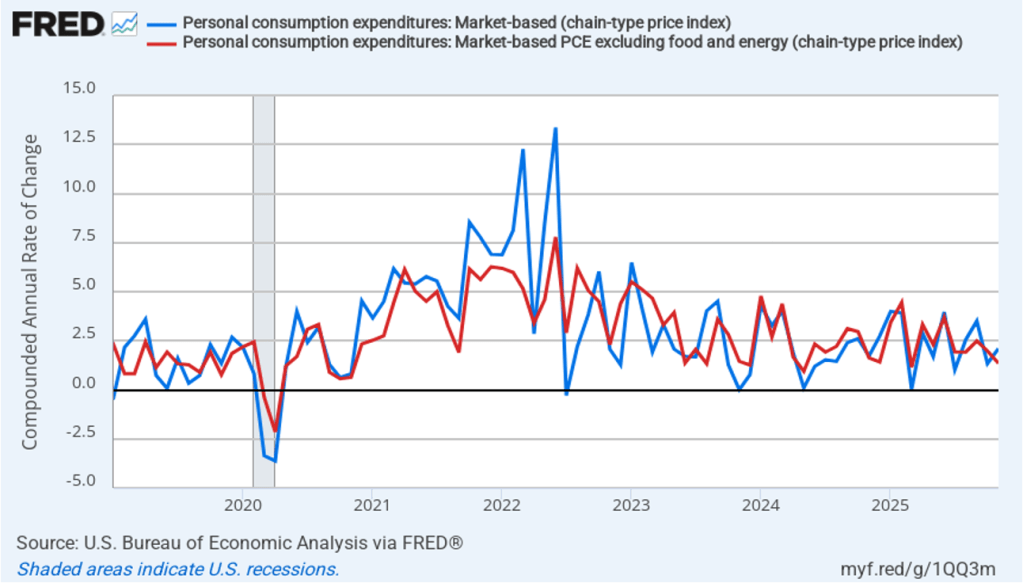
In the following figure, we look at 1-month inflation using these measures. One-month headline market-based inflation increased to 2.1 percent in November from 1.3 percent in October. One-month core market-based inflation fell to 1.3 percent in November from 2.0 percent in October. So, in November, 1-month market-based inflation was at or below the Fed’s annual inflation target. As the figure shows, the 1-month inflation rates are more volatile than the 12-month rates, which is why the Fed relies on the 12-month rates when gauging how close it is coming to hitting its target inflation rate.

What effect are these troubling inflation reports likely to have on the Fed’s policymaking Federal Open Market Committee (FOMC) at its next meeting on April 28–29—likely Jerome Powell’s last meeting as Fed chair? Economists generally recommend that central banks “look through”—that is, take no action—in response to a supply shock. A supply shock ordinarily results in a one-time increase in the price level, rather than a long-lasting increase in inflation. Fed policymakers, though, are aware that inflation has been running above their 2 percent target for more than five years. The possibility that even a temporary spike in inflation might result in a significant increase in the inflation rate that households and firms expect is a concern. At this point, investors in the federal funds futures market assign only a very small probability to the FOMC raising or lowering its target for the federal funds rate at the next several meetings. Following the next meeting, Powell will give his thoughts on these and other issues at a press conference.

Real GDP Growth Revised Downward as PCE Inflation Is Slightly Lower than Expected

Image generated by ChatGPT

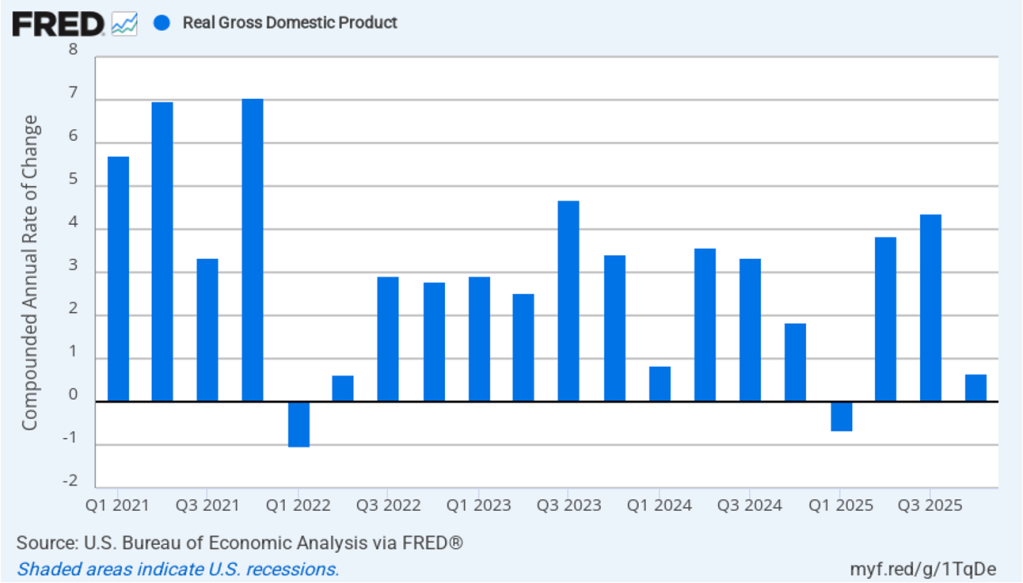
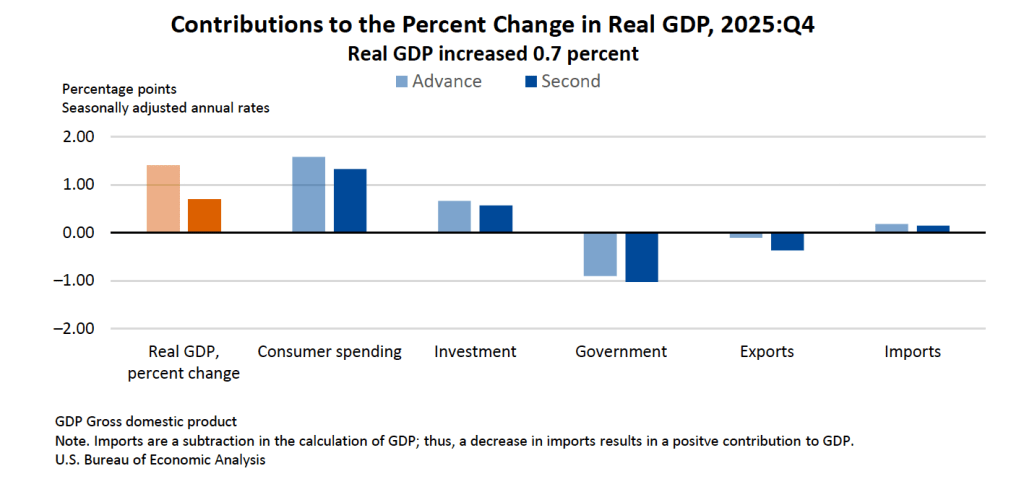
The Burea of Economic Analysis (BEA) released two reports this morning. One report included a revision of estimated growth in real GDP during the fourth quarter of 2025 from an advance estimate of 1.4 percent—which was already lower than had been expected—to 0.7 percent. Economists surveyed by the Wall Street Journal had expected that fourth quarter growth would be revised upward to 1.5 percent. The BEA’s “Personal Income and Outlays, January 2026” report indicated that the personal consumption expenditures (PCE) price index had increased 2.8 percent over the past year, slightly below the 2.9 percent that economists had expected.

The following figure shows the estimated rates of GDP growth in each quarter beginning with the first quarter of 2021.

As the following figure—taken from the BEA report—shows, consumer spending, investment spending, government spending, and net exports were all revised downward from the original advance estimates. The decline in real government expenditures of –1.0 percent at an annual rate—revised downward from –0.9 percent—was  the most important factor contributing to the slowing growth in real GDP during the fourth quarter. The decline in government expenditures is largely attributable to the federal government shutdown, which lasted from October 1, 2025 to November 12, 2025.

As we’ve discussed in previous blog posts, to better gauge the state of the economy, policymakers—including Fed Chair Jerome Powell—often prefer to strip out the effects of imports, inventory investment, and government expenditures—which can be volatile—by looking at real final sales to private domestic purchasers, which includes only spending by U.S. households and firms on domestic production. As the following figure shows, real final sales to domestic purchasers increased by 1.9 percent in the fourth quarter at an annual rate—revised downward from the advance estimate of 2.4 percent—which was well above the 0.9 percent increase in real GDP and slightly above the U.S. economy’s expected long-run annual real growth rate of 1.8 percent. Note also that real final sales to private domestic purchasers grew by 2.9 percent in the third quarter, during which real GDP grew by 4.4 percent, and by 1.9 percent in the first quarter of 2025, when real GDP declined by 0.6 percent. So this measure of output is more stable and likely is a better indicator of the underlying growth rate in the economy than is growth in real GDP.

The second BEA report this morning included monthly data on the personal consumption expenditures (PCE) price index for January 2026. The Fed relies on annual changes in the PCE price index to evaluate whether it’s meeting its 2.0 percent annual inflation target. The following figure shows headline PCE inflation (the blue line) and core PCE inflation (the red line)—which excludes energy and food prices— with inflation measured as the percentage change in the PCE from the same month in the previous year. In January 2026, headline PCE inflation was 2.8 percent, down slightly from 2.9 percent in December 2025 (which was also the inflation rate economists had expected for January 2026). Core PCE inflation in January was 3.1 percent, up slightly from 3.0 in December. Both headline PCE inflation and core PCE inflation remained above the Fed’s 2.0 percent annual inflation target.

The following figure shows headline PCE inflation and core PCE inflation calculated by compounding the current month’s rate over an entire year. (The figure above shows what is sometimes called 12-month inflation, while the figure below shows 1-month inflation.) Measured this way, headline PCE inflation declined to 3.4 percent in January, from to 4.4 percent in December. Core PCE inflation fell to 4.4 percent in January from 4.5 percent in December. Measured this way, both core and headline PCE inflation were well above the Fed’s target.


Fed Chair Jerome Powell has frequently mentioned that inflation in non-market services can skew PCE inflation. Non-market services are services whose prices the BEA imputes rather than measures directly. For instance, the BEA assumes that prices of financial services—such as brokerage fees—vary with the prices of financial assets. So that if stock prices fall, the prices of financial services included in the PCE price index also fall. Powell has argued that these imputed prices “don’t really tell us much about … tightness in the economy. They don’t really reflect that.” The following figure shows 12-month headline inflation (the blue line) and 12-month core inflation (the red line) for market-based PCE. (The BEA explains the market-based PCE measure here.)

Headline market-based PCE inflation was 2.6 percent in January, down from 2.7 percent in December. Core market-based PCE inflation was 2.8 percent in January, up from 2.7 in December. So, both market-based measures show inflation as stable but above the Fed’s 2 percent target.

In the following figure, we look at 1-month inflation using these measures. One-month headline market-based inflation was 3.3 percent in January, down from 4.3 percent in December. One-month core market-based inflation increased to 4.6 percent in January from 4.4 percent in December. As the figure shows, the 1-month inflation rates are more volatile than the 12-month rates, which is why the Fed relies on the 12-month rates when gauging how close it is coming to hitting its target inflation rate.

Today’s data arrive against the backdrop of the conflict in Iran. According to the AAA, gasoline prices have risen to an average of $3.63 per gallon from $2.94 a month ago. Assuming that the conflict is resolved relatively soon, that increase should have only a transitory effect on inflation. Chair Powell as indicated that he believes that the upward pressure of tariffs on the price level is also still working its way through the economy.

Recent macroeconomic data, along with the effects of tariffs and the conflict in Iran, make it unlikely that members of the Fed’s policymaking Federal Open Market Committee (FOMC) will reduce their target range for the federal funds rate any time soon. The probability that investors in the federal funds futures market assign to the FOMC keeping its target rate unchanged at its March 17–18 meeting decreased only slightly this afternoon to 99.1 percent from rom 99.9 percent yesterday. Investors don’t assign a greater than 50 percent probability to the FOMC cutting its federal funds rate target at any meeting before the meeting on October 27–28.

PCE Inflation Remains Steady While Real Personal Consumption Spending Rises

Image created by ChatGPT

On January 22, the Bureau of Economic Analysis (BEA) released monthly data on the personal consumption expenditures (PCE) price index and on real personal consumption spending for October and November as part of its “Personal Income and Outlays” report. Because of the federal government shutdown, two months of data were released together with some of the price data for October being imputed because the Bureau of Labor Statistics was unable to collect some consumer price data in that month. The release of data for December has been delayed.

The following figure shows headline PCE inflation (the blue line) and core PCE inflation (the red line)—which excludes energy and food prices—with inflation measured as the percentage change in the PCE from the same month in the previous year. In November, headline PCE inflation was 2.8 percent, up slightly from 2.7 percent in October. Core PCE inflation in November was also 2.8 percent, up slightly from 2.7 percent in November. Both headline and core PCE inflation for November were equal to the forecast of economists surveyed by the Wall Street Journal.

The following figure shows headline PCE inflation and core PCE inflation calculated by compounding the current month’s rate over an entire year. (The figure above shows what is sometimes called 12-month inflation, while the figure below shows 1-month inflation.) Measured this way, headline PCE inflation increased from 1.9 percent in October to 2.5 percent in November. Core PCE inflation declined from 2.5 percent in October to 1.9 percent in November. So, both 1-month and 12-month PCE inflation are telling the same story of inflation somewhat above the Fed’s target. The usual caution applies that 1-month inflation figures are volatile (as can be seen in the figure).

Fed Chair Jerome Powell has frequently mentioned that inflation in non-market services can skew PCE inflation. Non-market services are services whose prices the BEA imputes rather than measures directly. For instance, the BEA assumes that prices of financial services—such as brokerage fees—vary with the prices of financial assets. So that if stock prices rise, the prices of financial services included in the PCE price index also rise. Powell has argued that these imputed prices “don’t really tell us much about … tightness in the economy. They don’t really reflect that.” The following figure shows 12-month headline inflation (the blue line) and 12-month core inflation (the red line) for market-based PCE. (The BEA explains the market-based PCE measure here.)

Headline market-based PCE inflation was 2.5 percent in November, up slightly from 2.4 percent in October. Core market-based PCE inflation was 2.4 percent in November, down slightly from 2.5 percent in October. So, both market-based measures show inflation as stable but above the Fed’s 2 percent target.

In the following figure, we look at 1-month inflation using these measures. One-month headline market-based inflation increased to 2.1 percent in November from 1.3 percent in October. One-month core market-based inflation fell to 1.3 percent in November from 2.0 percent in October. So, in November, 1-month market-based inflation was at or below the Fed’s annual inflation target. As the figure shows, the 1-month inflation rates are more volatile than the 12-month rates, which is why the Fed relies on the 12-month rates when gauging how close it is coming to hitting its target inflation rate.

Data on real personal consumption expenditures were also included in this report. The following figure shows compound annual rates of growth of real personal consumptions expenditures for each month since January 2023. Measured this way, the growth in real personal consumptions expenditures rebounded from 1.3 percent in September to 3.7 percent in both October and October and November.

Strong growth in real personal consumption is consistent with the strong growth in real GDP in the third quarter of 2025 shown in the following figure, which reflects revised data that the BEA released yesterday. Real GDP grew at a compound annual rate of 3.8 percent in October and 4.4 percent in November. indicating a strong rebound in output growth following a 0.6 percent decrease in real GDP in the first quarter of 2025.

Is it likely that real GDP continued its strong growth in the fourth quarter of 2025? Economists at the Federal Reserve Bank of Atlanta prepare nowcasts of real GDP. A nowcast is a forecast that incorporates all the information available on a certain date about the components of spending that are included in GDP. The Atlanta Fed calls its nowcast GDPNow. As the following figure from the Atlanta Fed website shows, today the GDPNow estimate—taking into account this week’s macroeconomic data—is that real GDP grew at an annual rate of 5.4 percent in the fourth quarter of 2025.

These data confirm the widely-held view among economists and investors that the Federal Reserve’s policy-making Federal Open Market committee will keep its target for the federal funds rate unchanged at is next meeting on January 27–28.

Real GDP Growth Revised Up and PCE Inflation Running Slightly Below Expectations

Image generated by ChatGPT

Today (September 26), the Bureau of Economic Analysis (BEA) released monthly data on the personal consumption expenditures (PCE) price index as part of its “Personal Income and Outlays” report. Yesterday, the BEA released its revised estimate of real GDP growth in the second quarter. Taken together, the two reports show that economic growth remains realtively strong and that inflation continues to run above the Fed’s 2 percent annual target.

Taking the inflation report first, the following figure shows headline PCE inflation (the blue line) and core PCE inflation (the red line)—which excludes energy and food prices—for the period since January 2018, with inflation measured as the percentage change in the PCE from the same month in the previous year. In August, headline PCE inflation was 2.7 percent, up from 2.6 percent in July. Core PCE inflation in August was 2.9 percent, unchanged from July. Headline PCE inflation was equal to the forecast of economists surveyed, while core PCE inflation was slightly lower than forecast.

The following figure shows headline PCE inflation and core PCE inflation calculated by compounding the current month’s rate over an entire year. (The figure above shows what is sometimes called 12-month inflation, while this figure shows 1-month inflation.) Measured this way, headline PCE inflation increased from 2.0 percent in July to 3.2 percent in August. Core PCE inflation declined slightly from 2.9 percent in July to 2.8 percent in August. So, both 1-month and 12-month PCE inflation are telling the same story of inflation being well above the Fed’s target. The usual caution applies that 1-month inflation figures are volatile (as can be seen in the figure). In addition, these data likely reflect higher prices resulting from the tariff increases the Trump administration has implemented. Once the one-time price increases from tariffs have worked through the economy, inflation may decline. It’s not clear, however, how long that may take and President Trump indicated yesterday that he may impose new tariffs on pharmaceuticals, large trucks, and furniture.

Fed Chair Jerome Powell has frequently mentioned that inflation in non-market services can skew PCE inflation. Non-market services are services whose prices the BEA imputes rather than measures directly. For instance, the BEA assumes that prices of financial services—such as brokerage fees—vary with the prices of financial assets. So that if stock prices fall, the prices of financial services included in the PCE price index also fall. Powell has argued that these imputed prices “don’t really tell us much about … tightness in the economy. They don’t really reflect that.” The following figure shows 12-month headline inflation (the blue line) and 12-month core inflation (the red line) for market-based PCE. (The BEA explains the market-based PCE measure here.)


Headline market-based PCE inflation was 2.4 percent in August, unchanged from July. Core market-based PCE inflation was 2.6 percent in August, also unchanged from July. So, both market-based measures show inflation as stable but above the Fed’s 2 percent target.

In the following figure, we look at 1-month inflation using these measures. One-month headline market-based inflation increase sharply to 2.5 percent in August from 0.9 percent in July. One-month core market-based inflation increased slightly to 1.9 percent in August from 1.8 percent in July. As the figure shows, the 1-month inflation rates are more volatile than the 12-month rates, which is why the Fed relies on the 12-month rates when gauging how close it is coming to hitting its target inflation rate.


Inflation running above the Fed’s 2 percent target is consistent with relatively strong growth in real GDP. The following figure shows compound annual rates of growth of real GDP, for each quarter since the first quarter of 2023. The value for the second quarter of 2025 is the BEA’s third estimate. This revised estimate increased the growth rate of real GDP to 3.8 percent from the second estimate of 3.3 percent.

The most important contributor to real GDP growth was growth in real personal consumption expenditures, which, as shown in the following figure, increased aat compound annual rate of 2.5 percent in the second quarter, up from 0.6 percent in the first quarter.

High interest rates continue to hold back residential construction, which declined by a compound annual rate of 5.1 percent in the second quarter after declining 1.0 percent in the first quarter.

Business investment in structures, such as factories and office buildings, continued a decline that began in the first quarter of 2024.

Will the relatively strong growth in real GDP in the second quarter continue in the third quarter? Economists at the Federal Reserve Bank of Atlanta prepare nowcasts of real GDP. A nowcast is a forecast that incorporates all the information available on a certain date about the components of spending that are included in GDP. The Atlanta Fed calls its nowcast GDPNow. As the following figure from the Atlanta Fed website shows, today the GDPNow forecast is for real GDP to grow at an annual rate of 3.9 percent in the third quarter.

Finally, the macroeconomic data released in the last two days has had realtively little effect on the expectations of investors trading federal funds rate futures. Investors assign an 89.8 percent probability to the Federal Open Market Committee (FOMC) cutting its target for the federal funds rate at its meeting on October 28–29 by 0.25 percentage point (25 basis points) from its current range of 4.00 percent to 4.25 percent. That probability is only slightly lower than 91.9 percent probaiblity that investors had assigned to a 25 basis point cut a week ago. However, the probability of the committee cutting its target rate by another 25 basis points at its December 9–10 fell to 67.0 percent today from 78.6 percent one week ago.