As Expected, CPI Inflation Falls Slightly in July

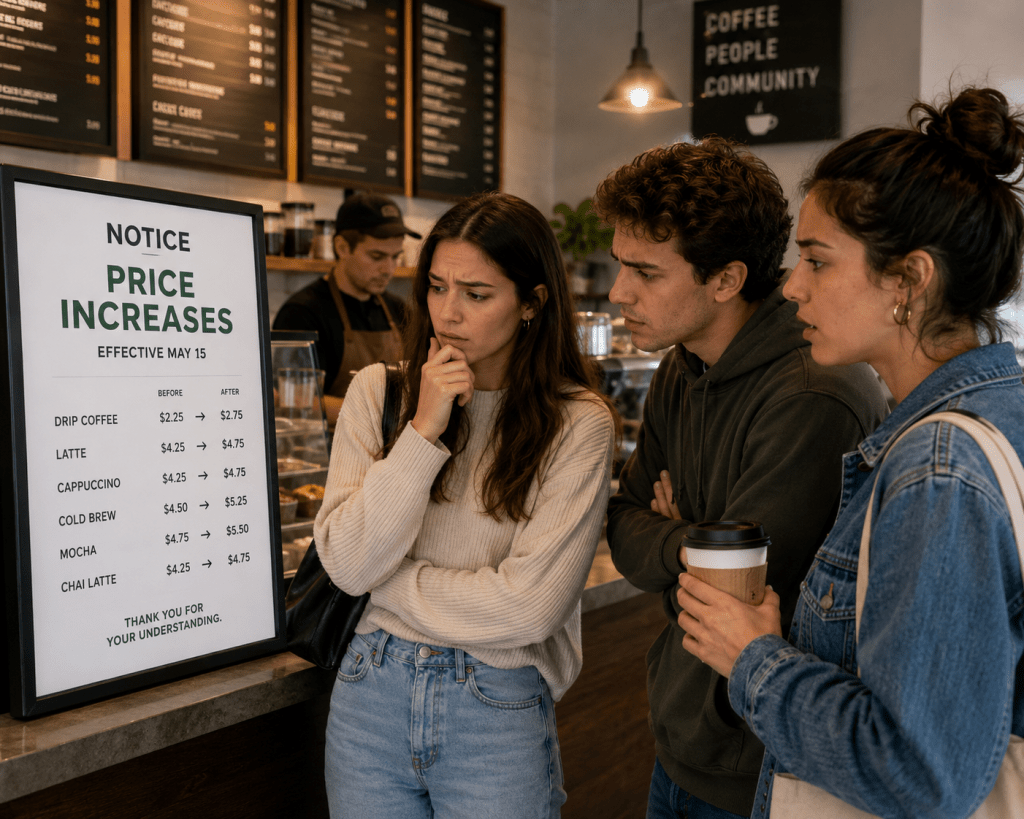
Image created by ChatGPT

Today (August 12), the Bureau of Labor Statistics (BLS) released its report on the consumer price index (CPI) for July. Lower energy and grocery prices contributed to a slight decline in the inflation rate in July compared with June.

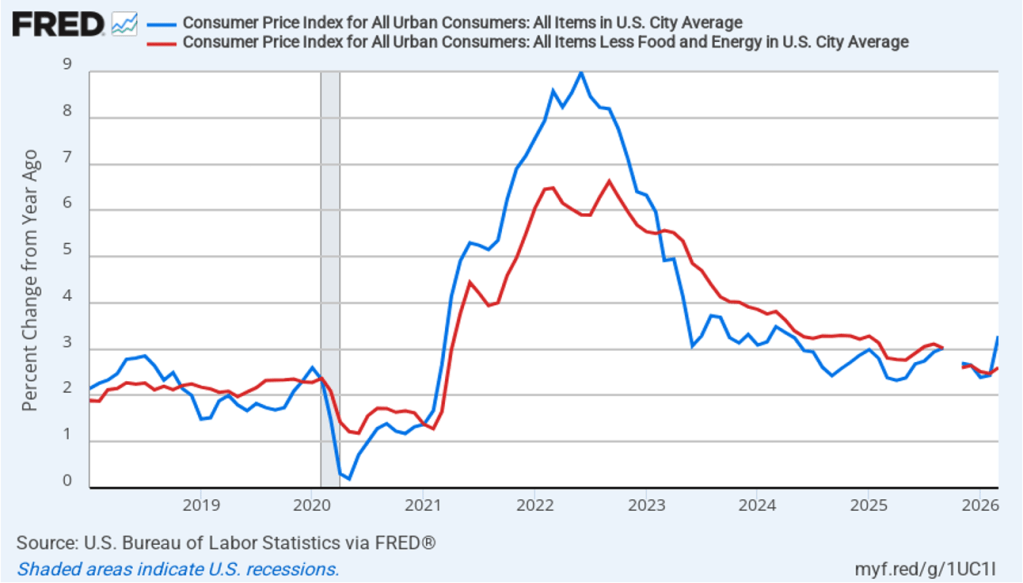
The following figure compares headline CPI inflation (the blue line) and core CPI inflation (the red line).

  • The headline inflation rate, which is measured by the percentage change in the CPI from the same month in the previous year, was 3.4 percent in July, down from 3.5 percent in June. 
  • The core inflation rate, which excludes the prices of food and energy, was 2.5 percent in July, down from 2.6 in June.  

Headline inflation and core inflation were both equal to the forecasts of economists surveyed by FactSet. (Note that because of last year’s federal government shutdown, inflation data for October 2025 are not available.)

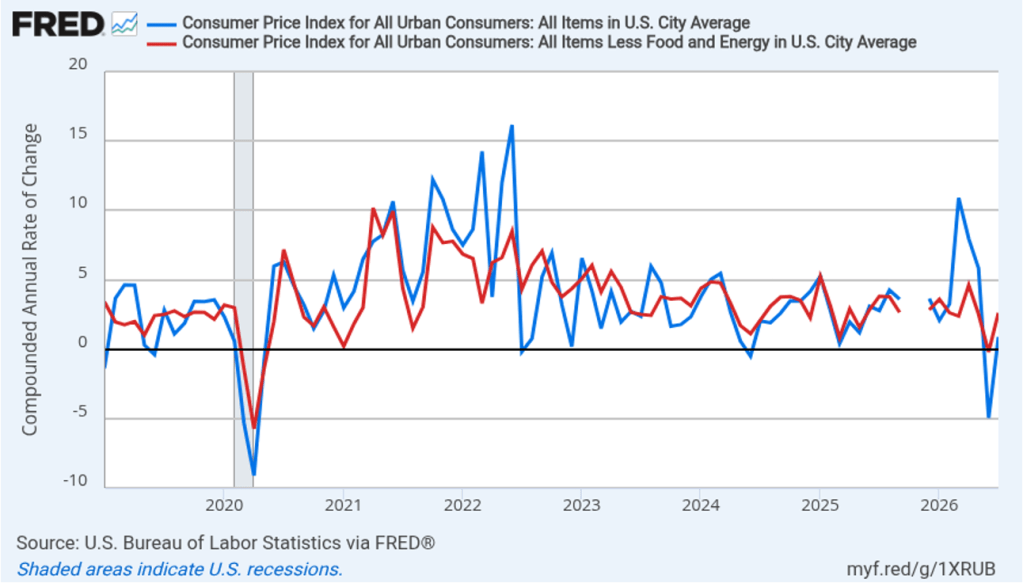
In the following figure, we look at the 1-month inflation rate for headline and core inflation—that is the annual inflation rate calculated by compounding the current month’s rate over an entire year. Calculated as the 1-month inflation rate, both headline (the blue line) and core inflation (the red line) increased in July from the negative values in June. That is, the U.S. economy experienced deflation in June because the price level, measured by the CPI and by the CPI less food and energy prices, fell in that month.

In July, 1-month headline CPI inflation was 0.9 percent and 1-month core CPI inflation was 2.6 percent.
The following figure illustrates the role played by energy prices in contributing to the large swings in the monthly inflation rate since the conflict in Iran began at the end of February. The red line shows the 1-month inflation rate in all energy prices included in the CPI. Inflation in energy prices, which had increased at annual rate of 245 percent in March, declined at an annual rate of 16.4 percent in July. The blue line shows the 1-month inflation rate in gasoline prices, which in March had spiked to more than 900 percent measured at an annual rate, declined at an annual rate of 29.4 percent in July. A return to full-scale hostilities in the Middle East would increase oil prices, which would likely lead to an increase in the U.S. inflation rate.

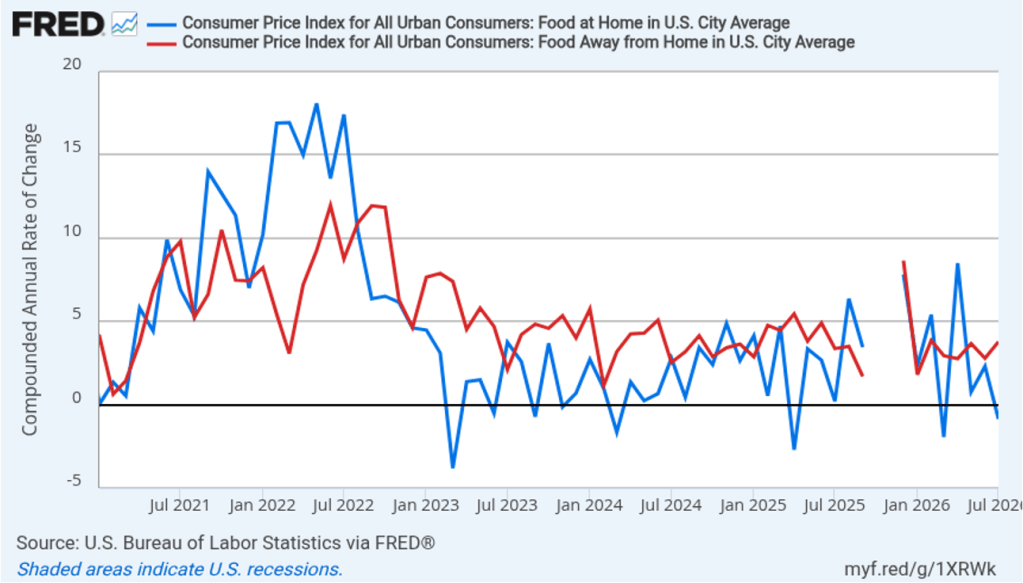
There had been a fear that the rise in energy prices that began in March would pass through to increases in food prices, which are a key concern for many consumers. The following figure shows 1-month inflation in the CPI category “food at home” (the blue bar)—primarily food purchased at grocery stores—and the category “food away from home” (the red bar)—primarily food purchased at restaurants. Inflation in grocery prices, which increased 2.3 percent in June, declined 0.9 percent in July. Inflation in food prices away from home increased from 2.8 percent in June to 3.8 percent in July. To this point, increases in energy priced do not seem to have caused a significant increase in either grocery prices or restaurant prices.
Today’s relatively good inflation report, following last week’s report showing an unexpected decline in employment, has likely reduced the chance that Federal Reserve policymakers will increase their target for the federal funds rate at the next meeting of the Federal Open Market Committee (FOMC) on September 15–16. In trading in the federal funds futures market this afternoon, investors assigned a 62.1 percent probability to the FOMC keeping its target unchanged at that meeting, which was up from a 51.6 probability yesterday. Traders assign a 53.2 percent probability to the committee increasing its target at its October 27–28 meeting, down from 62.2 percent yesterday.

It’s worth noting, however, that inflation is still running above the Federal Reserve’s 2 percent annual inflation target. In testimony before Congress in a hearing on his nomination as Fed Chair, Kevin Warsh cautioned that good news in a single month’s inflation report should be treated with caution. Warsh has intentionally moved away from discussing the circumstances under which monetary policy might change in the future—so-called forward guidance. (We discuss forward guidance in Macroeconomics, Chapter 15 (Economics, Chapter 25)). Uncertainty about actions the FOMC may take during its three remaining meeting this year remains high.
A Double Dose of Bad Inflation News

Image generated by ChatGPT

This morning, the Bureau of Labor Statistics (BLS) released its report on the consumer price index (CPI) for March. Yesterday,  the Bureau of Economic Analysis (BEA) released monthly data on the personal consumption expenditures (PCE) price index for February as part of its “Personal Income and Outlays” report.  Both reports showed that the inflation has worsened. Note that data for the PCE were collected before the beginning of the conflict with Iran.

CPI Inflation jumped to a level well above the Federal Reserve’s 2 percent annual inflation target. The following figure compares headline CPI inflation (the blue line) and core CPI inflation (the red line). Because of the effects of the federal government shutdown, the BLS didn’t report inflation rates for October or November, so both lines show gaps for those months.  

  • The headline inflation rate, which is measured by the percentage change in the CPI from the same month in the previous year, was 3.3 percent in March, up from 2.4 percent in February. 
  • The core inflation rate, which excludes the prices of food and energy, was 2.6 percent in March, up only slightly from 2.5 percent in February. 

Headline inflation was equal to the forecast of economists surveyed by the Wall Street Journal but well below the 3.7 percent rate forecast by economists surveyed by FactSet. Core inflation was slightly below the forecast of 2.7 percent in both surveys. Higher energy prices drove the jump in CPI inflation.

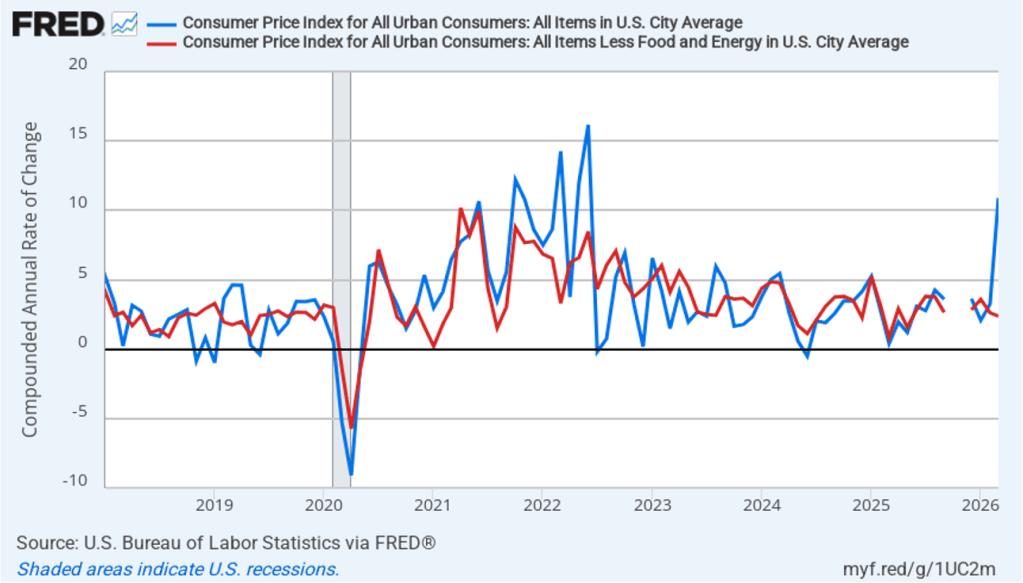
In the following figure, we look at the 1-month inflation rate for headline and core inflation—that is the annual inflation rate calculated by compounding the current month’s rate over an entire year. Calculated as the 1-month inflation rate, headline inflation (the blue line) was 10.9 percent in March, up from 3.2 percent in February. Core inflation (the red line) actually decreased to 2.4 in March from 2.6 percent in February.

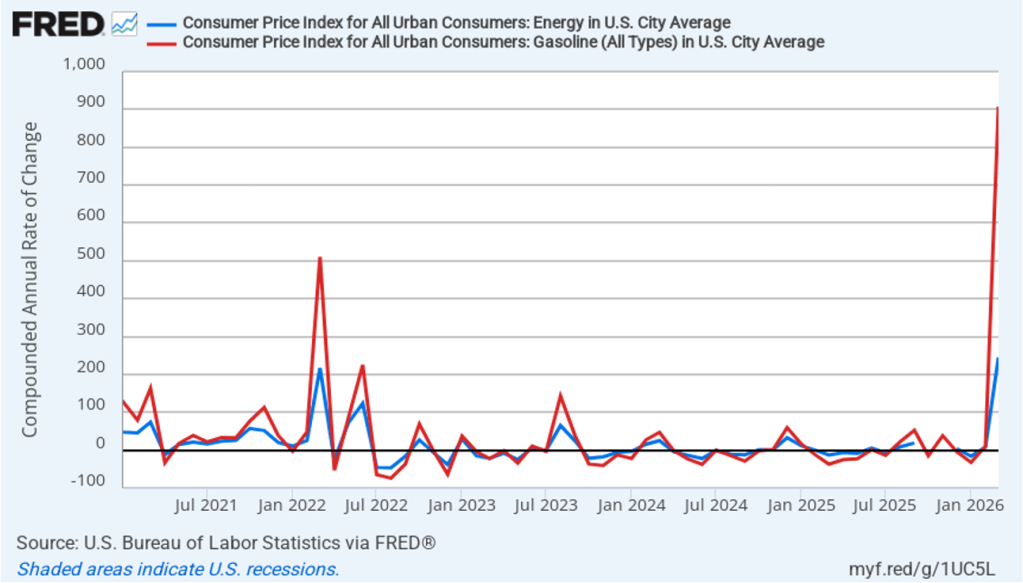
The following figure emphasizes the role paid by energy prices in causing the jump in inflation. The blue line shows the 1-month inflation rate in all energy prices included in the CPI. The red line shows the 1-month inflation rate in gasoline prices—which was an astounding 907.4 percent.

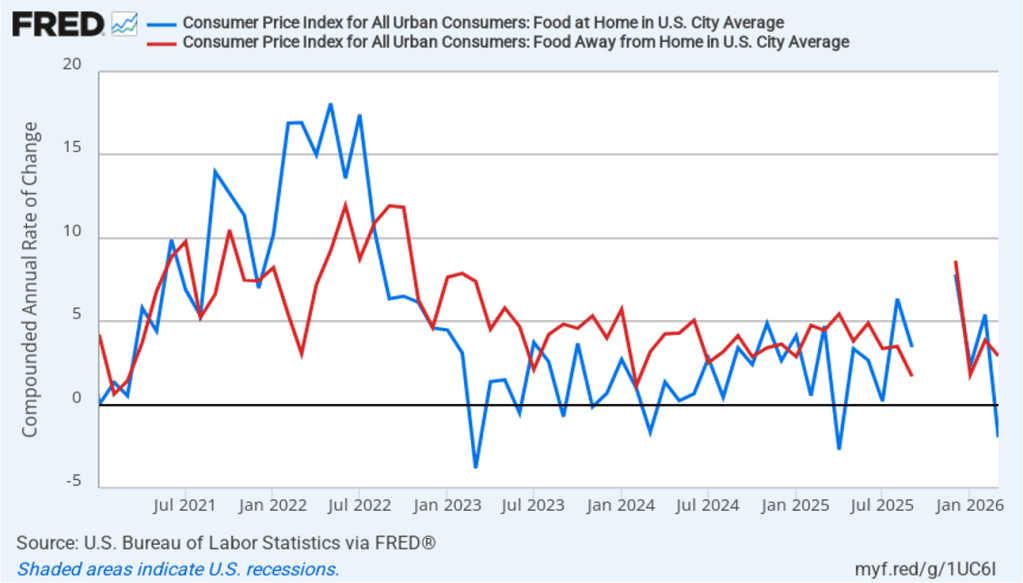
Did the jump in energy prices pass through to increases in food prices, which are a key concern for many consumers? The following figure shows 1-month inflation in the CPI category “food at home” (the blue bar)—primarily food purchased at grocery stores—and the category “food away from home” (the red bar)—primarily food purchased at restaurants. Inflation in both measures fell in March, indicating that they hadn’t (yet?) been affected by rising energy prices. Food at home actually decreased by 1.9 percent in March after increasing by 5.4 percent in February. Food away from home increased 2.9 percent in March, down from 3.9 percent in February.

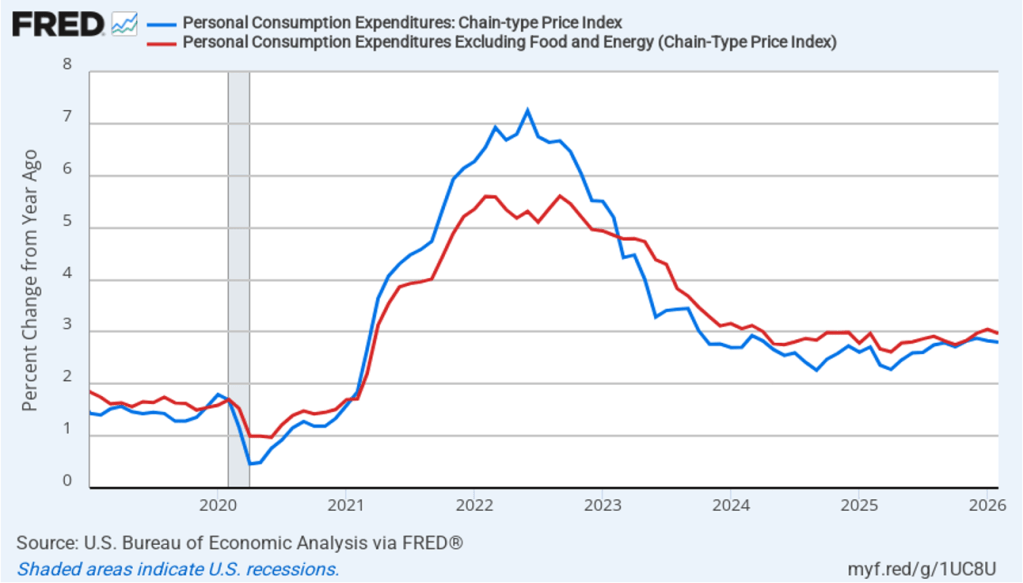
Turning now to PCE inflation for February. The following figure shows headline PCE inflation (the blue line) and core PCE inflation (the red line)—which excludes energy and food prices—with inflation measured as the percentage change in the PCE from the same month in the previous year. Headline PCE inflation was 2.8 percent in February, unchanged from January. Core PCE inflation was 3.0 percent in February, down slight from 3.1 percent in January . Headline inflation was slightly higher and core inflation was equal to the forecast of economists surveyed by FactSet.

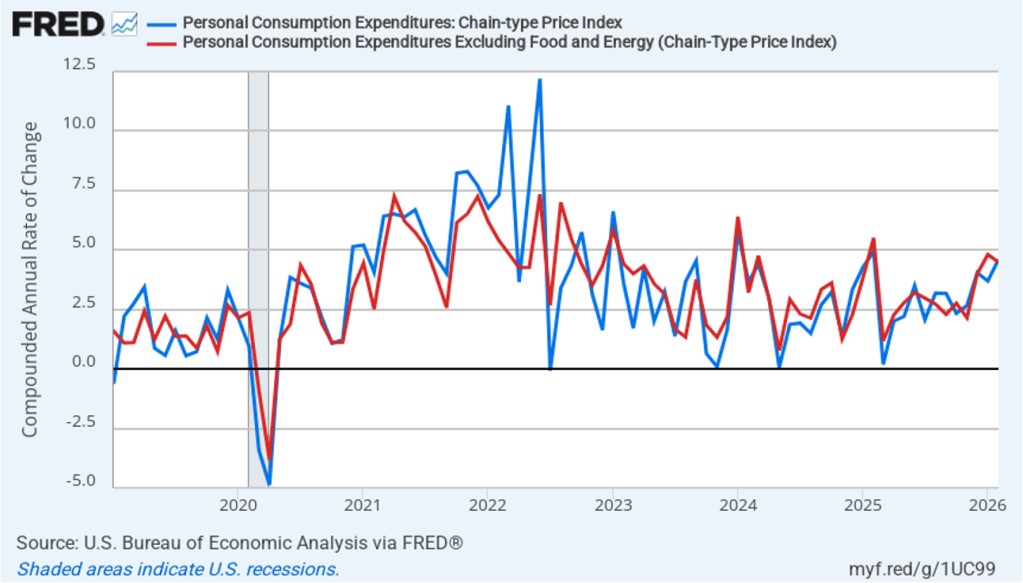
The following figure shows 1-month headline PCE inflation and core PCE. Measured this way, headline PCE inflation increased from 3.7 percent in January to 4.6 percent in February. Core PCE inflation declined from 4.8 percent in January to 4.5 percent in February. So, even before the effects of the escalation in energy prices, both 1-month and 12-month PCE inflation are telling the same story of inflation above the Fed’s target—well above in the case of 1-month inflation. These numbers raise significant concern about whether inflation was making progress toward the Fed’s 2 percent target even before the effects of the rise in energy prices.

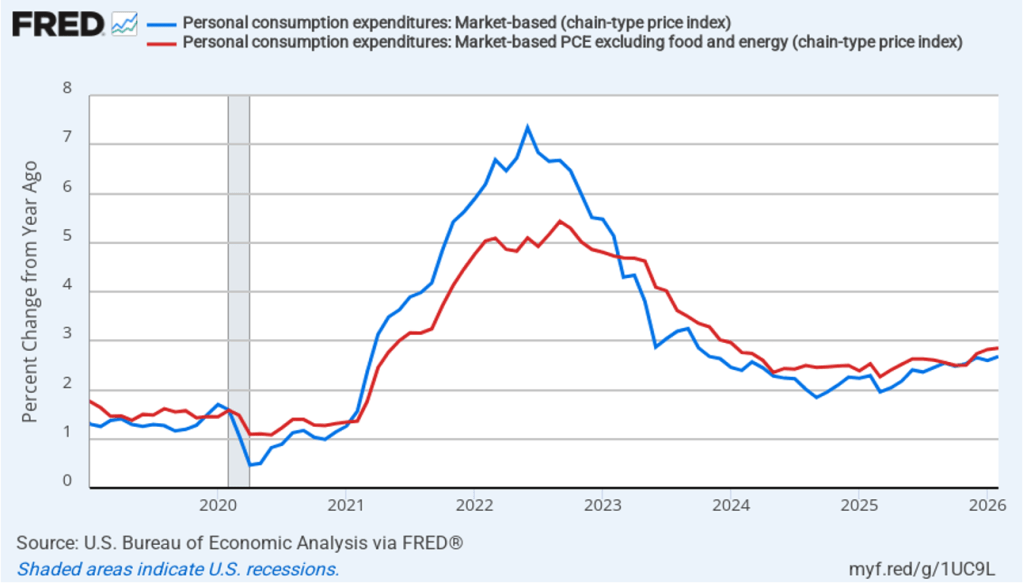
Fed Chair Jerome Powell has frequently mentioned that inflation in non-market services can skew PCE inflation. Non-market services are services whose prices the BEA imputes rather than measures directly. For instance, the BEA assumes that prices of financial services—such as brokerage fees—vary with the prices of financial assets. So that if stock prices rise, the prices of financial services included in the PCE price index also rise. Powell has argued that these imputed prices “don’t really tell us much about … tightness in the economy. They don’t really reflect that.” The following figure shows 12-month headline inflation (the blue line) and 12-month core inflation (the red line) for market-based PCE. (The BEA explains the market-based PCE measure here.)

Headline market-based PCE inflation was 2.7 percent in February, up slightly from 2.6 percent in January. Core market-based PCE inflation was 2.9 percent in February, up slightly from 2.8 percent in January. So, both market-based measures show inflation as stable but well above the Fed’s 2 percent target.

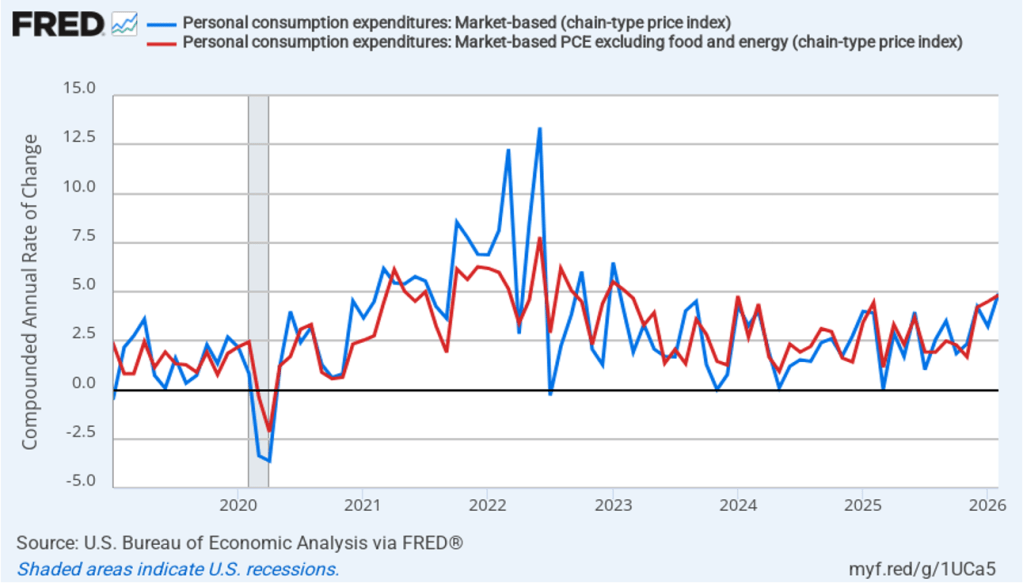
In the following figure, we look at 1-month inflation using these measures. One-month headline market-based inflation increased to 2.1 percent in November from 1.3 percent in October. One-month core market-based inflation fell to 1.3 percent in November from 2.0 percent in October. So, in November, 1-month market-based inflation was at or below the Fed’s annual inflation target. As the figure shows, the 1-month inflation rates are more volatile than the 12-month rates, which is why the Fed relies on the 12-month rates when gauging how close it is coming to hitting its target inflation rate.

What effect are these troubling inflation reports likely to have on the Fed’s policymaking Federal Open Market Committee (FOMC) at its next meeting on April 28–29—likely Jerome Powell’s last meeting as Fed chair? Economists generally recommend that central banks “look through”—that is, take no action—in response to a supply shock. A supply shock ordinarily results in a one-time increase in the price level, rather than a long-lasting increase in inflation. Fed policymakers, though, are aware that inflation has been running above their 2 percent target for more than five years. The possibility that even a temporary spike in inflation might result in a significant increase in the inflation rate that households and firms expect is a concern. At this point, investors in the federal funds futures market assign only a very small probability to the FOMC raising or lowering its target for the federal funds rate at the next several meetings. Following the next meeting, Powell will give his thoughts on these and other issues at a press conference.