Image created by ChatGPT
Today’s report from the Bureau of Labor Statistics (BLS) on the consumer price index (CPI) for August was eagerly awaited by economists and policy analysts. As we discuss in Macroeconomics, Chapter 15 (Economics, Chapter 25), monetary policy affects the economy with, in the words of Nobel Laureate Milton Friedman, “long and variable lags.” As a result, most economists agree that the Federal Reserve should not attempt to “fine tune” the economy by responding to each government release of macroeconomic data.
There are some instances, however, including the present, when the Fed’s policymaking Federal Open Market Committee (FOMC) appears to be uncertain as to whether a change in policy is needed. As a result, there was a widespread expectation that if today’s report indicated that inflation is slowing, the FOMC would likely leave its target for the federal funds rate unchanged at its meeting on Tuesday and Wednesday of next week. But if the report didn’t indicate that inflation is slowing, the committee would likely raise its target. The report gave few indications that inflation is slowing.
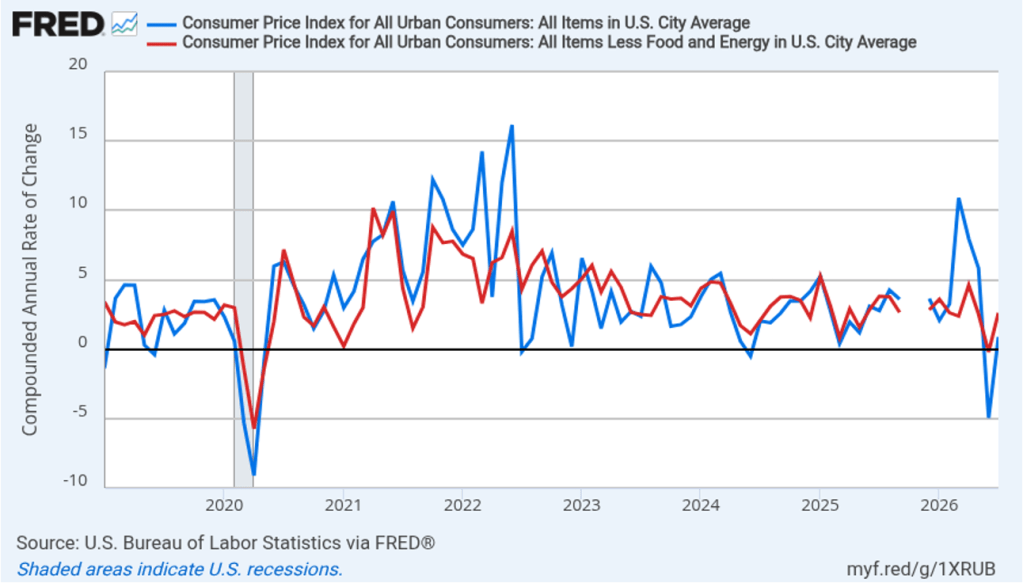
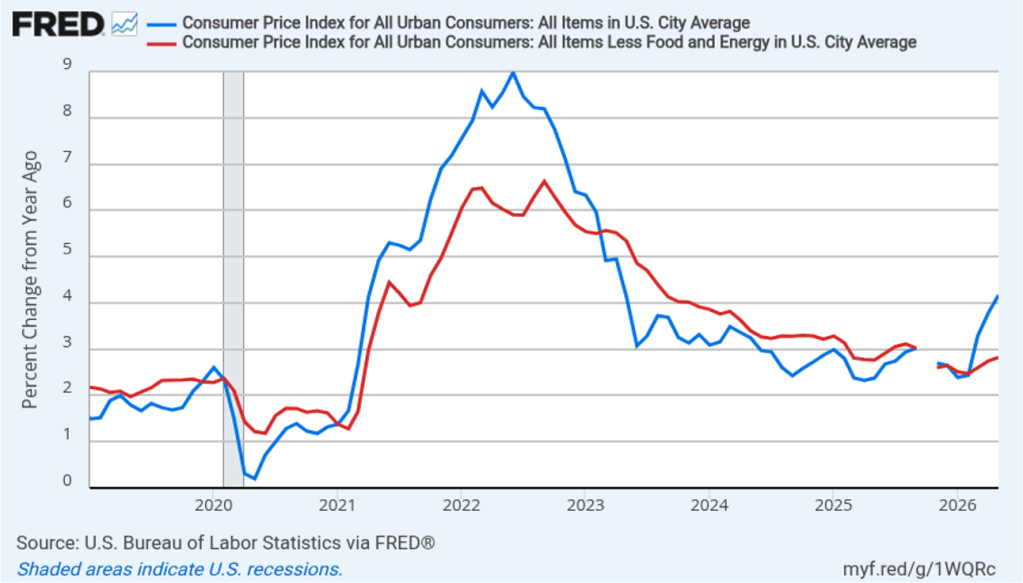
The following figure compares headline CPI inflation (the blue line) and core CPI inflation (the red line).
- The headline inflation rate, which is measured by the percentage change in the CPI from the same month in the previous year, was 3.4 percent in August, the same as in July.
- The core inflation rate, which excludes the prices of food and energy, was 2.4 percent in August, down from 2.5 in July.
Headline inflation was slightly higher, and core inflation was equal, to the forecasts of economists surveyed by FactSet. (Note that because of last year’s federal government shutdown, inflation data for October 2025 are not available.)

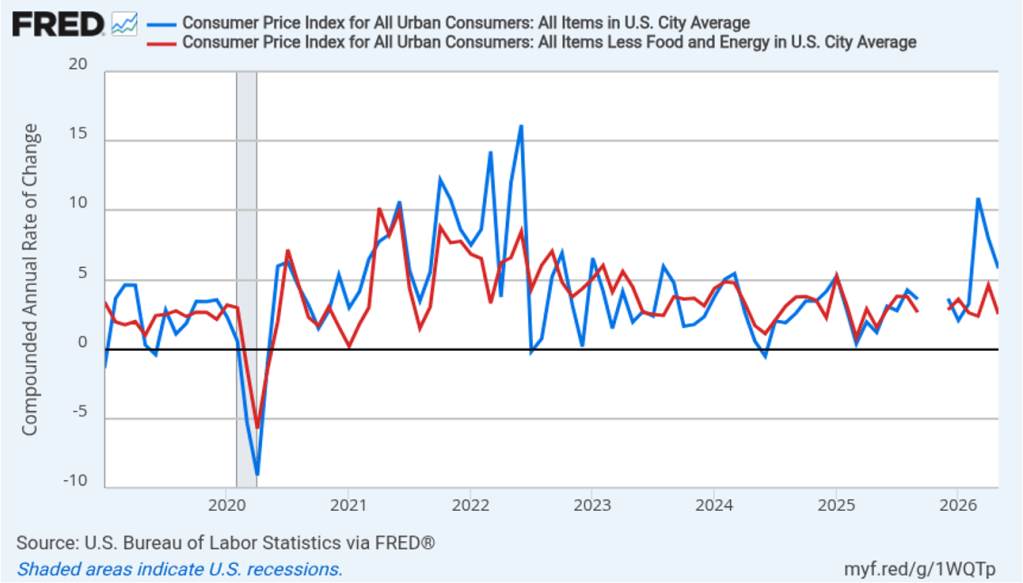
In the following figure, we look at the 1-month inflation rate for headline and core inflation—that is the annual inflation rate calculated by compounding the current month’s rate over an entire year. Calculated as the 1-month inflation rate, headline (the blue line) was 4.6 percent In August, up from 0.9 percent in July. Core inflation (the red line) was 3.5 percent in August, up from 2.6 percent in July.

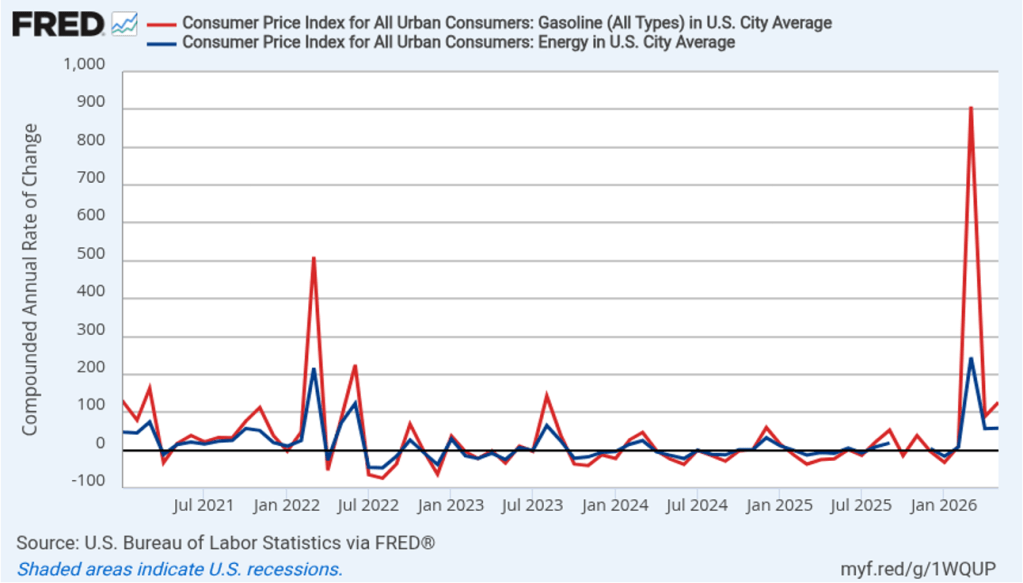
The following figure illustrates the role played by energy prices in contributing to the large swings in the monthly inflation rate since the conflict in Iran began at the end of February. The red line shows the 1-month inflation rate in all energy prices included in the CPI. Inflation in energy prices, which had declined at an annual rate of 16.4 percent in July, increased at an annual rate of 28.3 percent in August. The blue line shows the 1-month inflation rate in gasoline prices, which had declined at an annual rate of 29.4 percent in July, increased at an annual rate of 58.3 percent in August.

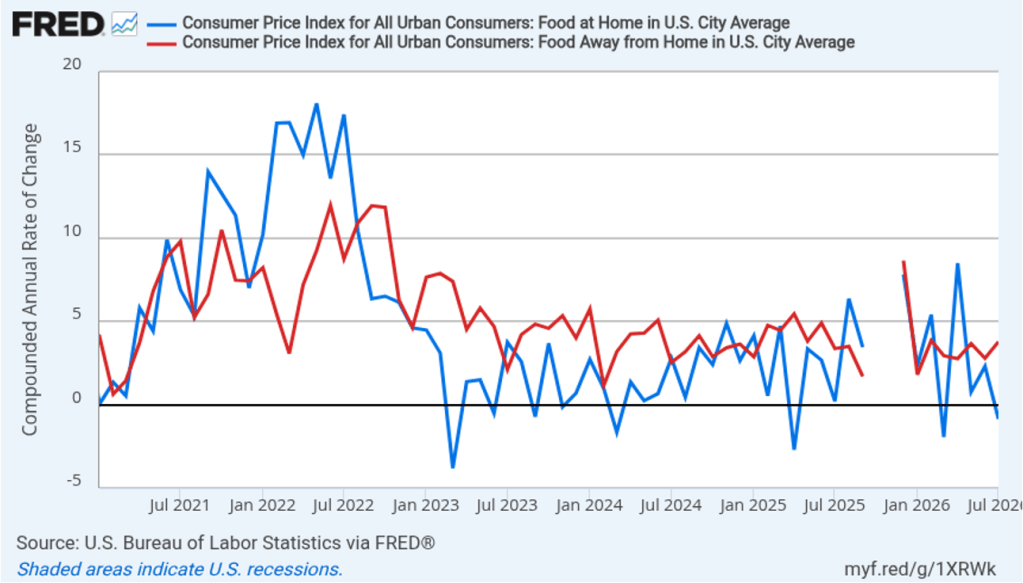
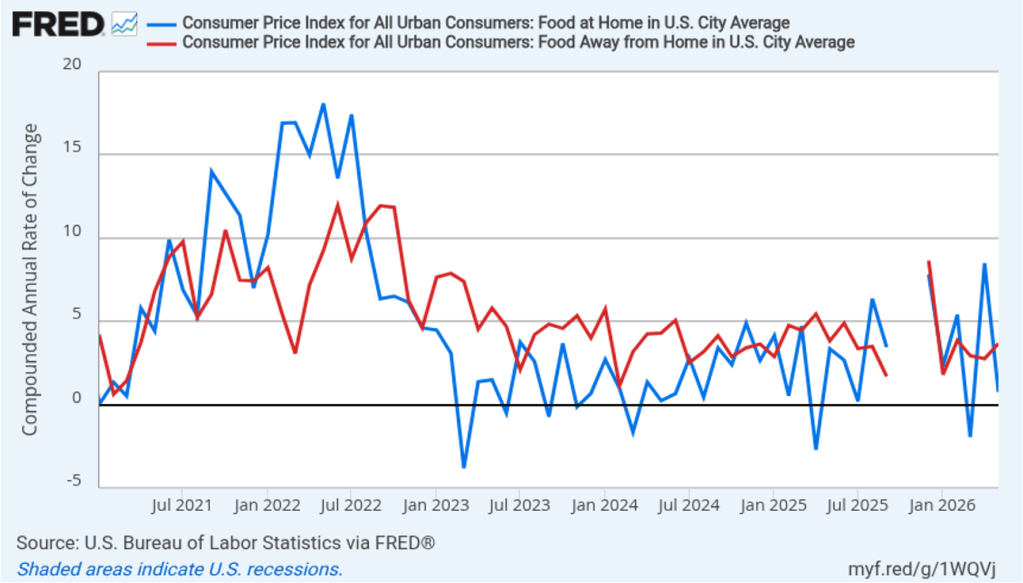
There had been a fear that the rise in energy prices that began in March would pass through to increases in food prices, which are a key concern for many consumers. The following figure shows 1-month inflation in the CPI category “food at home” (the blue bar)—primarily food purchased at grocery stores—and in the category “food away from home” (the red bar)—primarily food purchased at restaurants. Grocery prices, which had declined at annual rate of 0.9 percent in July, increased at an annual rate of 0.4 percent in August. Food prices away from home increased 3.1 percent in August, down from 3.9 percent in July. To this point, increases in energy prices seem to have had some effect on grocery prices and restaurant prices, although the extent of the effect is unclear.

Fed Chair Kevin Warsh has indicated that he favors measures of the inflation rate that exclude particularly small or particularly large changes in the prices of some goods or services—so-called outliers. Median CPI, which is compiled monthly by economists at the Federal Reserve Bank of Cleveland, is calculated by ranking the price changes of every good or service in the index from the largest price change to the smallest price change, and then choosing the price change in the middle. The idea is to eliminate the effect on measured inflation of any short-lived events that cause the prices of some goods and services to be particularly high or particularly low. Economists at the Cleveland Fed have conducted research that shows that, in their words, “the median CPI provides a better signal of the underlying inflation trend than either the all-items CPI or the CPI excluding food and energy. The median CPI is even better at forecasting [personal consumption expenditures] PCE inflation in the near and longer term than the core PCE price index.”
Trimmed-mean inflation, also compiled by economists at the Cleveland Fed, excludes the highest 8 percent of price changes and the lowest 8 percent. The following figure shows 1-month trimmed mean (the blue line) and median (the red line) CPI inflation. Trimmed-mean inflation was 2.7 percent in August, unchanged from July. Median inflation was 2.1 percent in August, down from 3.1 percent in July. So these measures of inflation are both lower than the conventional headline and core CPI inflation measures, although as the figure shows, both measures are volatile.

Note that the Fed uses the 12-month change in the personal consumption expenditures (PCE) price index, not the change in the CPI, when gauging whether it is hitting its 2 percent annual inflation target. Historically, PCE inflation has been about 0.4 percentage points to 0.5 percentage points lower than CPI inflation. The Bureau of Economic Analysis (BEA) won’t release its estimate of August PCE inflation until September 30, after the next FOMC meeting.
Today’s report showing that inflation remains persistently above the Fed’s 2 percent annual target, following last week’s jobs report showing an unexpectedly large increase in employment, has likely raised the chance that Federal Reserve policymakers will increase their target range for the federal funds rate from the current 3.50 percent to 3.75 percent by o.25 percentage points (or 25 basis points) at the next meeting of the FOMC on September 15–16. Trading in the federal funds futures market this afternoon indicates that investors assign a 86.5 percent probability to the FOMC raising its target range at that meeting, which is up from a 72.4 probability yesterday. Trading indicated that investors assign a 74.5 percent probability to the committee increasing its target range by at least 50 basis points by the end of the year, up from 64.6 percent yesterday and from 44.7 percent one week ago.