It’s not surprising that employment in health care has been increasing. The National Health Expenditure (NHE) Projections Model of the Centers for Medicare & Medicaid Services estimates that the long-run income elasticity of demand for private personal health care spending is 1.58. So, a 10 percent increase in U.S. disposable personal income will result in the long run in a 15.8 percent increase in private personal health care spending. In other words, we would expect personal health care spending to become an increasing fraction of total household spending. In addition, the median age of the U.S. population has increased from 32.9 years in 1990 to a projected 40.1 years in 2025. As people age, their demand for health care increases. Finally, holding income and age constant, demand for health care has also increased as a result of the increasing effectiveness of medical care in treating disease.
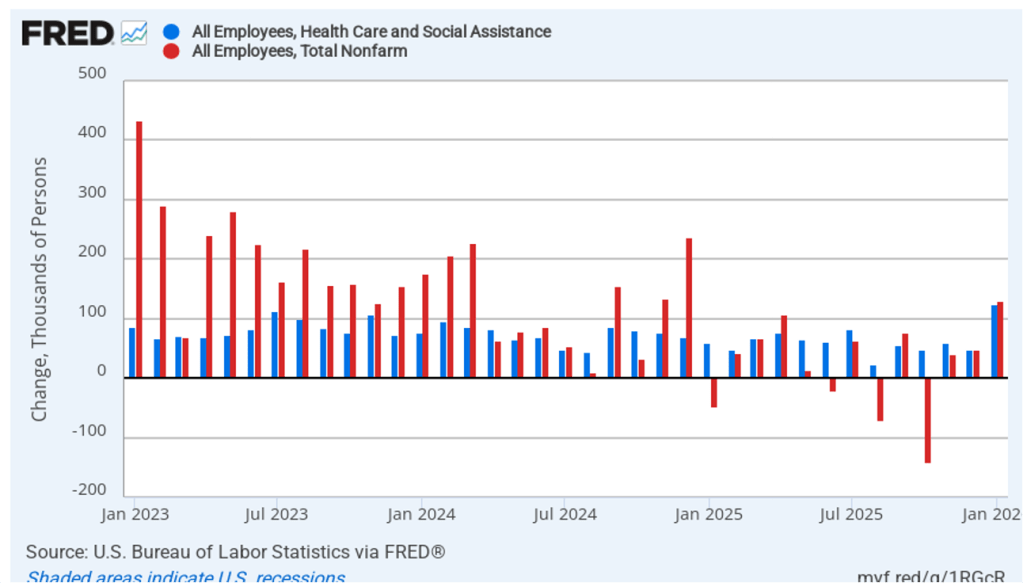
Despite these long-run trends, it’s surprising how dependent increases in U.S. employment have become recently on the growth in health care jobs. The following figure shows monthly changes in a broad measure of health care employment (the blue bars) and in total nonfarm employment (the red bars), using data from the establishment survey from the Bureau of Labor Statistics (BLS). (This blog post yesterday discussed the latest “Employment Situation” report from the BLS.)
The values for January 2023 through December 2024 show what we might expect—the increase in total employment being significantly larger than the increase in health care employment. During this period, health care employment was about 48.5 percent of total employment. In other words, although health care employment was a key driver of increases in employment, non-health care employment was also steadily increasing. The situation since January 2025 is much different with health care employment increasing by 817,000, while total employment increased by only 311,000. In other words, since January 2025, employment outside of health care (again, broadly defined) has fallen by more than 500,000 jobs.
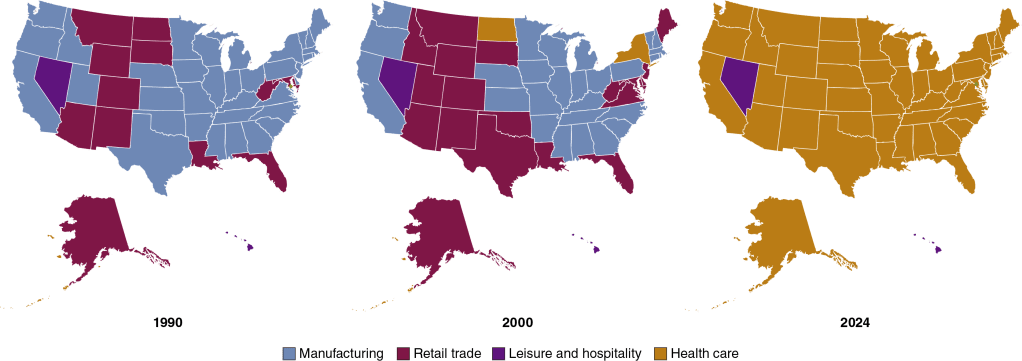
We can look at longer term trends in health care employment relative to employment in other industries. The following maps show the change over time in the industry with the most employment in each state, using data from the BLS’s “Quarterly Census of Employment and Wages.” The industries are grouped into four broad categories: manufacturing, retail trade, leisure and hospitality, and health care. (Industries are defined as follows using the North American Industry Classification System (NAICS): Manufacturing is NAICS 31–33, Retail trade is NAICS 44–45, Leisure and hospitality is NAICS 72, and health care is NAICS 62.)
In 1990, manufacturing was the largest source of private employment in most states, and in no state was health care the largest employer. By 2000, manufacturing was still the largest employer in 27 states, but health care had become the largest employer in 2 states. The results for 2024 are strikingly different: Manufacturing was no longer the largest employer in any state, and health care was the largest employer in 48 states—every state except for Hawaii and Nevada.
In 1990, almost twice as many people in the United States worked in manufacturing as worked in health care. In 2024, employment in health care was 80 percent greater than employment in manufacturing. And these trends are likely to continue. The BLS forecast in 2025 that 12 of the 20 fastest-growing occupations over the next 10 years will be in health care.
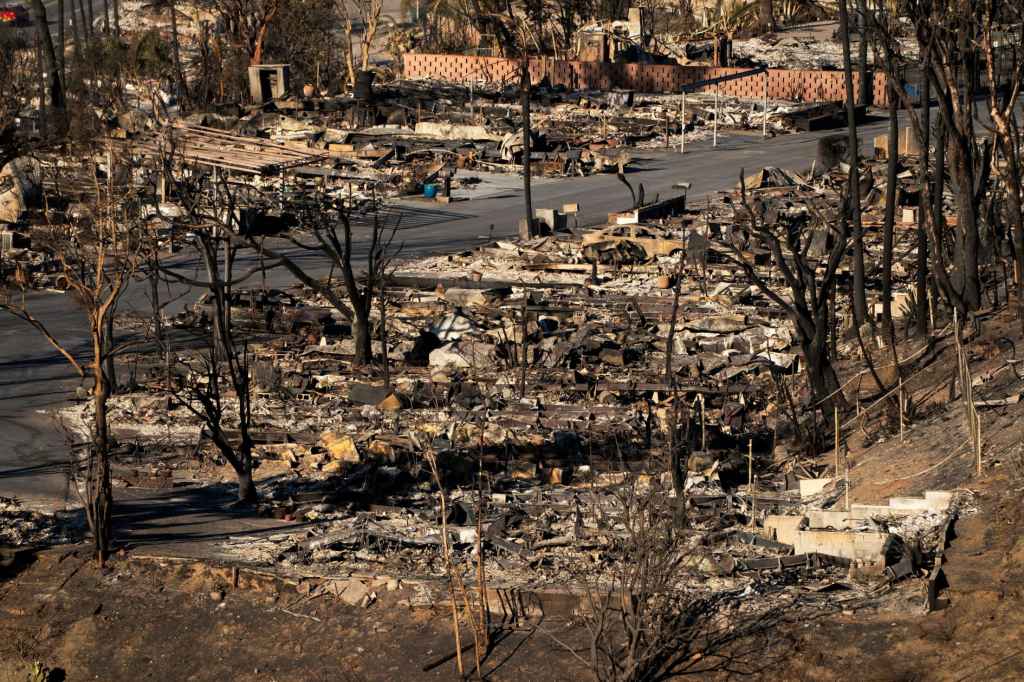
Fire damage in the Pacific Palisades. (Photo from Reuters via the Wall Street Journal)
As of January 15, the series of devastating wildfires in Southern California have killed at least 25 people and destroyed billions of dollars’ worth of homes and businesses. Adding to the tragedy is the fact that many homeowners aren’t fully insured against the damage. As a result, they lack the necessary funds to rebuild their homes. Unfortunately for these people, the market for fire insurance in California hasn’t been working well.
In the United States, regulation of property and casualty insurance occurs at the state level with regulations differing substantially across states. In California, insurance companies face an unusually long regulatory process to receive permission to increase the premiums they charge. The delays in raising premiums have contributed to companies not renewing property insurance policies in some areas, such as those prone to wildfires. In these areas, the payouts the companies expect to make have been higher than the premiums that California regulators have allowed companies to charge policyholders.
The wildfires have ravaged the Pacific Palisades neighborhood of Los Angeles . Although housing prices in the neighborhood are among the highest in the country, an analysis by the Reuters news agency showed that: “Measured against home values, insurance costs are cheaper in the Palisades than in 97% of U.S. postal codes …” For example, the median insurance premium in the Pacific Palisades was “less than residents paid in Glencoe, Illinois, an upscale suburb of Chicago where homes are two-thirds cheaper and the risk of wildfire is minimal.”
Catastrophe modeling is a way of statistically forecasting the probability of events—such as floods or wildfires—occurring that would sharply increase claims by policyholders. Regulations had barred insurance companies from using catastrophe modeling to justify increases in premiums. (State regulators lifted the prohibition on the use of catastrophe modeling shortly before the fires.) These restrictions made it more difficult for companies to charge risk-based premiums, which are based on the probability that a policyholder will file a claim.
Insurance markets can experience adverse selection problems because the people most eager to buy insurance are those with highest probability of requiring an insurance payout. Insurance companies attempt to reduce adverse selection problems by, among other things, charging risk-based premiums. Limiting the ability of insurance companies to charge risk-based premiums increased the adverse selection problems the companies face. To cope with the problem of companies not renewing policies, regulators began requiring companies to renew policies in some Zip codes, particularly those that were in or near areas that had experienced wildfires. This policy further increased adverse selection.
By 2023, some insurers, including State Farm and Allstate—which are two of the largest property insurers in the United States—had decided that they were unlikely to be able cover their costs from offering property insurance policies in California and stopped writing policies in the state. Policyholders who are unable to obtain a policy from a private insurance company typically buy a policy offered through the Fair Access to Insurance Requirements (FAIR) Plan. The FAIR Plan is sponsored by the state government, although operated by private insurance companies. The premiums charged for a FAIR Plan policy are significantly higher than the premiums charged for a traditional policy. Despite the higher premiums, the number of FAIR Plan policies doubled between 2020 and 2025, reaching nearly 500,000.
The FAIR Plan lacks sufficient funds to pay the claims from policyholders who had lost their homes or businesses in the Southern California wildfires. To cover the deficit, the FAIR Plan will assess private insurance companies, who, in turn, will raise premiums charged to their other policyholders. In this way, some of the costs from the wildfires will be borne by all property insurance policyholders in California, even if they live far from the areas affected by the wildfires.
We discuss moral hazard in insurance markets in Microeconomics and Economics, Chapter 7 (and in Money, Banking, and the Financial System, Chapter 11). In general, moral hazard refers to actions people take after they have entered into a transaction that make the other party to the transaction worse off. Moral hazard in insurance markets occurs when people change their behavior after becoming insured. The way that the insurance market is regulated in California and, in particular, the way that the FAIR Plan is administered increases moral hazard because people who own homes or businesses in areas with a greater risk of damage from wildfires don’t pay premiums that fully reflect that greater risk. In other words, more people live in fire prone areas in California than would do so if the premiums on their insurance policies fully reflected the probability of their making a claim.
Whether, following the wildfires, the California legislature will change the regulations governing the insurance market is unclear at this point. As an insurance agent quoted by the Wall Street Journal put it: “We are in uncharted territory.”
Glenn serves on the the Grand Bargain Committee, chaired by Michael Strain of the American Enterprise Institute and Isabel Sawhill of the Brookings Institution. The committee, whose members span the political spectrum, have prepared a report that addresses some of the country’s most pressing economic and social problems.
Glenn and Michael Strain prepared the following introduction to the report. Below there is a link to the whole report.
The views expressed in this report are those of the individual authors who collectively constitute the Grand Bargain Committee, co-chaired by Michael R. Strain and Isabel V. Sawhill. This report was sponsored by the Center for Collaborative Democracy and was prepared independent of influence from the center and from any other outside party or institution. It is being published by the Bipartisan Policy Center as an example of how people with diverse views and political leanings can find common ground. The recommendations are strictly those of the policy experts and do not necessarily reflect the views of any organization or those of the BPC. All data are current as of November 2023.
By: Eric Hanushek, G. William Hoagland, Douglas Holtz-Eakin, R. Glenn Hubbard, Maya MacGuineas, Richard V. Reeves, Robert D. Resichauer, Gerard Robinson, Isabel V. Sawhill, Diane Schanzenbach, Richard Schmalensee, Michael R. Strain, and C. Eugene Steuerle.
Introduction
The United States faces serious economic and social challenges, including:
The underlying economic growth rate has slowed, as have opportunities for people to move up the economic ladder.
Our education system fails too many children and leaves many more with fewer opportunities than they deserve.
The nation is not rising to the challenge of addressing climate change.
Both our health care system and the health of our population need improvement.
Our income tax system is broken, generating tax revenue in an inefficient and unfair manner.
And the national debt is growing at an unsustainable pace, threatening long-term economic growth, crowding out needed investments in economic opportunity, and placing the nation’s ability to respond to a future crisis at risk.
To address these problems, the Center for Collaborative Democracy commissioned subject matter experts—progressives, centrists, and conservatives—to develop a “Grand Bargain” encompassing all six issues. The policy debate typically puts these problems into silos, and within each silo, powerful forces support the status quo. This report seeks to break down these silos. Dealing with them all at once—in a Grand Bargain—is a more promising strategy than dealing with them individually, because it allows for different parties to strike deals across policy issues, not just within a single issue.
For example, implementing a carbon tax to address climate change seems impossibly difficult. So does increasing accountability for teacher performance. Trading one for the other might be easier than pursuing both in isolation. Fixing the structural budget deficit by reducing entitlement spending is an enormous political challenge. So is increasing spending on programs that advance economic opportunity. Doing both at the same time could be more politically feasible than addressing them separately.
In this context, the group of experts met for several months in 2023 to share perspectives and ideas and to come up with sensible policies in each of these areas: economic growth and mobility; education; environment; health; taxes; and the federal budget. The end result is this report, which is being published by the Bipartisan Policy Center as an example of how people with diverse views and political leanings can find common ground.
This report is short, consisting of less than 30 pages of text. Its brevity is by design. This constraint forced the group to stay focused on issues and recommendations that matter the most. The focus of the report is on concepts. It is designed to answer such questions as, “How should the nation’s approach to education or to the federal budget change? What fundamental reforms are required to increase the underlying rates of economic growth and upward mobility?” Focusing on concepts means not focusing on policy details, including the details of implementing our recommendations and of transitioning across policy regimes. Our lack of attention to policy details does not mean we do not recognize their importance. Of course, we do, and many members of the group have spent much of their careers studying and designing public policies. Instead, we focus on concepts because we believe the United States needs to return to a discussion of first principles. This report advances that objective.
Not every member of the group agrees with every recommendation in this report. That is not surprising given the diversity of views in the group, and the difficulty and complexity of many of the issues we address. Despite this disagreement, we were able to have an informed and constructive discussion about these economic issues, to find compromises, and to come up with a set of recommendations that we believe, on balance, would greatly strengthen the country and improve people’s lives.
We believe in the importance of a market economy. Free markets have led to unprecedented growth and innovation, along with rising incomes, over the past three centuries. But government also has a role to play. To unleash more growth, we need to curtail unneeded or overly costly regulations and to create a tax system that encourages investment spending and innovation. To bring prosperity to more people, we need policies that will enable more people to benefit from economic growth through investment in their education and skills. For this reason, we put a great deal of emphasis on improving education for children, on training or retraining for adult workers, and on subsidizing the earnings of low-wage workers when necessary while maintaining a safety net for those who cannot work.
Our proposals are designed to advance certain underlying values and themes: Work and savings should be rewarded, investment should be encouraged over consumption, public assistance should be better targeted to those most in need, the tax system should be more progressive, and the nation should invest relatively more in the young and spend relatively less on the elderly.
Our specific proposals in each area are as follows:
On economic growth and mobility, we recommend investing in the education and training of workers, through community colleges and apprenticeships. We call for a more skill-based immigration system and for more immigrants; for encouraging innovation by investing more in basic research; for reducing taxes on new investment; for curbing unneeded regulation; for reducing the national debt; and for encouraging participation in economic life by increasing the generosity of earnings subsidies for low-wage workers.
On education, we recommend improving the teacher workforce at the K-12 level; paying teachers more but strengthening the link between pay and performance; maintaining educational standards and accountability while narrowing gaps by race and class; expanding school choice; and recognizing the role that parents and families must play in students’ learning.
On the environment, our main recommendation is to adopt a carbon tax. We also call for reducing methane emissions; expanding federal authority in the planning, siting, and permitting of the national electric transmission system; and repealing the renewable fuel standard that requires refiners to blend corn ethanol into the fuel they sell.
On health, we call for giving more attention to the social determinants of poor health with a focus on the need for better nutrition, for rationalizing existing subsidies for health care, and for reducing health care costs.
On taxes, we call for increasing tax revenue as a share of annual gross domestic product (GDP), and for that revenue to be raised in a manner that is more progressive, efficient, and simple than under current law, while also increasing the incentive to save and invest. For the business sector, that means allowing the expensing of investment expenditures and moving toward equal treatment of the corporate and noncorporate sectors.
On the federal budget, we recommend putting the debt as a share of annual GDP on a sustainable trajectory with a comprehensive package of reforms made up of a rough balance between tax increases and spending cuts in the initial years, phasing into a much larger share of the savings coming from spending cuts over time.
Most of these recommendations are at the federal level, but some are at the state and local level, particularly our education recommendations.
In the spirit of a Grand Bargain, these recommendations advance common goals and values through compromises both within and across policy areas. For example, one of our values is reflected in the goal of refocusing government spending on those who truly need it, and another is to restore fiscal responsibility. To accomplish this, we call for slower growth in Social Security and Medicare benefits for affluent seniors to reduce the major driver of the national debt, but we also protect vulnerable seniors and spend more on the education of children and on earnings subsidies for the working poor. We recommend adopting a carbon tax because it will simultaneously advance our goals of supporting the environment, increasing tax revenue, and boosting dynamism by encouraging innovation in the energy sector.
We believe the analysis and recommendations in this report point a path forward for the nation, but we offer them in a spirit of humility, understanding that others will disagree. We hope that this report catalyzes a much needed debate about the future of our nation.
Supports:Macroeconomics, Chapter 5, Section 5.3 or Chapter 6, Section 6.1; Microeconomics and Economics, Chapter 7, Section 7.3 or Chapter 8, Section 8.1.
Image from Reuters via the Wall Street Journal.
A recent paper by Iyah Rahwan, of the Max Planck Institute for Human Development in Berlin Germany, and colleagues raises the possibility that dating apps, like Tinder, OkCupid, and Bumble, may have a principal-agent problem. Dating apps—like nearly all other subscription apps—generate more income if subscribers pay for the app over a longer period of time. Many people use dating apps in the hope of connecting with another app user with whom they can have a long-term relationship.
a. What is the principal-agent problem?
b. Explain whether dating apps may have a principal-agent problem. If they do, who is the principal and who is the agent?
c. How does your answer to part b. affect your estimate of how likely people using dating apps are to find a long-term relationship using these apps?
Solving the Problem
Step 1:Review the chapter material. This problem is about the principal-agent problem, so you may want to review either of the two sections in which the principal-agent problem is discussed: Macroeconomics, Chapter 5, Section 5.3, “Information Problems and Externalities in the Market for Health Care” or Chapter 6, Section 6.1, “Types of Firms” (Microeconomics and Economics, Chapter 7, Section 7.3 or Chapter 8, Section 8.1.)
Step 2:Answer part a. by defining “principal-agent” problem. Principal-agent is defined in the textbook this way: A problem caused by an agent pursuing the agent’s own interests rather than the interests of the principal who hired the agent.
Step 3: Answer part b. by explaining why dating apps may have a principal-agent problem and by identifying who is the principal and who is the agent in this situation. With dating apps, the principal is the app user who, typically, uses the app to help find a partner for a long-term relationship. The owners of the dating app are the agent because they have been hired by the app user to help the user achieve the goal of starting a long-term relationship. Unfortunately, the owners of the dating app have a different goal than does the app user. The goal of the owners is to have users keep subscribing to the app. Anyone who finds a long-term relationship using the app is likely (we hope!) to drop his or her subscription to the app. Therefore, whereas the app user would like to quickly find a partner for a long-term relationship, the owners of the app want the app user to take a long time to find such a partner.
Step 4: Answer part c. by discussing how the principal-agent problem may affect the likelihood of someone using a dating app successfully finding someone for a long-term relationship. The answer to part b. indicates that dating apps may have an incentive to make it somewhat more difficult to find a long-term relationship using the app—perhaps by employing a matching algorithm that doesn’t result in users easily finding good matches. Therefore, it’s likely that the principal-agent problem make it less likely that people using dating apps will successfully find a partner for a long-term relationship.
Source: Iyah Rahwan, et al., “Price of Anarchy in Algorithmic Matching of Romantic Partners,” ACM Transactions on Economics and Computation, Vol. 12, No. 1, pp. 1-25.
Few diseases affect all demographic groups equally. For example, the 1918–1919 influenza pandemic killed an unusually large number of young adults. Estimates are that half of deaths in the United States during that pandemic occurred among people aged 20 to 40. In recent flu seasons, the elderly have much higher mortality rates than do other age groups. For instance, during the 2018–2019 flu season, people 65 and older died at a rate more than 10 times greater than people 18 to 49 years old. The very young also have comparatively high mortality rates from the flu. In 2018–2019, children 0 to 4 years-old died at a rate six times higher than children 5 to 17 years-old.
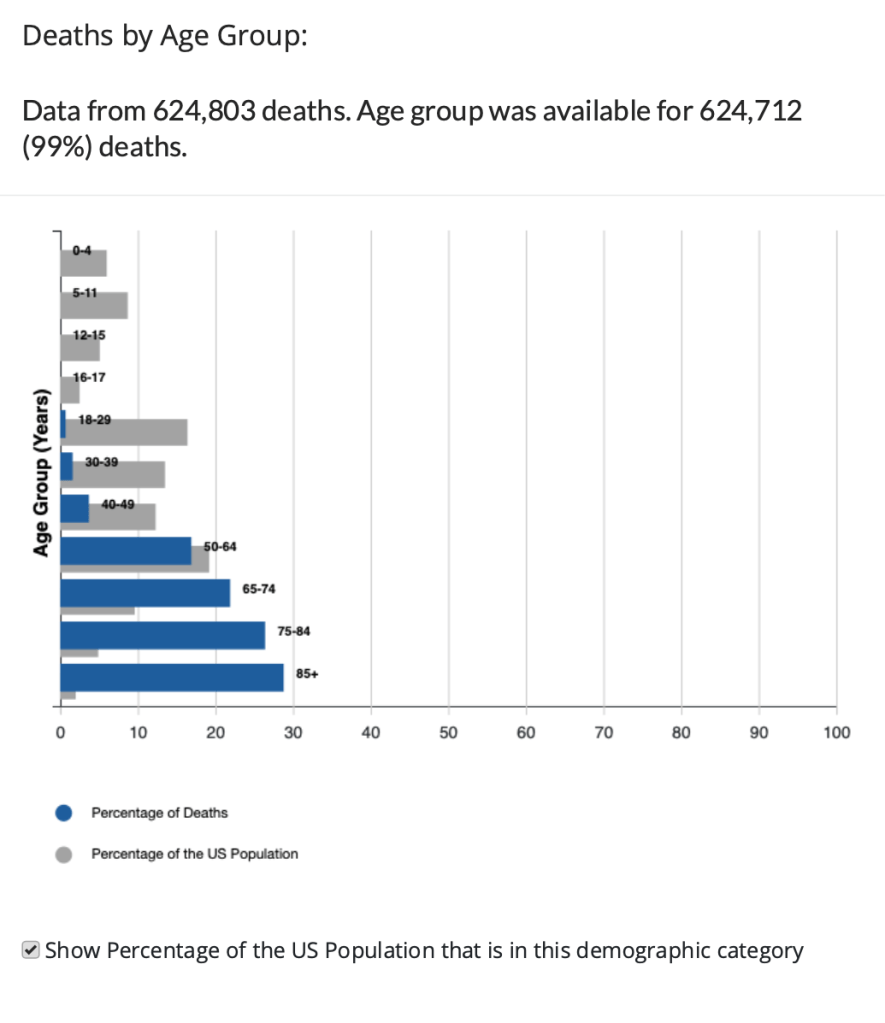
When the Covid-19 virus began to spread widely in the United States in the spring of 2020, some epidemiologists expected that it would affect different demographic groups in about the same way that the flu does. In fact, though, while people 65 and older were particularly at risk, young children were less affected by Covid-19 than they are by the flu. The following chart prepared by the Centers for Disease Control and Prevention (CDC) displays for the United States data on Covid deaths by age group as of early November 2021.
The blue bars show the percentage of total deaths from Covid since the beginning of the pandemic represented by that age group and the gray bars show the percentage that group makes up of the total U.S. population. Therefore, an age group that has a gray bar longer than its blue bar was proportionally less affected by the virus and an age group that has a blue bar longer its gray bar was proportionally more affected by the virus. The chart shows that people over age 65 experienced particularly high mortality rates. Strikingly, people over age 85 accounted for nearly 30 percent of all deaths in the United States, while making up only 2 percent of the U.S. population.
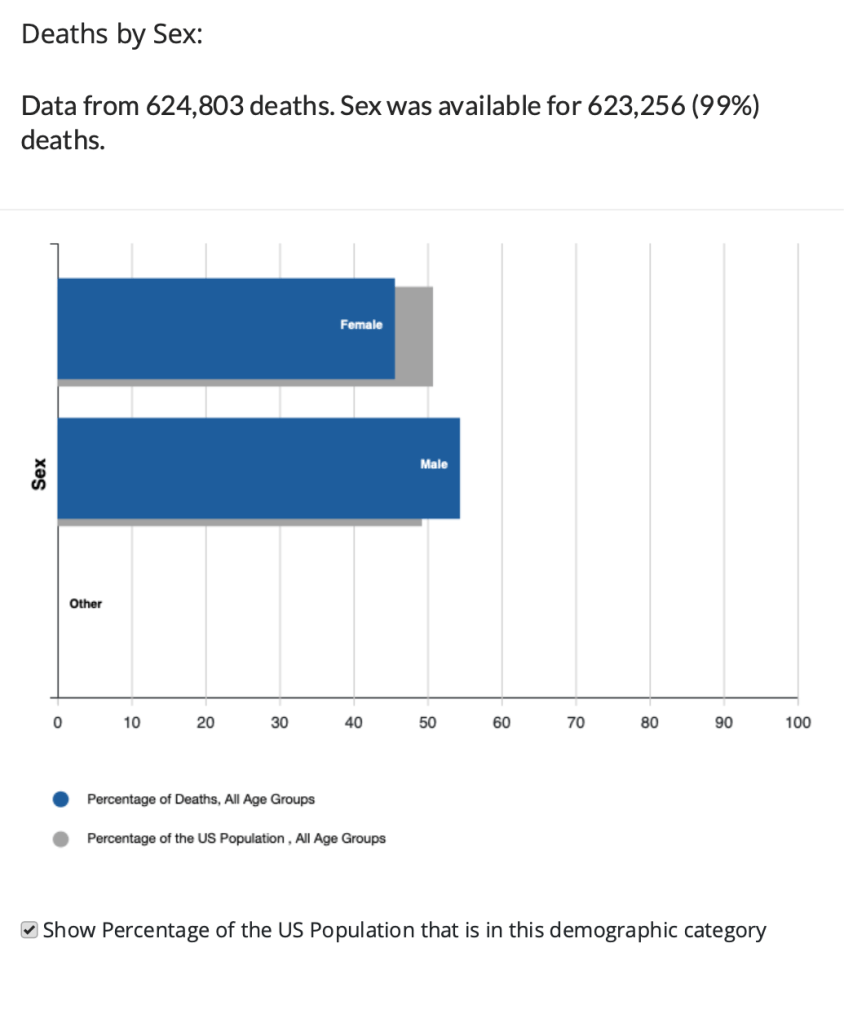
The following chart displays data on Covid deaths by gender. Men account for about 49 percent of the U.S. population but have accounted for about 54 percent of Covid deaths.
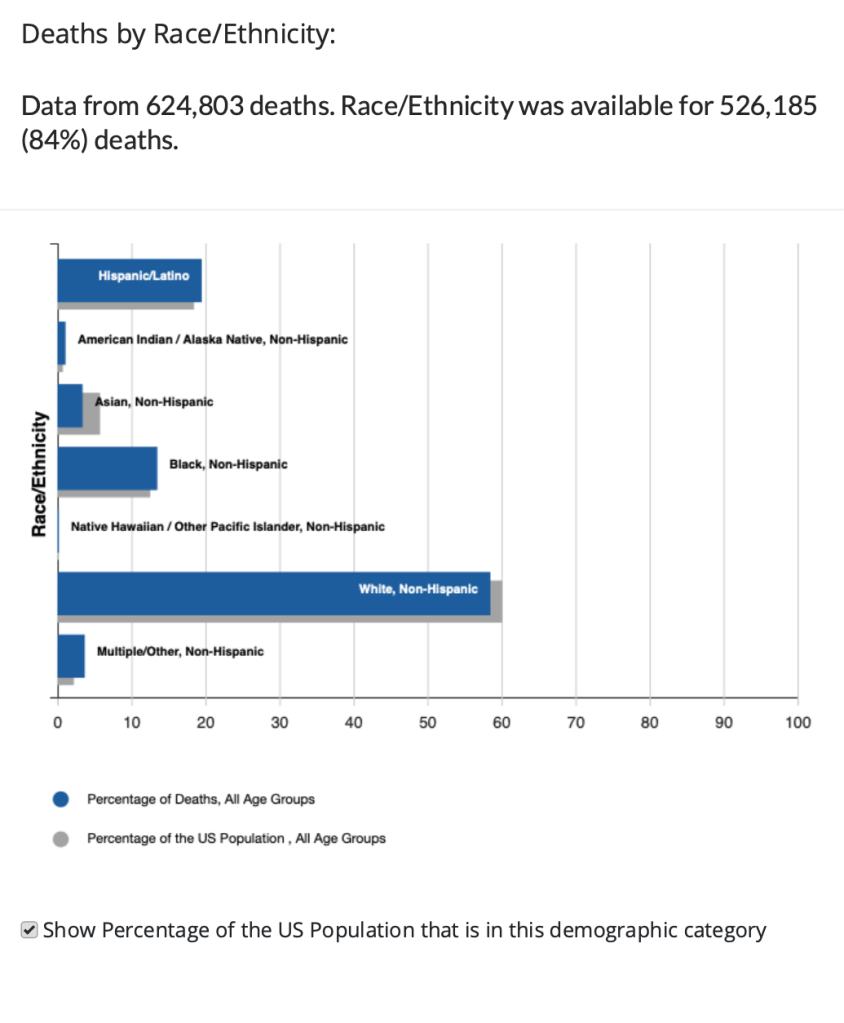
Finally, the following chart displays data on Covid deaths by race or ethnicity. Hispanic, Black, and American Indian or Alaskan Native people have experienced proportionally higher Covid mortality rates than have Asian or white people.
What explains the disparity in mortality rates across demographic groups? With respect to age, we would expect older people to have weaker immune systems and therefore be more likely to die from any illness. In addition, early in the pandemic many older people in nursing homes died of Covid before it was widely understood that the disease spread through aerosols and that keeping people close together inside unmasked made it easy for the virus to spread. The very young have immature immune systems, which might have made them particularly susceptible to Covid, but for reasons not well understood, they turned not to be.
There continues to be debate over why men have experienced a higher mortality rate from Covid than have women. Vaccination rates among men are somewhat lower than among women, which may account for part of the difference. In an opinion column in the New York Times, Dr. Ezekiel Emanuel of the University of Pennsylvania noted that researchers at Yale University have observed “that there are well-established differences in immune responses to infections between men and women.” But why this pattern should be reflected in Covid deaths is unclear at this point.
Medical researchers and epidemiologists have also not arrived at a consensus in explaining differences in mortality rates across racial or ethnic groups. Groups with higher mortality rates have had lower vaccination, which explains some of the difference. Groups with higher mortality rates are also more likely to suffer from other conditions, such as hypertension, that have been identified as contributing factors in some Covid deaths. These groups are also less likely to have access to health care than are the groups with lower mortality rates. The CDC notes that: “Race and ethnicity are risk markers for other underlying conditions that affect health, including socioeconomic status, access to health care, and exposure to the virus related to occupation, e.g., frontline, essential, and critical infrastructure workers.”
Sources: Ezekiel J. Emanuel, “An Unsolved Mystery: Why Do More Men Die of Covid-19?” nytimes.com, November 2, 2021; Daniela Hernandez, “Covid-19 Vaccinations Proceed Slowly Among Older Latino, Black People,” wsj.com, March 2, 2021; Anushree Dave, “Half-Million Excess U.S. Deaths in 2020 Hit Minorities Worse,” bloomberg.com, October 4, 2021; Centers for Disease Control and Prevention, “Hospitalization and Death by Race/Ethnicity,” cdc.gov, September 9, 2021; Centers for Disease Control and Prevention, “Demographic Trends of COVID-19 cases and deaths in the US reported to CDC,” cdc.gov, November 5, 2021 Centers for Disease Control and Prevention, “2018–2019 Flu Season Burden Estimates,” cdc.gov; and Jeffery K. Taubenberger and David M. Morens, “1918 Influenza: the Mother of All Pandemics,” Emerging Infectious Diseases, Vol. 12, No. 1, January 2006, pp. 15-22.
Authors Glenn Hubbard and Tony O’Brien discuss the economic impacts of what was discussed in the final Presidental debate on 10/22/20. They discuss wide-ranging topics that were raised in the debate from reopening the economy & schools, decreasing participation of women in the workforce due to COVID, healthcare, environment, and general tax policy. Listen to gain economic context on these important items. Click HERE for the New York Times article discussed during the Podcast:
Just search Hubbard O’Brien Economics on Apple iTunes and subscribe!
Economics – Chapter 7, The Economics of Health Care; Chapter 18, GDP: Measuring Total Production and Income; Micro – Chapter 7, The Economics of Health Care; Macro Chapter 5, The Economics of Health Care; Chapter 8, GDP: Measuring Total Production and Income; Essentials – Chapter 5, The Economics of Health Care; Chapter 12, GDP: Measuring Total Production and Income
Lessons from the Influenza Pandemic of 1918-1919 for the Coronavirus Pandemic of 2020
The coronavirus pandemic of 2020 was by far the most serious epidemic to affect the United States since the influenza pandemic of 1918-1919, sometimes called the Spanish Flu. Does the 1918-1919 influenza pandemic provide clues that help us predict how the coronavirus pandemic might affect the U.S. economy? In this discussion, we:
Summarize scholarly and popular articles that address this question.
Provide links to the full articles.
Draw some tentative conclusions.
SCHOLARLY ARTICLES
What Effect Did the 1918-1919 Influenza Pandemic Have on Death Rates and Real GDP?
A National Bureau of Economic Research (NBER) Working Paper by Robert Barro of Harvard University, José Ursúa of Dodge & Cox, a mutual fund firm, and Joanna Weng of EverLife, an online food firm, estimate that the 1918-1919 pandemic killed about 39 million or about 2.0 percent of the world’s population. An equivalent percentage of the world’s population today would be 150 million people. The pandemic killed about 550,000 people in the United States or about 0.5 percent of the population. If the death rate in the United States from the coronavirus were also 0.5 percent, the result would be 1.65 million deaths.
Barro, Ursúa, and Weng also estimate that the influenza pandemic reduced real GDP per capita in the typical country by 6 percent and real private consumption per capita by 8 percent. The comparable estimates for the United States are a decline in real GDP per capita of 1.5 percent and of real private consumption per capita by 2.0 percent. They conclude that, “At this point, the probability that COVID-19 reaches anything close to the Great Influenza Pandemic seems remote, given advances in public-health care and measures that are being taken to mitigate propagation.” The following table summarizes the Barro, Ursúa, and Weng estimates.
The What Effect Did Air Pollution Have on theWhat Effect Did Social Distancing Have on the 1918-1919 Influenza Pandemic?
A working paper by Sergio Correia, of the Federal Reserve Board, Stephan Luck of the Federal Reserve Bank of New York, and Emil Verner of the MIT School of Management examines the benefits and costs of non-pharmaceutical interventions (NPIs)—such as social distancing policies—during the 1918 pandemic. They find that cities that implemented NPIs early and maintained them for longer experienced both lower mortality and higher economic growth, as measured by increases in manufacturing employment between 1914 and 1919. The cities of Seattle, Portland, Oakland, Los Angeles, and Omaha particularly stand out in this respect. Cities such as Pittsburgh, Philadelphia, and Boston that were slow to implement NPIs, or kept them in place for shorter periods, experienced both higher mortality rates and slower economic growth. The authors note: “This suggests that NPIs play a role in attenuating mortality, but without reducing economic activity. If anything, cities with longer NPIs grow faster in the medium term.”
Correia, Luck, and Verner find substantial positive economic effect from early and prolonged implementation of NPIs: “Reacting 10 days earlier to the arrival of the pandemic in a given city increases manufacturing employment by around 5% in the post period. Likewise, implementing NPIs for an additional 50 days increases manufacturing employment by 6.5% after the pandemic.” They suggest that early implementation of NPIs may “flatten the curve,” keeping hospitals from being overwhelmed, and reducing mortality. They note that aggressive early use of NPIs appear to have successfully reduced both mortality rates and economic losses in Taiwan and Singapore.
What Effect Did Air Pollution Have on the 1918-1919 Influenza Pandemic?
Karen Clay and Edson Severnini of Carnegie Mellon University and Joshua Lewis of the Université de Montréal find that U.S. cities with worse air pollution—largely as the result of local utilities using more coal to generate electric power—suffered significantly higher death rates: “Cities that used more coal experienced tens of thousands of excess deaths in 1918 relative to cities that used less coal with similar pre-pandemic socioeconomic conditions and baseline health.”
Sources: Robert J. Barro, José F. Ursúa, and Joanna Weng, “The Coronavirus and the Great Influenza Pandemic: Lessons from the “Spanish Flu” for the Coronavirus’s Potential Effects on Mortality and Economic Activity,” National Bureau of Economic Research, March 2020—The paper can be found here (the NBER is providing free access to working papers related to the coronavirus epidemic): https://www.nber.org/papers/w26866.pdf; Sergio Correia, Stephan Luck, and Emil Verner, “Pandemics Depress the Economy, Public Health Interventions Do Not: Evidence from the 1918 Flu,” March 26, 2020—the paper can be found here: ; and Karen Clay, Joshua Lewis, and Edson Severnini, “Pollution, Infectious Disease, and Mortality: Evidence from the 1918 Spanish Influenza Pandemic,” Journal of Economic History, Vol. 78, No. 4, December 2018, pp. 1179-1209—The NBER working paper version can be found here.
Did People Who Were in Utero during the 1918-1919 Influenza Pandemic Suffer Negative Health Effects?
In an influential academic article published in 2008, Douglas Almond of Columbia University argued that people who were in utero during the influenza pandemic “displayed reduced educational attainment, increased rates of physical disability, lower income, lower socioeconomic status, and higher transfer payments compared with other birth cohorts.” However, research by Ryan Brown of the University of Colorado, Denver and Duncan Thomas of Duke University provides evidence that the women who became pregnant during the pandemic were likely to be from lower socio-economic status than were women who became pregnant during earlier or later years. This result is attributable to the pandemic occurring during 1918 when many men of higher-than-average socio-economic status had been drafted to fight in World War I. After correcting for the socio-economic status of the parents of people who were in utero during the pandemic, Brown and Thomas find that “there is little evidence that individuals born in 1919 have worse socio-economic outcomes in adulthood relative to surrounding birth cohorts.”
Brian Beach of the College of William and Mary, Joseph P. Ferrie of Northwestern University, and Martin H. Saavedra of Oberlin College study this issue using individual data from the population censuses of 1920 and 1930 linked to World War II enlistment records. Their sample is large enough to contain many brothers, which allows them to completely control for the effects of socio-economic factors. They conclude that in utero exposure reduced high school graduation rates by about 2 percentage points but had no effect on adult height, weight, or body mass index (BMI).
Sources: Douglas Almond, “Is the 1918 Influenza Pandemic Over? Long- Term Effects of In Utero Influenza Exposure in the Post-1940 U.S. Population,” Journal of Political Economy, Vol. 114, No. 4, August 2006, pp. 672-712; Ryan Brown and Duncan Thomas, “On the Long Term Effects of the 1918 U.S. Influenza Pandemic,” June 2018 (https://clas.ucdenver.edu/ryan-brown/sites/default/files/attached-files/brownthomas_0.pdf); and Brian Beach, Joseph P. Ferrie, and Martin H. Saavedra, “Fetal Shock or Selection? The 1918 Influenza Pandemic and Human Capital Development,” National Bureau of Economic Research, Working Paper 24725, June 2018 (https://www.nber.org/papers/w24725).
POPULAR ARTICLES
An article on msnbc.com notes that compared with the 1918-1919 influenza pandemic, the coronavirus pandemic may turn out to be more contagious but with a lower death rate (although the death rate from the coronavirus appeared higher when the article was first published).
In an opinion column in the New York Times, John Barry, a professor of public health at Tulane University and the author of the best-known history of the 1918-1919 pandemic, notes that an analysis of differences in the policies enacted among U.S. cities during the influenza pandemic indicates that when social distancing happened “before a virus spreads throughout the community, [it] did flatten the curve”—that is, it avoided a spike in deaths that would overwhelm hospitals.
An article on nationalgeographic.com has some interesting graphs showing death rates from the influenza pandemic across many U.S. cities. Some cities experienced two peaks during 1918, while others did not. The article, which summarizes earlier epidemiological research, concludes that “death rates were around 50 percent lower in cities that implemented preventative measures early on, versus those that did so late or not at all.” The cities that kept these measures in place longest were the ones that did not experience a second spike in death rates.
Although the nationalgeographic.com article attributes the relatively low death rate in New York City during the influenza pandemic to the early implementation of quarantine and other public health measures, this op-ed in the New York Timesby historian Mike Wallace indicates that the city did not close its public schools or most of its theaters, although it did levy fines to enforce a prohibition on public spitting—a common habit among men at the time.
This essay in the Wall Street Journal by a medical doctor and adjunct professor at the Duke Global Health Institute reviews the course of the influenza pandemic in the United States and attempts to draw some lessons for the current coronavirus pandemic. The essay discusses the often-mentioned mistake by the Philadelphia city government of allowing a crowd of 200,000 to attend a parade to sell Liberty Loans: “within 72 hours, every bed in the city’s 31 hospitals was filled.” The doctor notes that “cities which implemented isolation policies (such as quarantining houses where influenza was present) and ‘social distancing’ measures (such as closing down schools, theaters and churches) saw death rates 50% lower than those that did not.”
Tentative Conclusions
There are limits to drawing parallels between the 1918-1919 influenza pandemic and the 2020 coronavirus pandemic for at least three key reasons:
Epidemiological profiles The viruses are different and have different epidemiological profiles. The coronavirus appears to be more contagious than the 1918 influenza virus but has a lower death rate. The influenza virus killed more people in the prime age groups, particularly people aged 25 to 34. The influenza virus also had a higher death rate among children. In both pandemics, men were more likely to die from the coronavirus than women.
Medical knowledge, drugs, and equipment The state of medical knowledge is greater today than it was in 1918-1919, which may be helping to reduce the death rate. There are many more intensive care units in hospitals—such units were rare in hospitals in 1918. Antibiotics had not yet been discovered in 1918, so people died of secondary infections, particularly pneumonia, who have been saved in the current pandemic. There are also antiviral drugs available today that were unknown in 1918, although at this writing (early April 2020) it was unclear whether any current antiviral drug will be effective against the coronavirus. No medical equipment similar to current-day respirators were available in 1918, which made it difficult for people suffering from severely reduced lung capacity to survive.
Knowledge of policies during 1918 Knowledge of the course of pandemics is greater now than in 1918, partly because the breadth and scope of the influenza pandemic made it the subject of close study during the decades since. Three lessons in particular have affected the response to the coronavirus pandemic. First, errors committed by local government officials in 1918, notably the mayor of Philadelphia allowing the Liberty Loan parade to take place despite warnings from local health officials, have been widely publicized. As a result these errors have largely been avoided in 2020. For instance, most cities canceled their St. Patrick’s Day parades and U.S. sports leagues shut down promptly in mid-March. Second, we know that those cities that enacted policies of quarantines and social distancing in 1918-1919 had the lowest death rates. This knowledge contributed to government officials and the general public supporting similar policies in 2020. Finally, we know that the 1918-1919 pandemic occurred in three waves—with the second wave during the fall of 1918 being the worst in the United States. In 2020, the public and government officials are aware that the initial coronavirus wave in the late winter-early spring of 2020 would likely be followed by additional waves in the absence of an effective vaccine or the development (or repurposing) of therapeutic drugs.
Despite the differences between the 1918-1919 and 2020 pandemics, we can offer several tentative observations:
1. The decline in real GDP from the coronavirus pandemic is likely to be greater than the decline in real GDP from the influenza pandemic. As noted earlier, Barro, Ursúa, and Weng found a surprisingly small decline in real GDP as a result of the 1918-1919 pandemic. Determining the macroeconomic effects of the pandemic is difficult because it began during the last year of World War I and because it preceded the short, but sharp, recession that lasted from January 1920 to July 1921. Most economic historians don’t believe that the pandemic was a significant cause of the 1920-1921 recession.
This period was also before the U.S. Bureau of Economic Analysis began collecting GDP data. Several economists have estimated changes in GDP during these years, but their estimates differ significantly. Nathan Balke of Southern Methodist University and Robert Gordon of Northwestern University estimate that real GDP declined by 2.9 percent from 1918 to 1919. Christina Romer of the University of California, Berkeley estimates that real GDP increased by 1.1 percent from 1918 to 1919. Robert Barro and José Ursúa estimate that real GDP per capita declined by 3.4 percent from 1918 to 1919 (note that the 1.5 percent decline quoted earlier is their estimate of how much of the total 3.4 percent decline was due to the pandemic).
The decline in U.S. real GDP during the second quarter of 2020 is likely to be substantial—perhaps as high as 20 percent on an annualized basis. Still unknown is whether the U.S. economy will experience a V-shaped recession—a sharp decline in real GDP followed by a sharp rebound—or what has been called a “Nike swoosh-shaped recession”—a sharp decline followed by a slower recovery. If the United States experiences a swoosh-shaped recession, the decline in real GDP is likely to significantly exceed the decline during 1918-1919.
As we discussed earlier, during 2020 the social distancing policies recommended by the federal government and implemented by many states and cities far exceeded anything implemented in 1918. In 1918, even New York City, which historians generally praise for its vigorous public health response, allowed its schools, restaurants, and most theaters to remain open. In comparing 2020 with 1918, we can say that in fighting the coronavirus, the United States was willing in 2020 to accept large declines in production and employment in order to reduce projected death rates. In 1918, perhaps inadvertently, the United States experienced a higher death rate in part because economic life was not disrupted to the extent that it was in 2020.
2. The long-range health effects of the coronavirus pandemic are not known. As we noted earlier, Douglas Almond’s research has been frequently cited for its finding that people who were in utero in 1918 suffered substantial negative health and socioeconomic effects as adults. As discussed, recent unpublished research has called Almond’s results into question. It remains unclear whether the influenza pandemic had lasting effects either in the way Almond’s study suggests or perhaps because some people who recovered from the flu suffered reduced lung capacity or were more prone to developing pneumonia or other respiratory diseases later in life. Here’s the key point: The coronavirus is not a type of influenza, so the long-run health effects from the influenza epidemic—if there were any—may not be relevant in evaluating coronavirus.
In 2020, there was some discussion in the news media that patients with coronavirus who needed to use ventilators might subsequently suffer from reduced lung capacity. Modern ventilators were not available in 1918, so that episode doesn’t provide evidence for the consequences of their widespread use.
Sources: For 1918-1919 real GDP estimates: Balke and Gordon: Nathan S. Balke and Robert J. Gordon, “The Estimation of Prewar Gross National Product: Methodology and New Evidence,” Journal of Political Economy, Vol. 97, No. 1, February 1989, pp. 38–92; Christina Romer: Christina D. Romer, “The Prewar Business Cycle Reconsidered: New Estimates of Gross National Product, 1869–1908,” Journal of Political Economy, Vol. 97, No. 1, February 1989, pp. 1–37; Barro and Ursúa: Excel file posted under “Data Sets” on Barro’s homepage, https://scholar.harvard.edu/barro/publications/macroeconomic-crises-1870-bpe.