
Image created by ChatGPT
A recent article in the Wall Street Journal discussed the surprising fact that some colleges are sending letters of acceptance to students who haven’t actually applied for admission:
“Hundreds of colleges are sending students letters of admission—without even requiring an application. … Known as ‘direct admissions,’ this expedited process is free and omits required essays, questions about extracurriculars and mandated standardized tests.”
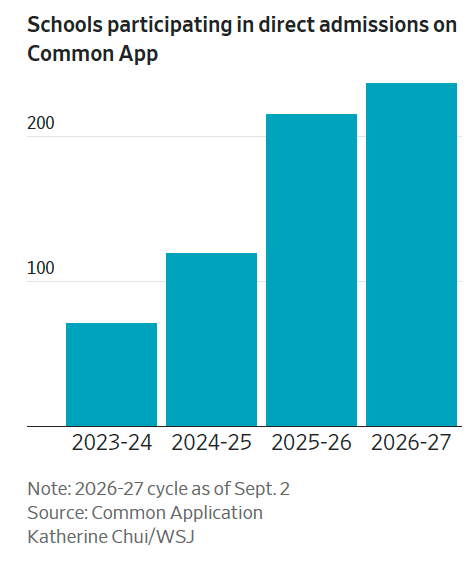
The following figure from the article shows the increase in the number of colleges among the 1,100 colleges that accept the Common Application (or Common App) that use direct admissions.
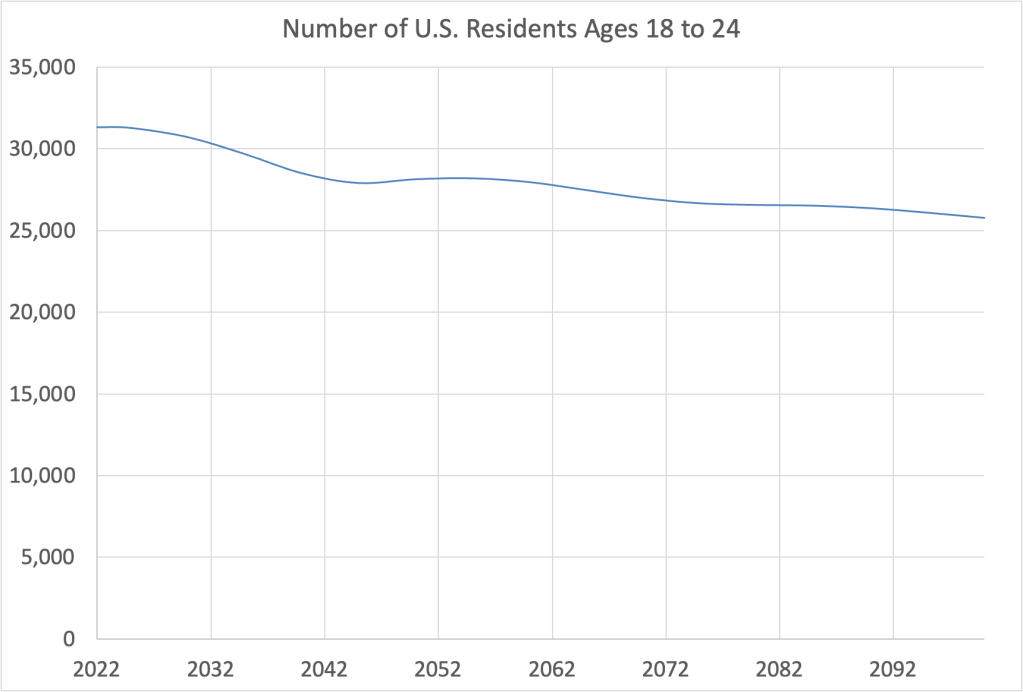
The rise in the use of direct admissions reflects a decline in students’ demand for admission to these schools. Part of the reason for this decline in demand is the falling number of people in the United States who are in the prime college attending ages of 18 to 24. The following figure shows projections from the Census Bureau of the number of U.S. residents in this age group from the present to the year 2100. The numbers on the vertical axis are thousands of persons. From 2022 to 2026, the number of people in this age group declined by about 1 million. The number is projected to have declined by another 2 million in 2040.
Another factor that may be affecting the demand for college admissions is stagnation in the college wage premium, which is the amount by which wages earned by college graduates exceed wages earned by high school graduates. The following figure from a publication of the Federal Reserve Bank of Minneapolis shows values for the college wage premium from 1961 to 2023. The figure uses data from a working paper by economists at the Federal Reserve Bank of San Francisco that adjusts the college wage premium to take into account several factors, including differences in the ages of high school and college graduates.
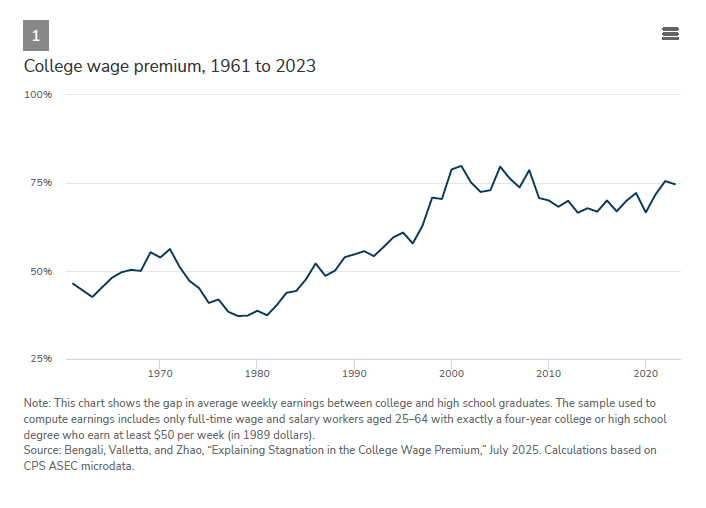
The college wage premium has fluctuated, but from 1980 to 2000 it was generally increasing. Since 2000, however, the premium has stagnated. Several explanations have been offered for this stagnation. Lisa Camner McKay of the Minneapolis Fed notes that the relative supply of workers with college degrees has been increasing: “In 2000, workers with a bachelor’s degree or higher were 31 percent of the civilian labor force. In January 2025, they were 45 percent.”
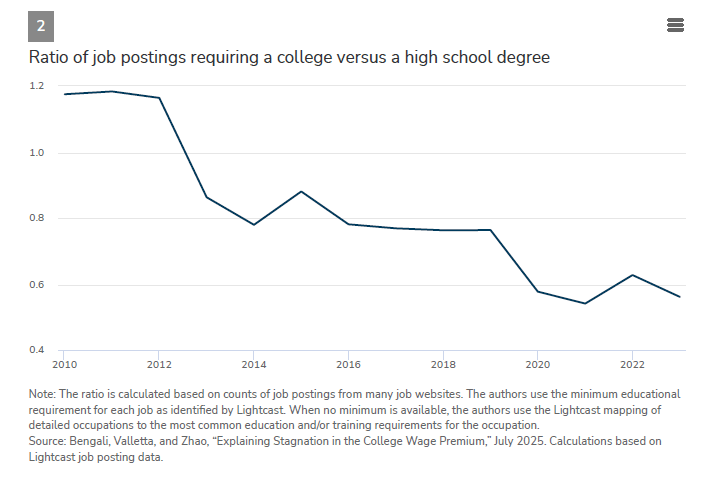
The labor market demand for college graduates may also have declined relative to the demand for high school graduates. The following figure, based on data in the working paper from the San Francisco Fed referred to earlier, shows the ratio of public job postings that require applicants to have a college degree relative to job posting that don’t require a college degree. The ratio has steadily declined since 2010.
We’ve identified two factors that may account for a decline in the demand for a college degree that’s led some colleges to rely on direct admissions to recruit students. Media stories have also noted that some smaller colleges have been forced to close in recent years as they were unable to recruit enough students to cover their costs. These closings have reduced the supply of college degrees. However, only about 46 traditional nonprofit private colleges closed between 2023 and 2025. While these closures have been a hardship for the students, faculty, and administrators involved, they have been a very small fraction of the more than 3,000 public and private colleges in the United States. But some observers have forecast that closures of small private colleges may sharply increase in the coming years. For example, an article in the Wall Street Journal cited a study by Huron Consulting that found that 442 of the 1,700 private nonprofit colleges have experienced shrinking enrollments and are at risk of closing at some point in the next 10 years.
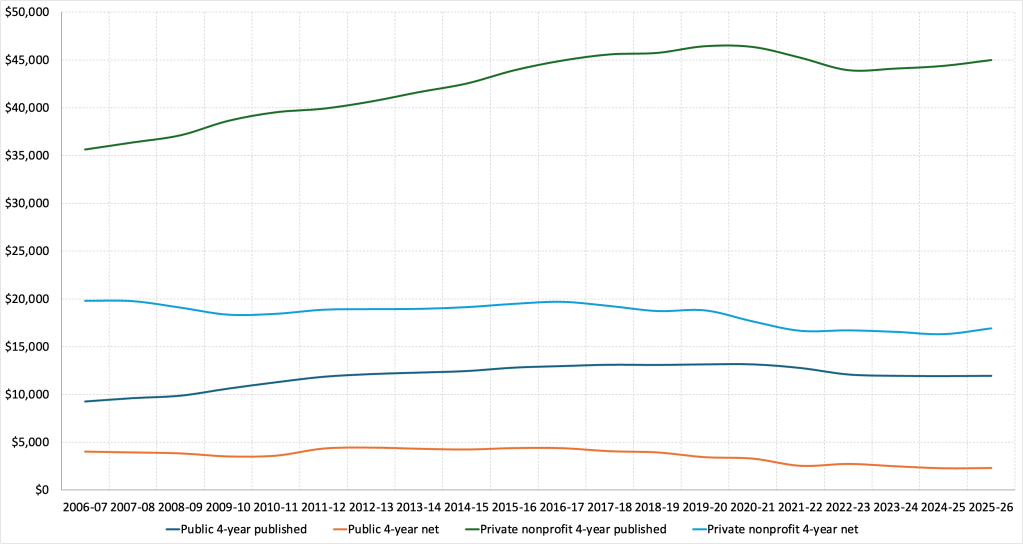
How might declines in the demand for and supply of college degrees affect the tuition that students will pay in the future? First, it’s worth noting that, corrected for the effects of inflation, college tuition has not increased significantly in recent years. The following figure, using data from the College Board, shows that, when measured in 2025 dollars, college tuition at public and private colleges has been roughly flat over the past 10 years, particularly if we look at net tuition charged, which subtract grants the colleges have awarded to students from the colleges’ published tuition amounts.
We can use the model of demand and supply to analyze how tuition might change in the future. In Microeconomics, Chapter 3, Section 3, we show that whether the price in a market rises over time depends on the direction in which demand and supply curves shift and on the relative magnitudes of the shifts. In this case, our discussion indicates that both the demand for college degrees and the supply of college degrees are likely to continue shifting to the left. Whether tuition rises or falls depends on the magnitude of the shifts. If the shift in demand is greater than the shift in supply, tuition will fall. If the shift in supply is greater than the shift in demand, tuition will rise. The following figure illustrates the situation in which the demand for college degrees shifts by more than the supply of college degrees, causing tuition to fall.
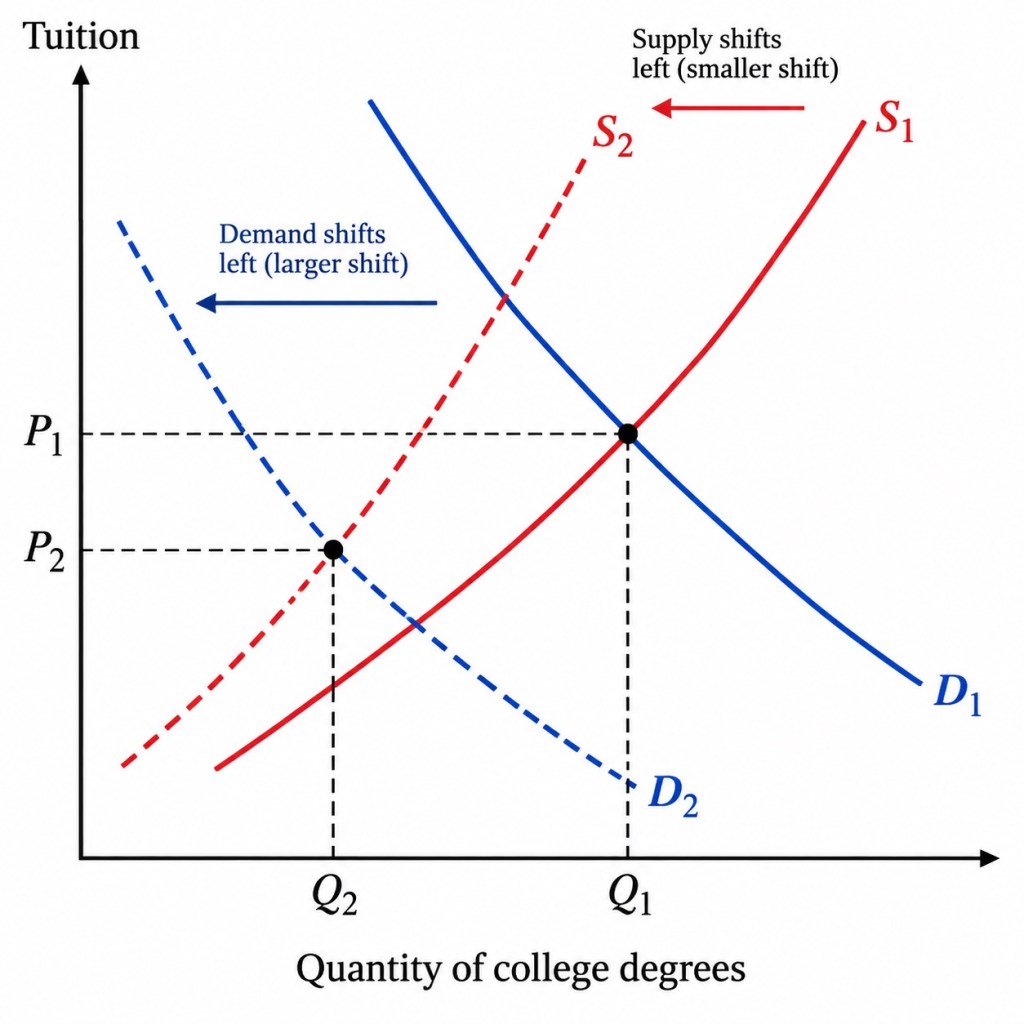
Figure created with ChatGPT
 HubbardOBrienEconomics.com Blog