Solved Problem: Too Much Chicken?

Supports: Microeconomics and Economics, Chapter 14, Section 14.2.

Image created by ChatGPT

An article in the Wall Street Journal discussed why the price of chicken in supermarkets has been falling. The article notes that, “Bigger chicken breeds and flocks not being decimated by disease over the summer have led to a glut in an industry that slaughters more than nine billion birds a year.” The article quotes an industry analyst who is critical of the decisions U.S. poultry famers. According to the analyst, “The industry shot themselves in the foot this year. All you had to do was just be disciplined around production.”

According to the U.S. Department of Agriculture, more than 150,000 farms in the United States sell at least some poultry and eggs, and more than 70,000 farms specialize in selling poultry and eggs.

a. What does the analyst mean by arguing that poultry famers should have been more “disciplined”? What does the analyst expect the result would have been of farmers having been more disciplined?

b. Given the information provided, why might poultry farmers have failed to be more disciplined?

Solving the Problem
Step 1: Review the chapter material. This problem is about the difficulty firms have in implicitly colluding if there are many firms in an industry, so you may want to review Chapter 14, Section 14.2, “Game Theory and Oligopoly.”

Step 2: Answer part a. by explaining what that analyst meant by poultry farmers having failed to have been “disciplined” and what he expected the result of farmers being more disciplined would have been. Given the context that U.S. poultry farmers had produced an unusually large number of chickens, the analyst is suggesting that if farmers had been more disciplined, they would have produced fewer chickens. Producing fewer chickens would have reduced the supply of chickens to the market and avoided the decline in chicken prices.

Step 3: Answer part b. by explaining why poultry farmers failed to be more disciplined. The information provided indicates that there are a large number of poultry farmers in the United States. As a result, the quantity of chickens produced by any one farmer is small relative to the total quantity of chickens produced in the market. Therefore, poultry farmers are price takers and no one poultry farmer is able to significantly affect the market price of chicken. (In Chapter 12, Section 12.1, we discuss why firms in a competitive market are price takers.) The only way for poultry farmers to have maintained chicken prices would have been to collude, either explicitly or implicitly, to produce fewer chickens. Explicit collusion is a violation of the antitrust laws and is unlikely to have been effective in any case because individual poultry farmers have a strong incentive to cheat on any agreement to restrict output. The same is true of an attempt by farmers to implicitly collude to restrict supply.

Solved Problem: Is Using Money Efficient?

Supports: Macroeconomics, Chapter 14, Section 14.1, Economics, Chapter 24, Section 24.1, and Money, Banking, and the Financial System, Chapter 2, Section 2.1.

Image created by ChatGPT

A rare book dealer who often posts to YouTube made the following observation in one of his videos:

“… thousands of years ago, they had the barter system where you could literally exchange wheat for barley and barley for wheat directly. And the idea behind that was to … have a quick solution for [a] transaction, but over time they invented a monetary unit—coinage and money—and they thought that that would inject some efficiency into economic transactions. And in some ways it’s done the complete opposite. There’s a lot of inefficiency because now unfortunately I cannot go right into Bloomingdale’s and take a nice black suit off the shelf and exchange it for a Geneva Bible. I actually have to sell the Bible first … then go buy the suit. So that gives me a lot of extra work, so I’d rather go back to bartering ….”

The dealer may not have been entirely serious, but assuming that he was, is he correct that transacting using barter is more efficient than transacting using money? In your answer, be sure to define “efficient” in this context.

Solving the Problem
Step 1: Review the chapter material. This problem is about the efficiency of using money to purchase goods rather than engaging in barter, so you may want to review Macroeconomics, Chapter 15, Section 15.1, “What Is Money and Why Do We Need It?”

Step 2: Answer the problem by explaining why using money is more efficient than engaging in barter. The book dealer is correct that thousands of years ago, most societies used barter rather than money. Societies transitioned from barter to money because of the inefficiencies of barter. A key inefficiency of barter is the need for a double coincidence of wants. For a barter transaction to take place, each person must want what the other person has. It’s not enough for the book dealer to want a black suit from the Bloomingdale’s department store; Bloomingdale’s must be willing to trade the suit for a copy of the Geneva Bible—which is unlikely.

To use a copy of the Geneva Bible to obtain a suit using barter, the book dealer might have to make—possibly many—additional trades until he obtains some good that Bloomingdale’s would accept in exchange for the suit. In practice, it might be difficult to find such a good and doing so would likely involve substantial search costs.

We can conclude that money has replaced barter in most transaction because it is more efficient in the sense that it allows transactions to be completed at a lower cost.


Solved Problem: The Effect of a Cap on Credit Card Interest Rates

Supports: Macroeconomics Chapter 4, Section 4.3, and Chapter 14, Section 14.3 and Economics, Chapter 4, Section 4.3, and Chapter 24, Section 24.3.

Image created by ChatGPT

Credit cards provide two main services: 1) They are more convenient to use than cash and are more widely accepted than are personal checks, and 2) they are a source of short-term credit. People who pay their balances off at the end of each month get (very short-term) credit for free. People who don’t pay their balances off have to pay interest on the unpaid balance. Credit cards are the leading source of short-term credit to small businesses. We can think of the interest rate on credit card balances as the price of credit card services, although people who pay off their balances each month avoid paying this price. (Note that banks and other credit card issuers also earn fees from merchants who accept credit cards. These processing fees are usually between 1.5 percent and 3.5 percent of the price of the transaction.)

President Trump announced that he intends to cap the interest rate on credit cards at 10 percent. (Imposing such a cap is usually thought to require Congressional approval.) Currently, the average interest rate on credit cards is about 21 percent, although interest rates vary across cards due to differences in the awards the cards give to card holders and the credit history of the card holders.

In this problem, we look at the effect of capping credit card interest rates on the market for credit card services. An interest rate cap is effectively a price ceiling, so we can use the analysis in Chapter 4, Section 4.4, “Government Intervention in the Market: Price Floors and Price Ceilings” to analyze the effect of the interest rate cap on the market for credit card services.  We briefly discuss the effects of a cap on credit card interest rates in the Apply the Concept “Help for Young Borrowers: Fintech or Ceilings on Interest Rates?” in Chapter 14, Section 14.3.

  1. Use a demand and supply graph to illustrate the effect of a cap on credit card interest rates on the market for credit card services. Be sure that your graph shows the equilibrium price (interest rate) and quantity of credit card services before and after the imposition of the cap. Briefly explain why you would expect the demand curve for credit card services to be downward sloping and the supply curve for credit card services to be upward sloping.
  2. Which groups would you expect to be most affected and which would you expect to be least affected by the imposition of a cap on credit card interest rates?

Solving the Problem
Step 1: Review the chapter material. This problem is about the effect of an interest rate cap on the market for credit card services, so you may want to review Chapter 4, Section 4.4, “Government Intervention in the Market: Price Floors and Price Ceilings” and the Apply the Concept “Help for Young Borrowers: Fintech or Ceilings on Interest Rates?” in Chapter 14, Section 14.3.

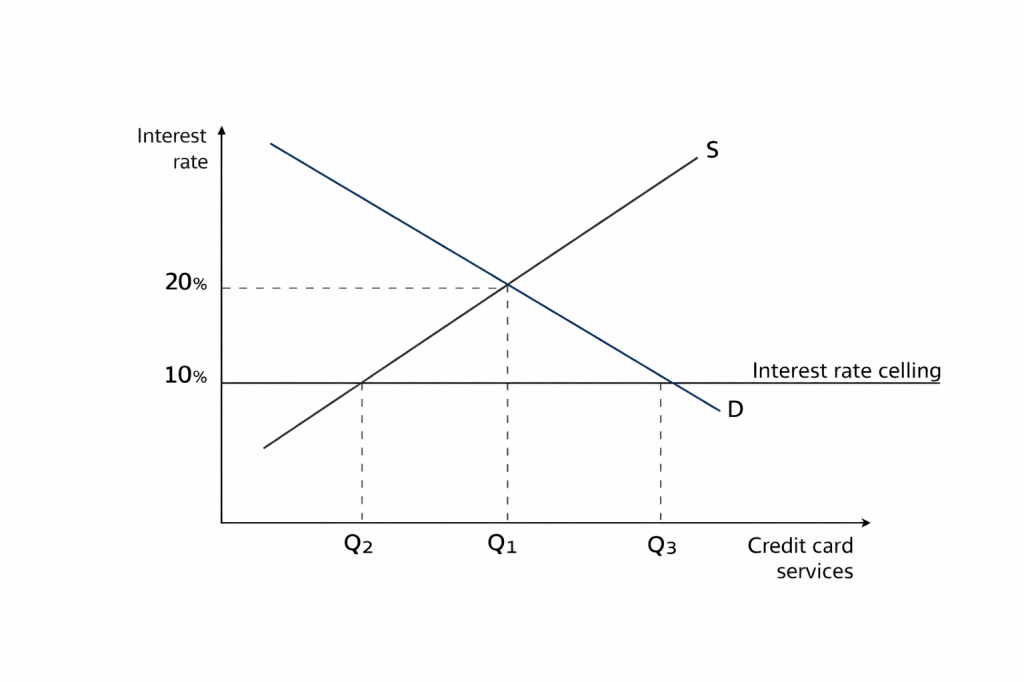
Step 2: Answer part a. by drawing a demand and supply graph of the market for credit card services that illustrates the effect of an interest rate cap.  The following figure is simlar to Chapter 4, Figure 4.10, which shows the effect of rent control on the market for rental apartments. We can show the interest rate cap as a horizontal line at an interest rate of 10%. The inital equilibrium, before the imposition of a cap, is at an interest rate of 20 percent and a quantity of credit card services, Q1, where the demand curve for credit card services crosses the supply curve for credit card services. After imposition of the interest rate ceiling, the equilibrium interest falls to 10 percent and the equilibrium quantity of credit card services falls from Q1 to Q2.

We would expect that the higher the interest rate on credit card balances, the fewer the quantity of credit card services consumers will demand. Therefore, the demand curve for credit card services should be downward sloping. We would also expect that the higher the interest rate on credit card balances, the great the quantity of credit card services that banks and other credit card issuers will supply. Therefore, the supply curve for credit card services should be upward sloping.

Step 2: Answer part b. by discussing which groups you would expect to be most affected and which you would expect to be least affected by the imposition of a cap on credit card interest rates. The figure shows that after the imposition of an interest rate ceiling there is a shortage of credit card services equal to the quantity Q3 – Q2. Because Q2 is less than Q1, we know that some people who would have credit cards prior to the imposition of the interest rate ceiling will no longer be able to qualify for them. These people will be affected most by the interest rate cap. We would expect that people who have a higher risk of defaulting on their credit card balances would be most likely to be unable to obtain credit cards following the imposition of the interest rate cap because credit card issuers won’t be able to charge them an interest rate high enough to compensate the issuers for the higher risk of default. In addition, those people who are still able to receive credit cards and who typically don’t pay off their balance each month will benefit from the decline in the interest rate on unpaid balances from 20 percent to 10 percent.

The people who pay off their balances each month will be least affected because they weren’t paying interest. There are some complications, however. Credit card issuers may respond to the interest rate cap by reducing the rewards—such as cash back on their purchases or points toward buying airline tickets or hotel stays—that card holders receive for using their cards. Reducing rewards would affect even those people who pay off their balances each month.   

Extra credit: There has been a debate over how many people would be affected by the imposition of a cap on credit card interest rates. For example, Brian Shearer of Vanderbilt University argues that credit card issuers will only modestly reduce the number of people with weak credit histories who they will no longer be willing to issue credit cards to.  Paul Calem and Alexander Kim of the Bank Policy Institute, a banking industry trade group, argue that up to two-thirds of people who currently fail to pay off their credit card balances each month are likely to no longer qualify for credit cards or will qualify for credit cards will lower dollar limits following the imposition of a credit card cap.

Solved Problem: Using the Demand and Supply Model to Analyze the Effects of a Tariff on Televisions

Supports: MicroeconomicsMacroeconomicsEconomics, and Essentials of Economics, Chapter 4, Section 4.4

Image generated by ChapGPT

The model of demand and supply is useful in analyzing the effects of tariffs. In Chapter 9, Section 9.4 (Macroeconomics, Chapter 7, Section 7.4) we analyze the situation—for instance, the market for sugar—when U.S. demand is a small fraction of total world demand and when the U.S. both produces the good and imports it.

In this problem, we look at the television market and assume that no domestic firms make televisions. (A few U.S. firms assemble limited numbers of televisions from imported components.) As a result, the supply of televisions consists entirely of imports. Beginning in April, the Trump administration increased tariff rates on imports of televisions from Japan, South Korea, China, and other countries. Tariffs are effectively a tax on imports, so we can use the analysis in Chapter 4, Section 4.4, “The Economic Effect of Taxes” to analyze the effect of tariffs on the market for televisions.  

  1. Use a demand and supply graph to illustrate the effect of an increased tariff on imported televisions on the market for televisions in the United States. Be sure that your graph shows any shifts of the curves and the equilibrium price and quantity of televisions before and after the tariff increase.
  2. An article in the Wall Street Journal discussed the effect of tariffs on the market for used goods. Use a second demand and supply graph to show the effect of a tariff on imports of new televisions on the market in the United States for used televisions. Assume that no used televisions are imported and that the supply curve for used televisions is upward sloping.

Solving the Problem
Step 1: Review the chapter material. This problem is about the effect of a tariff on an imported good on the domestic market for the good. Because a tariff is a like a tax, you may want to review Chapter 4, Section 4.4, “The Economic Effect of Taxes.”

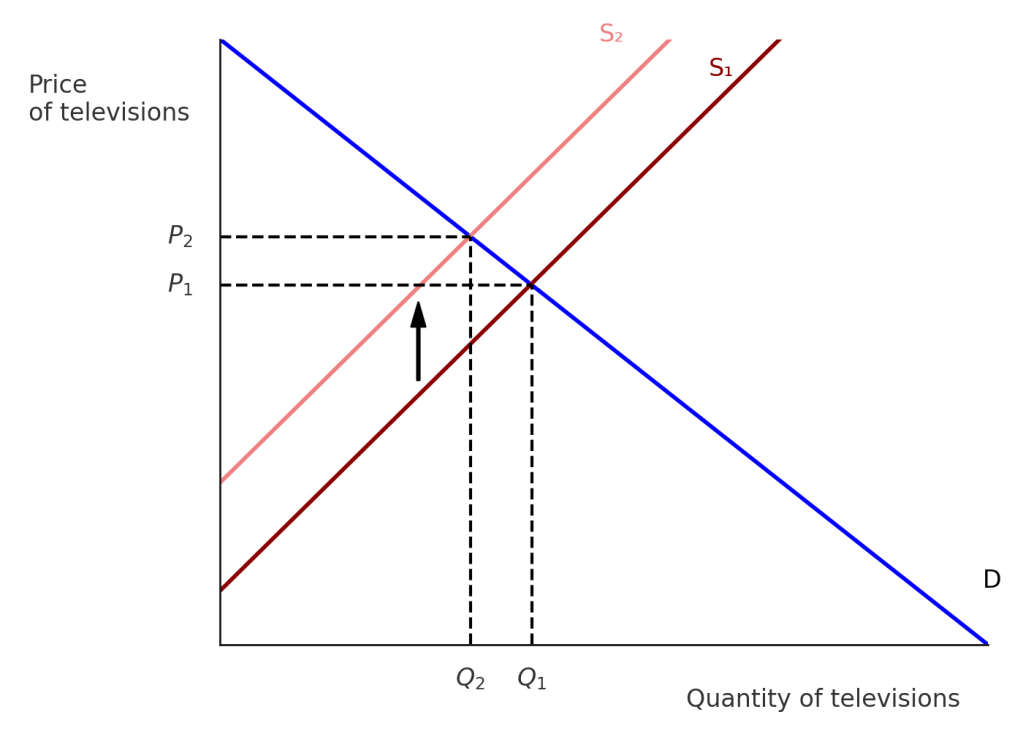
Step 2: Answer part a. by drawing a demand and supply graph of the market for televisions in the United States that illustrates the effect of an increased tariff on imported televisions.  The following figure shows that a tariff causes the supply curve of televisions to shift up from S1 to S2. As a result, the equilibrium price increases from P1 to P2, while the equilibrium quantity falls from Q1 to Q2.

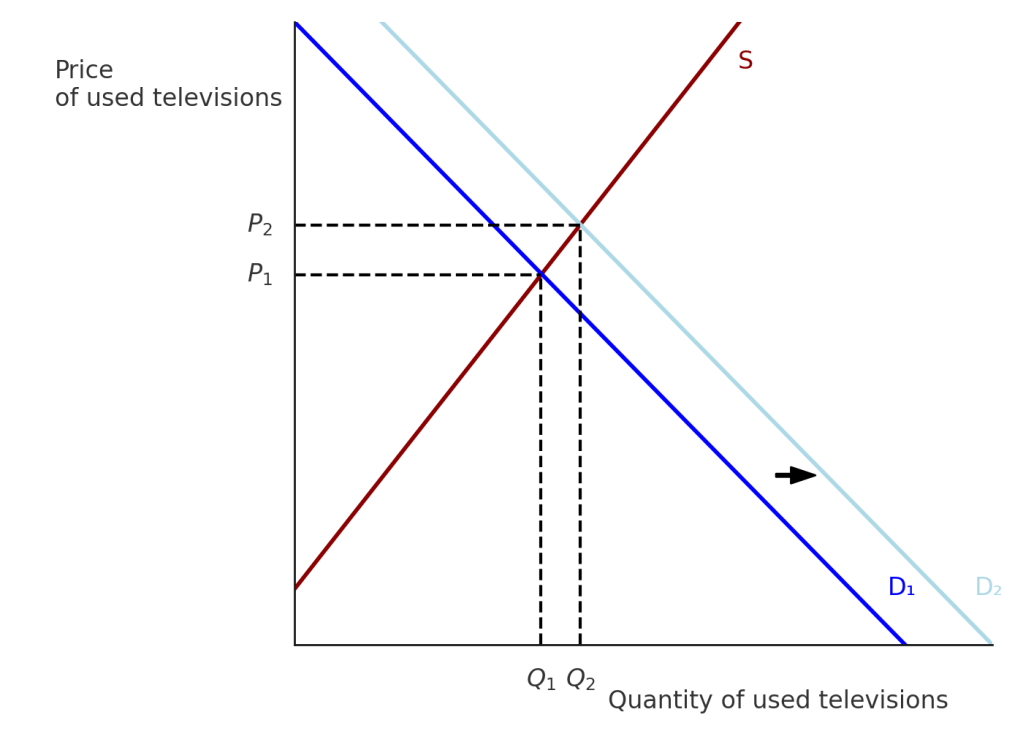
Step 2: Answer part b. by drawing a demand and supply graph of the market for used televisions in the United States that illustrates the effect on that market of an increased tariff on imports of new televisions. Although the tariff on imported televisions doesn’t directly affect the market for used televisions, it does so indirectly. As the article from the Wall Street Journal notes, “Today, in the tariff era, demand for used goods is surging.” Because used televisions are substitutes for new televisions, we would expect that an increase in the price of new televisions would cause the demand curve for used televisions to shift to the right, as shown in the following figure. The result will be that the equilibrium price of used televisions will increase from P1 to P2, while the equilibrium quantity of used televisions will increase from Q1 to Q2.

To summarize: A tariff on imports of new televisions increases the price of both new and used televisions. It decreases the quantity of new televisions sold but increases the quantity of used televisions sold.

Solved Problem: The Fed’s Dilemma

Supports: Macroeconomics, Chapter 13, Section 13.3; Economics, Chapter 23, Section 23.3; and Essentials of Economics, Chapter 15, Section 15.3

Image generated by ChatGPT

A recent article on axios.com made the following observation: “The mainstream view on the Federal Open Market Committee is based on risk management—that the possibility of a further downshift in the job market appears to be the more pressing concern than the chance that inflation will spiral higher.” The article also notes that: “Tariffs’ effects on inflation are probably a one-time bump.”

a. What is the dual mandate that Congress has given the Federal Reserve?

b. In what circumstances might the Federal Open Market Committee (FOMC) be faced with a conflict between the goals in the dual mandate?

c. What does the author mean by tariffs’ effects on inflation being a “one-time bump”?

d. What does the author mean by the FOMC engaging in “risk management”? What is a “downshift” in the labor market? If the FOMC is more concerned about a downshift in the labor market than about inflation, will the committee raise or lower its target for the federal funds rate? Briefly explain.

Solving the Problem
Step 1: Review the chapter material. This problem is about the policy dilemma the Fed can face when the unemployment rate and the inflation rate are both rising, so you may want to review Macroeconomics, Chapter 13, Section 13.3, “Macroeconomic Equilibrium in the Long Run and the Short Run.”

Step 2: Answer part a. by explaining what the Fed’s dual mandate is. Congress has given the Fed a dual mandate of achieving price stability and maximum employment.

Step 3: Answer part b. by explaining when the FOMC may face a conflict with respect to its dual mandate. When the FOMC is faced with rising unemployment and falling inflation, its preferred policy response is clear: The committee will lower its target for the federal funds rate in order to increase the growth of aggregate demand, which will increase real GDP and reduce unemployment. When the FOMC is faced with falling unemployment and rising inflation, its preferred policy response is also clear: The committee will raise its target for the federal funds rate in order to slow the growth of aggregate demand, which will reduce the inflation rate.

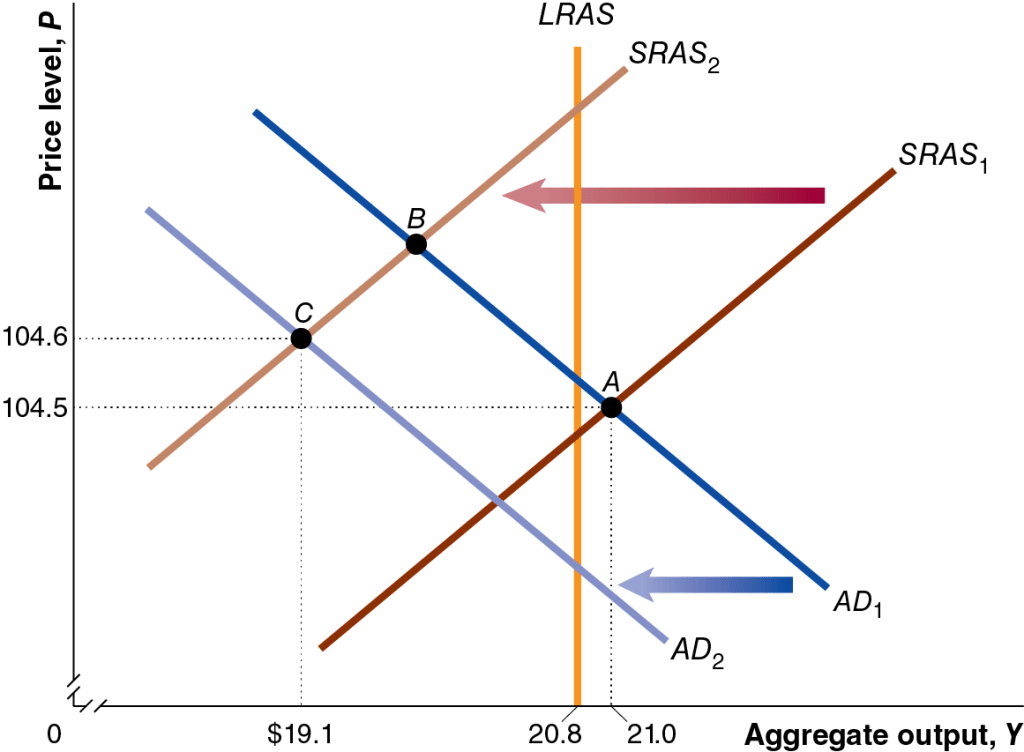
But when the Fed faces an aggregate supply shock, its preferred policy response is unclear. An aggregate supply shock, such as the U.S. economy experienced during the Covid pandemic and again with the tariff increases that the Trump administration began implementing in April, will shift the short-run aggregate supply curve (SRAS) will shift to the left, causing an increase in the price level, along with a decline in real GDP and employment. This combination of rising unemployment and inflation is called stagflation. In this situation, the FOMC faces a policy dilemma: Raising the target for the federal funds rate will help reduce inflation, but will likely increase unemployment, while lowering the target for the federal funds rate will lead to lower unemployment, but will likely increase inflation. The following figure shows the situation during the Covid pandemic when the economy experienced both an aggregate demand and aggregate supply shock. The aggregate demand curve and the aggregate supply curve both shifted to the left, resulting in falling real GDP (and employment) and a rising price level.

Step 4: Answer part c. by explaining what it means to refer to the effect of tariffs on inflation being a “one-time bump.” Tariffs cause the aggregate supply curve to shift to the left because by increasing the prices of raw materials and other inputs, they increase the production costs of some businesses. Assuming that tariffs are not continually increasing, their effect on the price level will end once the production costs of firms stop rising.

Step 5: Answer part d. by explaining what the author means by the FOMC engaing in “risk management,” explaining what a “downshift” in the labor is, and whether if the FOMC is more concerned about a downshift in the labor market than in inflation, it will raise or lower its target for the federal funds rate. The article refers to the “possibility” of a further downshift in the labor market. A downshift in the labor market means that the demand for labor may decline, raising the unemployment rate. Managing the risk of this possibility would involve concentrating on the maximum employment part of the Fed’s dual mandate by lowering its target for the federal funds rate. Note that the expectation that the effect of tariffs on the price level is a one-time bump makes it easier for the committee to focus on the maximum employment part of its mandate because the increase in inflation due to the tariff increases won’t persist.

Solved Problem: How Can Total Employment and the Unemployment Rate Both Increase at the Same Time?

SupportsMacroeconomics, Chapter 9, Economics, Chapter 19, and Essentials of Economics, Chapter 13.

Image generated by ChatGPT

A recent article on axios.com notes that from April 2023 to July 2024, the U.S. economy generated an average net increase of 177,000 jobs per month. Despite that job growth, the unemployment rate during that period increased by 0.8 percentage point. The article observes that: “At first glance, the combination of a rising unemployment rate and strong jobs growth simply does not compute.” How is it possible during a given period for both total employment and the unemployment rate to increase?

Solving the Problem
Step 1: Review the chapter material. This problem is about calculating the unemployment rate, so you may want to review Chapter 9, Section 9.1, “Measuring the Unemployment Rate, the Labor Force Participation Rate, and the Employment-Population Ratio.” 

Step 2: Answer the question by explaining how it’s possible for both the total number of people employed and the unemployment rate to both increase during the same period.  The unemployment rate is equal to the number of people unemployed divided by the number of people in the labor force (multiplied by 100). The labor force equals the sum of the number of people employed and the number of people unemployed.

Let’s consider the situation in a particular month. Suppose that the unemployment rate in the previous month was 4 percent. If, during the current month, both the number of people employed and the number of people unemployed increase, the unemployment rate will increase if the increase in the number of people unemployed as a percentage of the increase in the labor force is greater than 4 percent. The unemployment rate will decrease if the increase in the number of people unemployed as a percentage of the increase in the labor force is less than 4 percent.  

Consider a simple numerical example. Suppose that in the previous month there were 96 people employed and 4 people unemployed. In that case, the unemployment rate was (4/(96 + 4)) x 100 = 4.0%. 

Suppose that during the month the number of people employed increases by 30 and the number of people unemployed increases by 1. In that case, there are now 126 people employed and 5 people unemployed. The unemployment rate will have fallen from 4.0% to (5/(126 + 5)) x 100 = 3.8%.

Now suppose that the number of people employed increased by 30 and the number of people unemployed increases by 3. The unemployment will have risen from 4.0% to (7/(126 + 7)) x 100 = 5.3%.

We can conclude that if both the total number of people employed and the total number of people unemployed increase during a during a period of time, it’s possible for the unemployment rate to also increase.

Solved Problem: Why Do U.S. Airlines Charge Solo Travelers Higher Ticket Prices?

Supports: Microeconomics and Economics, Chapter 15, Section 15.5, and Essentials of Economics, Chapter 10, Section 10.5

Image generated by ChatGTP 03

According to a recent article in the Economist, some U.S. airlines have “started charging higher per-person fares for single-passenger bookings than for identical itineraries with two people.” However, the difference in fares held only for round-trip tickets that included a weekday return flight. For round-trip tickets with a return flight on Saturday, the per-ticket price was the same whether booking for two people or for one person. Briefly explain why an airline might expect to increase its profit using this pricing strategy.

Step 1: Review the chapter material. This problem is about firms using price discrimination, so you may want to review Chapter 15, Sections 15.5 

Step 2: Answer the question by explaining why an airline might expect to increase its profit by charging people traveling alone a higher ticket price than the price it charges per ticket to two people traveling together. The airline is attempting to increase its profit by using price discrimination. Price discrimination involves charging different prices to different customers for the same good or service when the price difference isn’t due to differences in cost. Firms who able to price discriminate increase their profits by doing so.

In Chapter 15, Section 15.5, we call the airlines the “kings of price discrimination” because they often charge many different prices for tickets on the same flight. One key way that airlines practice price discrimination is by charging higher prices to business travelers—who are likely to have a lower price elasticity of demand—than to leisure travelers—who are likely to have a higher price elasticity of demand. To employ this strategy, airlines have to successfully identify which flyers are business travelers. Someone flying alone is more likely than someone flying in a group of two or more people to be a business traveler. In addition, business travelers often attempt to complete their trips before the weekend. Therefore, people returning from a trip on a Saturday or Sunday are more likely to be leisure travelers.

We can conclude that an airline can expect to increase its profit using the pricing strategy discussed in the Economist article because the strategy helps the airline to better identify business travelers.

Solved Problem: Rent Control in Holland

Supports: Microeconomics, MacroeconomicsEconomics, and Essentials of Economics, Chapter 4, Section 4.3

Image generated by ChatGTP-40 of a street in a Dutch city.

An article on bloomberg.com has the headline “How Rent Controls Are Deepening the Dutch Housing Crisis.” The article’s subheadline states that: “A law designed to make homes more affordable ended up aggravating an apartment shortage.” According to the article, the Dutch government passed a law that increased the number of apartments subject to rent control from 80% of all apartments to 96%.

  1. Why might the Dutch government have seen expanding rent control as a way to make apartments more affordable? 
  2. Why might the law have aggravated the shortage of apartments in Holland?

Solving the Problem
Step 1: Review the chapter material. This problem is about the effects of rent control, so you may want to review Chapter 4, Section 4.3, “Government Intervention in the Market: Price Floors and Price Ceilings.”

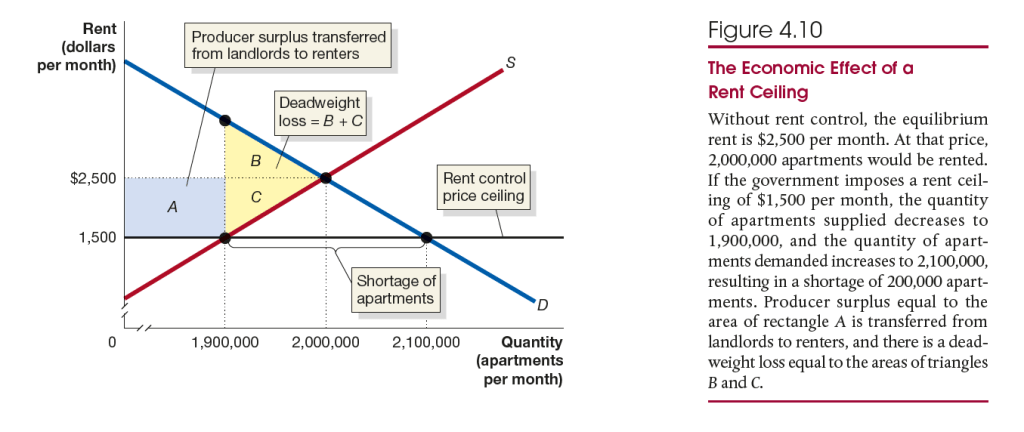
Step 2: Answer part a. by explaining why the Dutch government may have seen expanding rent control as a way to make apartments more affordable. Figure 4.10 from the textbook shows the effects of rent control. In the example illustrated in the figure, after the government imposes rent control, the 1,900,000 people who are still able to rent an apartment pay $1,500 per month rather than $2,500 per month. For these people, rent control has made apartments more affordable.

Step 3: Answer part b. by explaining why rent control laws can make an apartment shortage worse. As Figure 4.10 shows, rent control laws impose a price ceiling below the equilibrium market rent. The result is that the quantity of apartments supplied is less than the quantity of apartments demanded, causing a shortage of apartments. In the case of the Dutch law discussed in the article, existing rent controls were expanded to cover more apartments, forcing the rents charged by landlords for these apartments to fall below what had been the equilibrium market rent, thereby adding to the shortage of apartments in Holland.

Extra credit: The article notes that as a result of the law, some owners of apartments that had previously not been subject to rent control had decided to sell their apartments, taking them off the rental market. That result is common when governments impose rent control or expand the scope of an existing rent control law. One important aspect of rent control is that a shortage of apartments gives landlords a greater opportunity to pick and choose the tenants they prefer. The article notes that a provision of the new law requires that rental contracts be open-ended, rather than for only one or two years, as is more common. As a result, landlords have more difficulty evicting tenants who might be noisy or causing other problems. The law thereby gives landlords an incentive to rent to foreign tenants who would be more likely to give up their apartments voluntarily after a year or two. The result is even fewer apartments available for Dutch residents to rent.

A recent article on bloomberg.com notes that the negative consequences of the law expanding rent control has led the Dutch government to propose modifying the law to allow landlords to charge higher rents on at least some apartments. If passed by the Dutch parliment, the changes would go into effect January 1, 2026.

Solved Problem: Do Some Cable Companies Engage in Price Discrimination?

Supports: Microeconomics and Economics, Chapter 15, Section 15.5, and Essentials of Economics, Chapter 10, Section 10.5

Image generated by ChatGTP-4o

A national provider of cable television and internet service has been frequently criticized by customers on social media for using the following business strategy: The company raises its prices every six to nine months. Any subscriber who calls to complain is offered a discount off of the price increase. Analyze how this strategy can be profit mazimizing for the company.

Step 1: Review the chapter material. This problem is about firms using price discrimination, so you may want to review Chapter 15, Sections 15.5 

Step 2: Answer the question by explaining how the cable company is using price discrimination to increase its profit. Price discrimination involves charging different prices to different customers for the same good or service when the price difference isn’t due to differences in cost. Firms who able to price discriminate increase their profits by doing so.

We’ve seen that there are three requirements for a firm to practice price discrimination: 1) The firm must possess market power, 2) some of the firm’s customers much have a greater willingness to pay for the product than do other customers, and 3) the firm must be able to segment the market to keep customers who buy the product at the low price from reselling it. Cable companies can meet all three requirements. Cable firms possess market power—they  aren’t perfect competitors. Some customers have a higher willingness than other customers to pay for cable service. In fact, many people have become cable cutters and prefer to stream content rather than watch programs on cable. Finally, someone who receives a lower-priced cable subscription can’t resell it.

To increase profit by price discrimination, a firm needs to charger a higher price to customers with a lower price elasticity of demand, and a lower price to customers with a higher price elasticity of demand. People who call up to complain about an increase in the price of a cable subscription are likely to be more price sensitive—and, therefore, more likely to switch to a competing cable company or to cut the cable and switch to streaming—than are people who don’t complain about the increase in the price of a subscription. In other words, the complainers have a higher price elasticity of demand than do the non-complainers and receive a lower price. We can conclude that this business strategy is an example of price discrimination and will increase the profit of the cable company that uses it.

The Risk of Buying Very Long-Term Bonds

Supports: Money, Banking, and the Financial System, Chapter 3, Section 3.5

Image generated by ChatGTP-4o

The 30-year U.S. Treasury bond has the longest maturity available on a bond issued by the U.S. government. Some other governments have issued century bonds, which are bonds that don’t mature for 100 years. Bonds with maturities longer than 30 years are sometimes called ultra-long-term bonds. For example, in June 2020 the government of Austria issued a bond that will mature in June 2120. The bond has a par value of €100 and a coupon rate of 0.85%, which seems low but was high in comparison with the yields on other European government bonds at the time. For example, the yield on the 10-year German government bond was negative from April 2019 through January 2021.

Today (April 25), in a newsletter from the Wall Street Journal, Spencer Jakab noted that: “With a little over 95 years remaining, those [Austrian century] bonds now fetch 35 cents on the euro. Investors aren’t worried about being repaid ….”

a. What does Jakab mean that the “bonds now fetch 35 cents on the euro”?

b. If the investors aren’t worried about the Austrian government making coupon or principal payments on the bond, why do the bonds fetch only 35 cents on the euro?

Solving the Problem
Step 1: Review the chapter material. This problem is about the relationship between the interest-rate risk on a bond and the bond’s maturity, so you may want to review Money, Banking, and the Financial System, Chapter 3, Section 3.5, “Interest Rates and Rates of Return.”

Step 2: Answer part a. by explaining what Jakab means by writing that Austrian century bonds that mature in 2120 now fetch “35 cents on the euro.” The bonds have a par value (or face value) of €100. By “35 cents on the euro,” Jakab must mean that the current price the bonds are trading at is €35.

Step 3: Answer part b. by explaining why the market price of these Austrian century bonds has declined by 65% from their par value even though the bonds have low default risk. As we discuss in this section of the textbook, long-term bonds have substantial interest-rate risk—the risk that the price of the bond will fluctuate in response to changes in market interest rates—even if they have very low default risk—the risk that an investor won’t receive the coupon and principal payments on the bond.  As Table 3.2 in this section shows, the longer the maturity of a bond, the greater the interest-rate risk. As market interest rates on other government bonds have risen, the yield on the Austrian century bonds has also had to rise for investors to be willing to buy these bonds. With a fixed coupon rate of 0.85%, the only way for the yield to rise is for the price of the bonds to fall. Given the very long maturity of these bonds, the price has had to fall by 65% from its par value to make the yield on the bonds competitive with other government bonds.