Solved Problem: High Prices and High Revenue in the U.S. Car Industry

Production line for Ford F-series trucks. Photo from the Wall Street Journal.

Supports: Microeconomics, Chapter 6, Section 6.3 and Chapter 15, Section 15.6, Economics Chapter 6, Section 6.3 and Chapter 15, Section 15.6, and Essentials of Economics, Chapter 7, Section 7.7 and Chapter 10, Section 10.5.

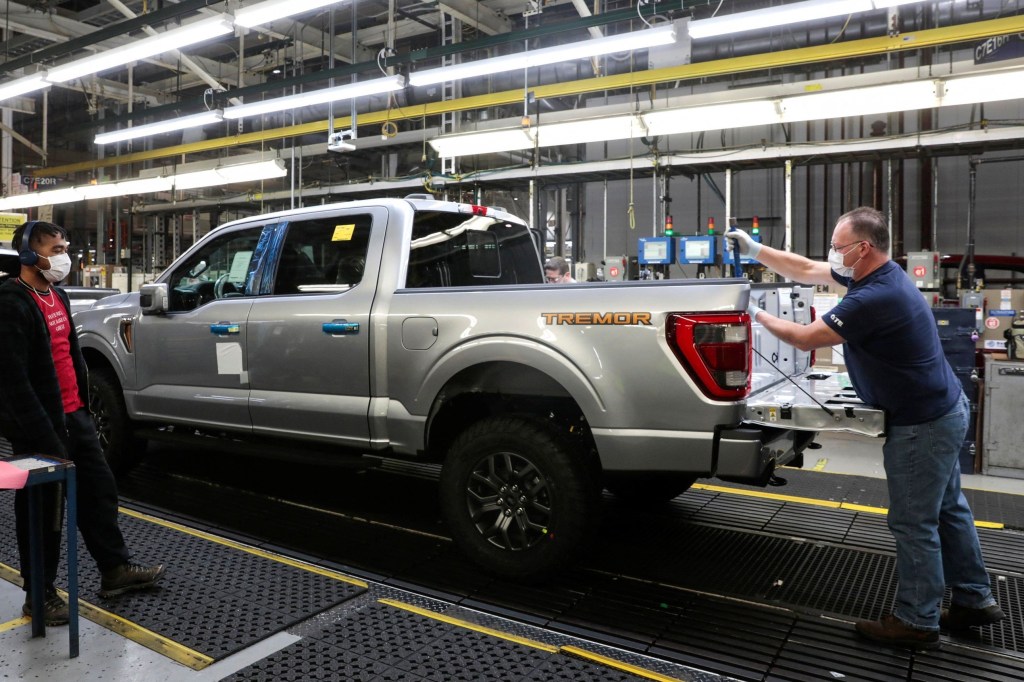
In July 2022, an article in the Wall Street Journal noted that “The chip shortage and broader supply constraints have hampered vehicle production … Many major car companies on Friday reported U.S. sales declines of 15% or more for the first half of the year.” But the Wall Street Journal also reported that car makers were experiencing increases in revenues. For example, Ford Motor Company reported an increase in revenue even though it had sold fewer cars than during the same period in 2021.

  1. Briefly explain what must be true of the demand for new cars if car makers can sell 15 percent fewer cars while increasing their revenue.
  2. Eventually, the chip shortage and other supply problems facing car makers will end. At that point, would we expect that car makers will expand production to prepandemic levels or will they continue to produce fewer cars in order to maintain higher levels of profits? Briefly explain. 

Solving the Problem

Step 1: Review the chapter material. This problem is about the effects of price increases on firms’ revenues and on the ability of firms to restrict output in order increase profits, so you may want to review Chapter 6, Section 6.3, “The Relationship between Price Elasticity of Demand and Total Revenue” and Chapter 15, Section 15.6, “Government Policy toward Monopoly.” 

Step 2: Answer part a. by explaining what must be true of the demand for new cars if car makers are increasing their profits while selling fewer cars. Assuming that the demand curve for cars is unchanged, a decline in the quantity of cars sold will result in a move up along the demand curve for cars, raising the price of cars.  Only if the demand curve for new cars is price inelastic will the revenue car markers receive increase when the price increases. Revenue increases in this situation because with an inelastic demand curve, the percentage increase in price is greater than the percentage decrease in quantity demanded. 

Step 3: Answer part b. by explaining whether we should expect that once the car industry’s supply problems are resolved, car makers will continue to produce fewer cars.  Although as a group car makers would be better off if they could continue to reduce the supply of cars, they are unlikely to be able to do so. Any one car maker that decided to keep producing fewer cars would lose sales to other car makers who increased their production to prepandemic levels. Because this increased production would result in a movement down along the demand curve for new cars, the price would fall. So a car maker that reduced output would receive a lower price on its reduced output, causing its profit to decline. (Note that this situation is effectively a prisoner’s dilemma as discussed in Chapter 14, Section 14.2.)

The firms could attempt to keep output of new cars at a low level by explicitly agreeing to do so.  But colluding in this way would violate the antitrust laws, and executives at the firms would risk being fined or even imprisoned. The firms could attempt to implicitly collude by producing lower levels of output without explicitly agreeing to do so. (We discus implicit collusion in Chapter 14, Section 14.2.) But implicit collusion is unlikely to succeed because firms have an incentive to break an implicit agreement by increasing output. 

We can conclude that once the chip and other supply problems facing car makers are resolved, production of cars is likely to increase.

Sources: Mike Colias and Nora Eckert, “GM Says Unfinished Cars to Hurt Quarterly Results,” Wall Street Journal, July 1, 2022; and Nora Eckert, “Ford’s U.S. Sales Increase 32% in June, Outpacing Broader Industry,” Wall Street Journal, July 5, 2022.

Price Leadership in the Beer Market

InBev’s St. Louis production line for Stell Artois beer. Photo from the Wall Street Journal

Firms in an oligopoly can increase their profits by agreeing with other firms in the industry on what prices to charge. Explicit price fixing violates the antitrust laws and can subject the firms involved to fines of up to $100 million and executives at the firms to fines of up to $1 million and prison terms of up to 10 years. Despite these penalties, the rewards to avoiding price competition are often so great that firms look for ways to implicitly collude—that is, to arrange ways to coordinate their prices without violating the law by explicitly agreeing on the prices to charge. (We discuss the antitrust laws in Microeconomics and Economics, Chapter 15, Section 15.6.) 

One way for firms to implicitly collude is through price leadership. With price leadership, one firm in the industry takes the lead in announcing a price change that other firms in the industry then match. (We briefly discuss price leadership in Microeconomics and Economics, Chapter 14, Section 14.2.)

In their classic industrial organization textbook, F.M. Scherer of Harvard’s Kennedy School and David Ross of Bryn Mawr College summarize the legal status of price leadership, given court opinions from antitrust cases: “[P]rice leadership is not apt to be found contrary to the antitrust laws unless the leader attempts to coerce other producers into following its lead, or unless there is evidence of an agreement among members of the industry to use the leadership device as the basis of a price-fixing scheme.” As the Federal Trade Commission notes on its website: “A uniform, simultaneous price change could be the result of price fixing, but it could also be the result of independent business responses to the same market conditions.”

Scherer and Ross describe price leadership in a number of oligopolistic industries during the twentieth century, including cigarettes, steel, automobiles, breakfast cereals, turbogenerators, and gasoline.

Recently, Nathan Miller of Georgetown University, Gloria Sheu of the Federal Reserve, and Matthew Weinberg of Ohio State University published an article in the American Economic Review analyzing price leadership in the beer industry. They focus on the period from 2001 to 2011, although they believe that conditions in the beer industry are similar today. From 2001 to 2007, three large U.S.-based firms—Anheuser-Busch, SABMiller, and Molson Coors—accounted for about two-thirds of beer sales in the United States. Two importers—Heineken and Grupo Modelo—accounted for about 14 percent of sales.  In 2008, SABMiller and Molson Coors combined to form MillerCoors and InBev—which had a small market share—bought Anheuser Busch. In 2011, MillerCoors and InBev together accounted for 63 percent of beer sales.

ABI has acted as the price leader, announcing prices in the late summer that MillerCoors typically matches. ABI’s Bud Light had the largest market share among beers in the United States in 2011, well ahead of Coors Light, which had the second largest share. They find that industry profits were 17 percent above the competitive level in 2007—just before the Miller-Coors merger—and 22 percent above the competitive level in 2010—after the merger. The U.S. Department of Justice (DOJ) had decided not to contest the Miller-Coors merger because “cost savings in distribution likely would offset any loss of competition.” As it turned out, the cost savings occurred but their value was smaller than the losses in consumer surplus resulting from reduced competition.

The authors estimate that, compared with the competitive outcome, the reduction in consumer surplus in the beer market due to price leadership equaled 154 of the increase in producer surplus before the Miller-Coors merger and 170 percent after it. Figure 15.5 from Chapter 15 of Microeconomics (reproduced below) illustrates why the loss of consumer surplus is larger than the increase in producer surplus: The increase in price and decline in quantity compared with the competitive level results in a deadweight loss that reduces the total economic surplus in the market. (Note that the figure is comparing the situation when a market is monopoly with the situation when the market is perfectly competitive. For simplicity, we are assuming that price leadership in an oligopolistic industry, such as beer, results in the monopoly outcome. But note that whenever collusive behavior, like price leadership, occurs in an industry, we would expect an increase in deadweight loss that will make the gains to firms larger than the losses to consumers.)

Sources: Federal Trade Commission, “Price Fixing,” ftc.gov; U.S. Department of Justice, Antitrust Division, “Price Fixing, Bid Rigging, and Market Allocation Schemes: What They Are and What to Look for,” justice.gov; Nathan H. Miller, Gloria Sheu, and Matthew C. Weinberg, “Oligopolistic Price Leadership and Mergers: The United States Beer Industry,” American Economic Review, Vol. 111, No. 10, pp. 3123-3159; and F.M Scherer and David Ross, Industrial Market Structure and Economic Performance, Third edition, Boston: Houghton Mifflin, 1990.

Solved Problem: Pricing Video Games

Supports:  Econ (Chapter 12 – Oligopoly: Firms in Less Competitive Markets (Section 14.2); Essentials: Chapter 11 – Monopolistic Competition and Oligopoly (Section 11.6)

Solved Problem: Pricing Video Games

   In November 2020, an article on bloomberg.com discussed the pricing of video games for consoles like PlayStation and Xbox. The article noted that firms selling video games had kept prices constant at $60 per game since 2005. But this stable price was about to change: “This week, video game publishers will press ahead with an industry-wide effort to raise the standard price to $70.” An article in the Wall Street Journal indicated that the number of people playing video games has been increasing and had reached 244 million in the United States and 3.1 billion worldwide in 2020. Answer the following questions assuming that the video game industry is an oligopoly.

a. Is it likely that the demand for video games and the cost of producing them have remained constant for 15 years? If not, what can explain the fact that the prices of video games remained constant from 2005 to 2020?

b. Given your answer to part a., what can explain the fact that the prices of video games increased by $10 in 2020? Does the fact that this increase was an “industry-wide effort” matter? Briefly explain.

Sources: Olga Kharif and Takashi Mochizuki, “Video Game Prices Are Going Up for the First Time in 15 Years,” Bloomberg.com, November 9, 2020; and Sarah E. Needleman, “From ‘Fall Guys’ to ‘Among Us,’ How America Turned to Videogames Under Lockdown,” Wall Street Journal, October 31, 2020.

Solving the Problem

Step 1:   Review the chapter material. This problem is about pricing in an oligopolistic industry, so you may want to review Chapter 14, Section 14.2 “Game Theory and Oligopoly.”

Step 2:   Answer part a. by discussing whether it’s likely that the demand for video games and the cost of producing them have remained constant for 15 years and by providing an alternative explanation for the prices of video games remaining constant over this period. Over such a long period, it’s unlikely that the demand for video games and the cost of producing them have remained constant. For one thing, the Wall Street Journal article indicates that the number of people playing video games has been increasing, reaching 244 million in the United States in 2020 (out of a U.S. population of about 330 million). The cost of producing most consumer electronics has declined over the years. Although we are not given specific information that the cost of producing video games has followed this pattern, it seems probable that it did. So, it’s unlikely that the reason that the prices of video games have remained constant is that the demand for video games and the cost of producing them have remained unchanged.

The problem tells us to assume that the video game industry is an oligopoly. We know that price stability in an oligopolistic industry can sometimes be the result of the firms in the industry finding themselves in a prisoner’s dilemma. In this situation, the most profitable strategy for a firm is to match the low price charged by competitors even though the firm and its competitors could, both as a group and individually, earn larger profits by all charging a higher price. It seems more likely that the firms in the video game industry were stuck for years in a prisoner’s dilemma than that they have faced unchanged demand and production costs over such a long period.

Step 3:   Answer part b. by explaining why the prices of video games increased by $10 in 2020, taking into account that the increase was an “industry-wide effort.” As we note in the textbook, the prisoner’s dilemma is an example of a noncooperative equilibrium in which firms fail to cooperate by taking actions—in this case raising the prices of video games—that would make them all better off. Firms have an incentive to increase their profits by switching to a cooperative equilibrium of charging $10 more for video games by implicitly colluding to do so. Explicitly colluding by having firms’ executives meet and agree to raise prices is against the law in the United States and Europe. But implicit collusion in which firms signal to each other—perhaps by talking about their plans with journalists—that they intend to raise prices is a gray area of the law that governments may not take action against. The fact that the bloomberg.com article states that the price increase was an “industry-wide effort” is an indication that video game firms may have implicitly colluded to raise video game prices by $10.