Image created by ChatGPT
Today (July 14), the Bureau of Labor Statistics (BLS) released its report on the consumer price index (CPI) for June. In May, higher energy prices caused by the conflict in Iran contributed to inflation increasing to the highest rate in more than three years. In June, as energy prices decreased, inflation experienced the largest one-month decrease since April 2020.
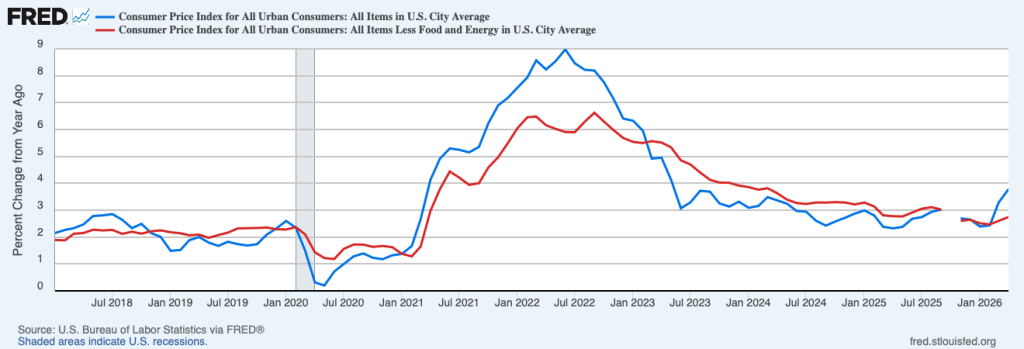
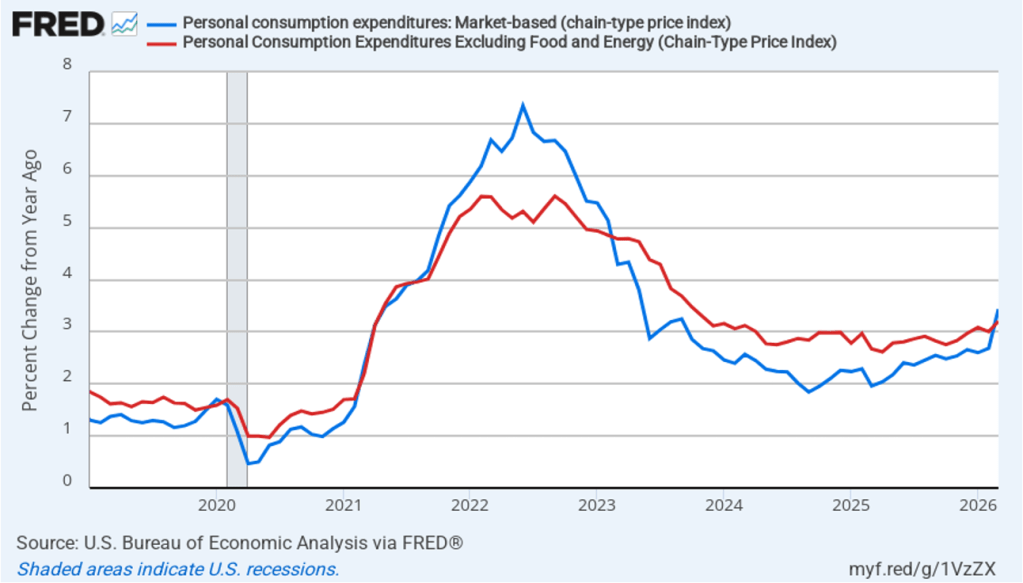
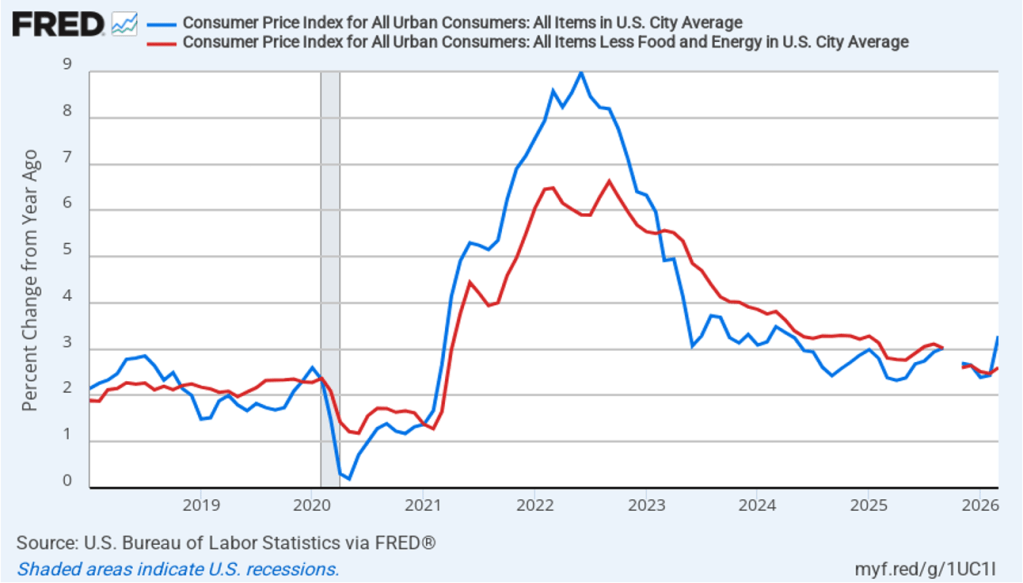
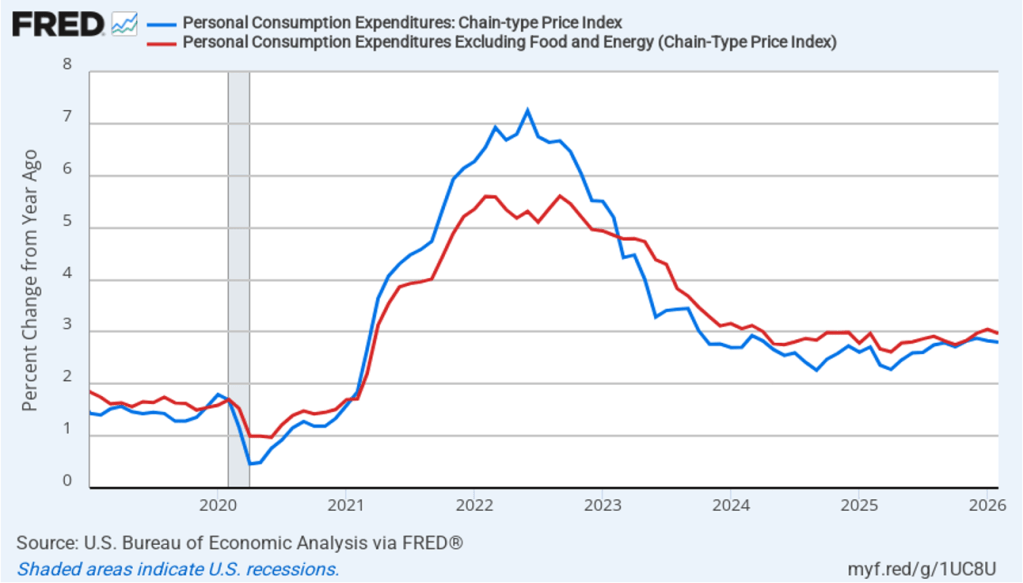
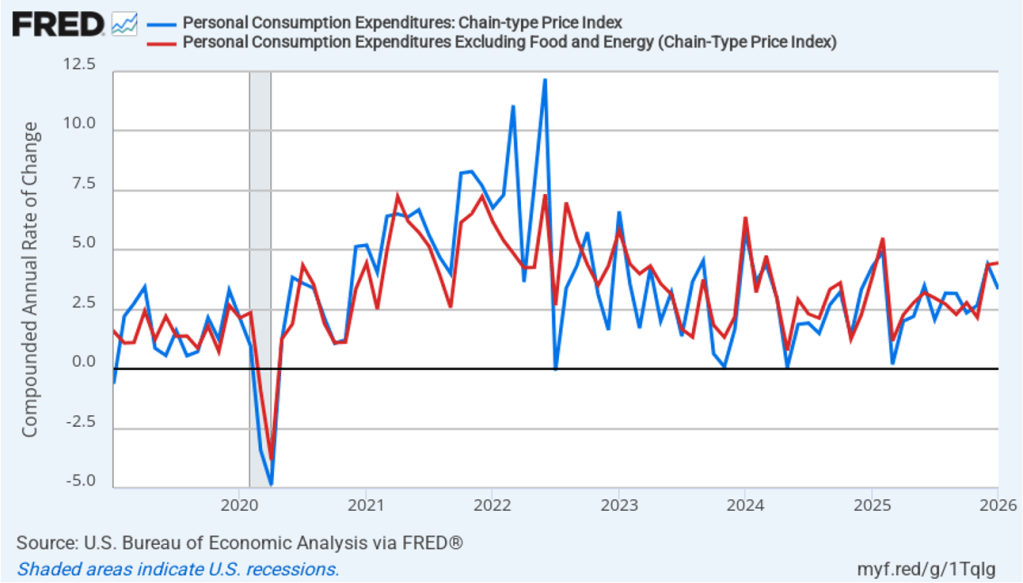
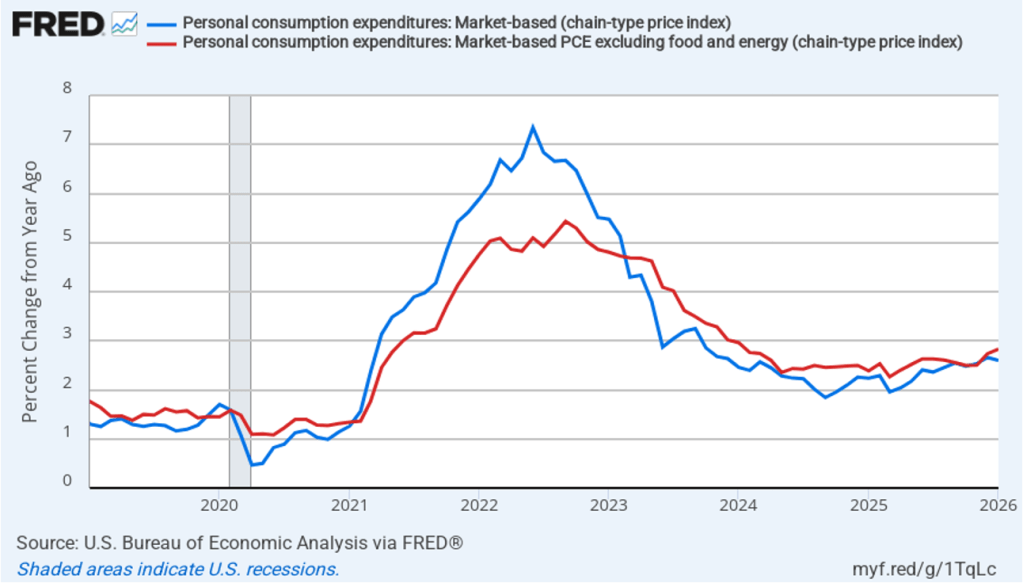
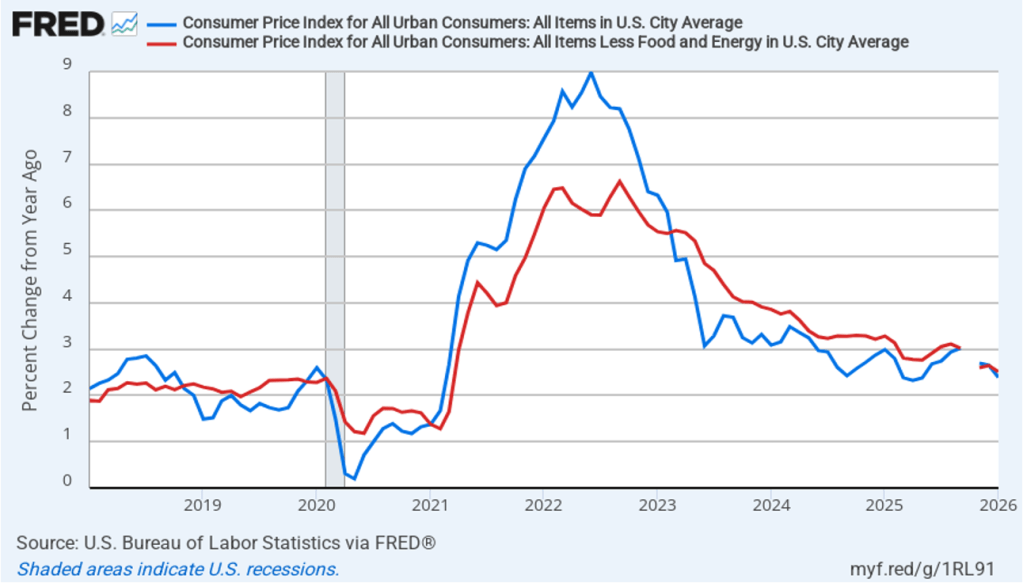
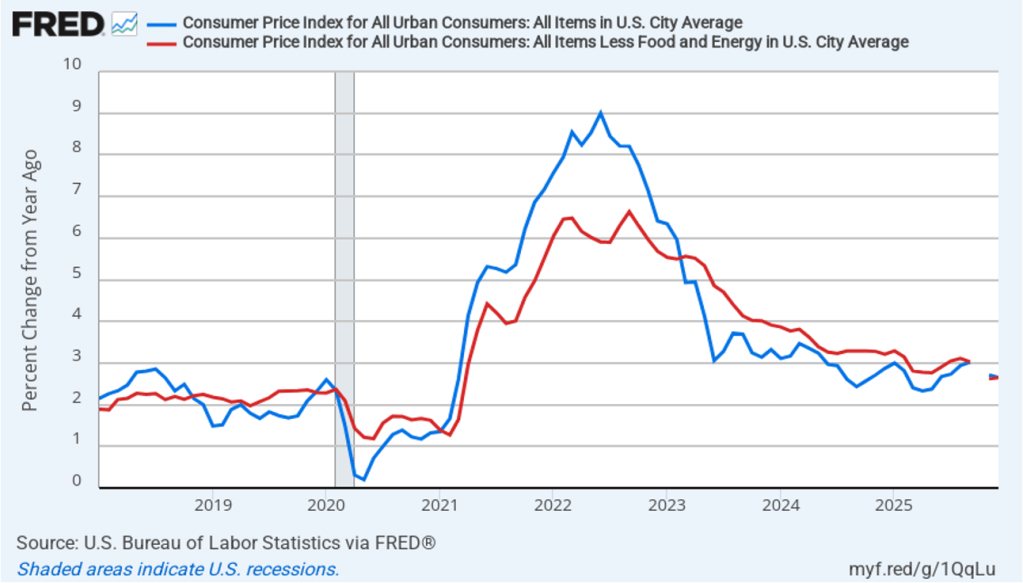
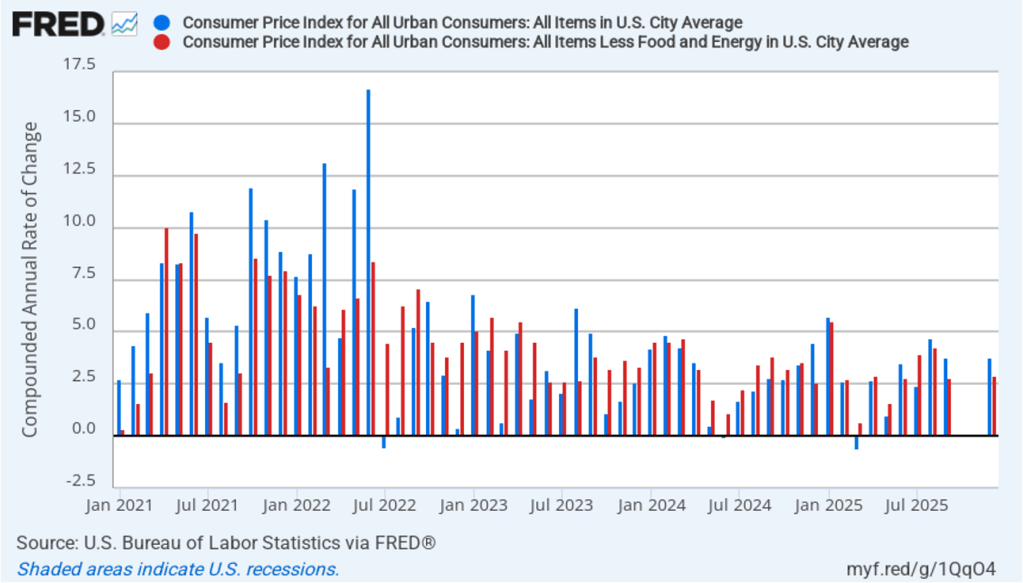
The following figure compares headline CPI inflation (the blue line) and core CPI inflation (the red line).
- The headline inflation rate, which is measured by the percentage change in the CPI from the same month in the previous year, was 3.5 percent in June, down from 4.2 percent in May.
- The core inflation rate, which excludes the prices of food and energy, declined from 2.8 percent in May to 2.6 percent in June.
Headline inflation and core inflation were both well below the forecasts of economists surveyed by FactSet. (Note that because of last year’s federal government shutdown, inflation data for October and November 2025 are not available.)

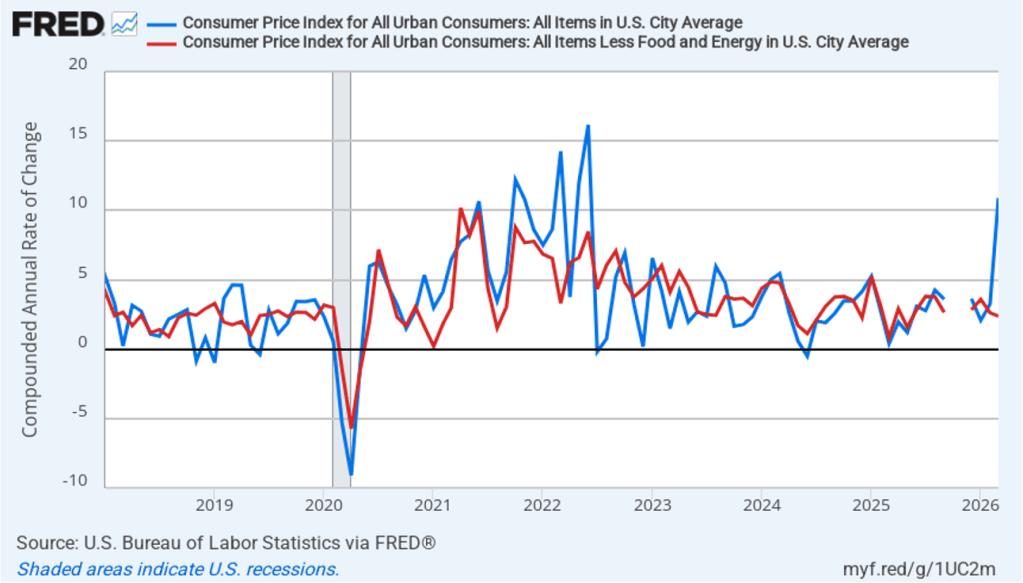
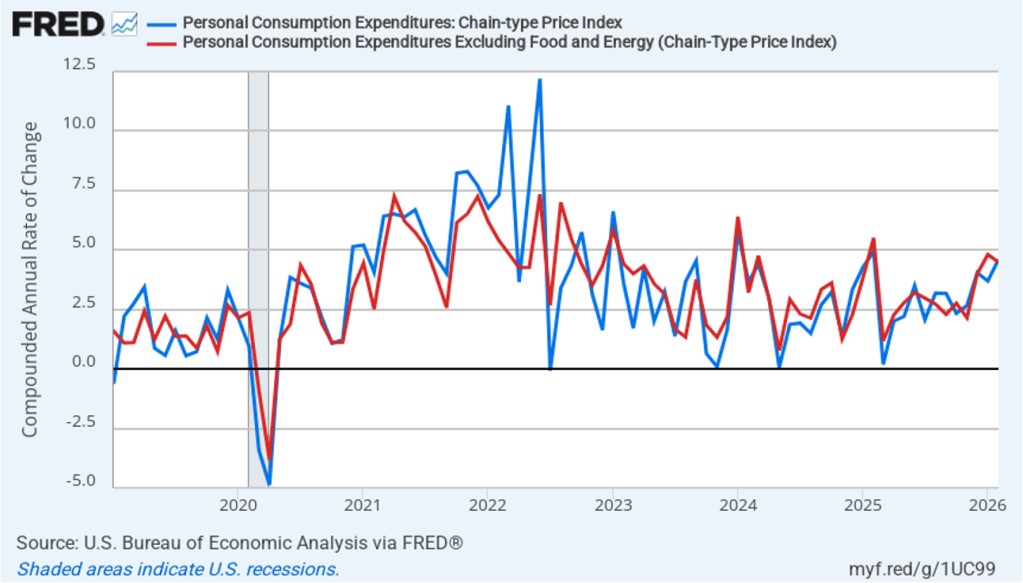
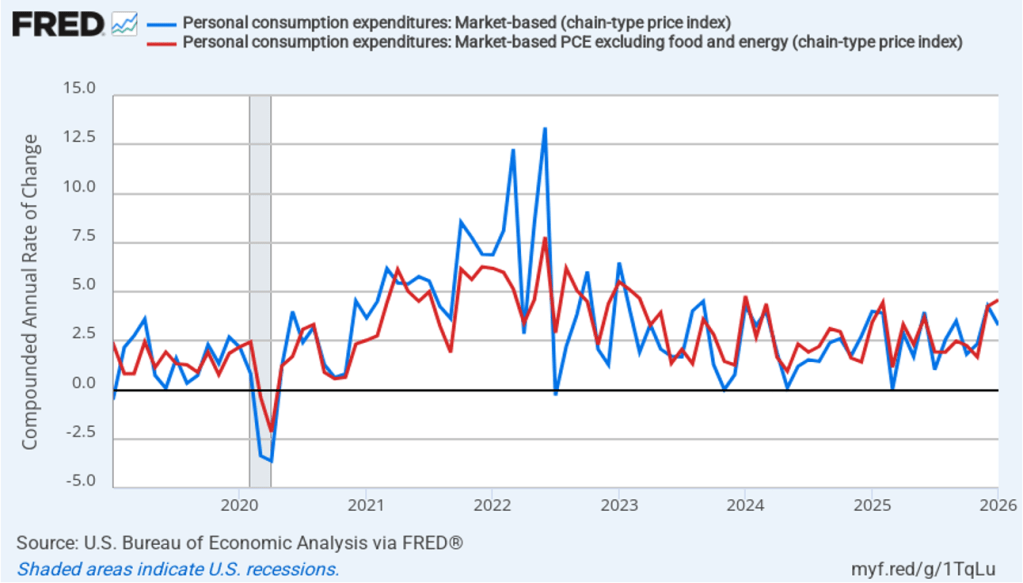
In the following figure, we look at the 1-month inflation rate for headline and core inflation—that is the annual inflation rate calculated by compounding the current month’s rate over an entire year. Calculated as the 1-month inflation rate, both headline (the blue line) and core inflation (the red line) were negative in June. That is, the U.S. economy experienced deflation last month because the price level, measures by the CPI and by the CPI less food and energy prices, fell in June.

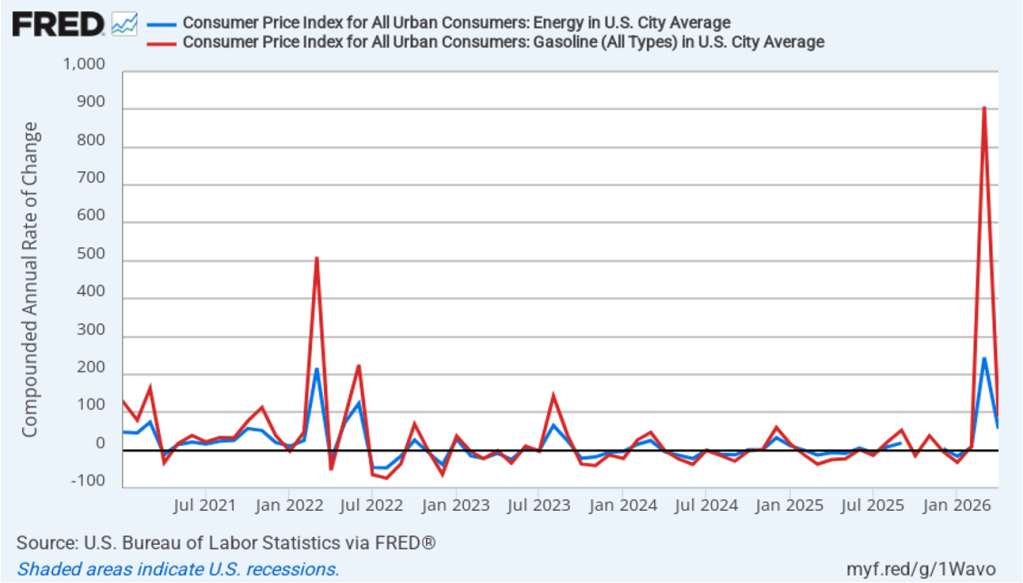
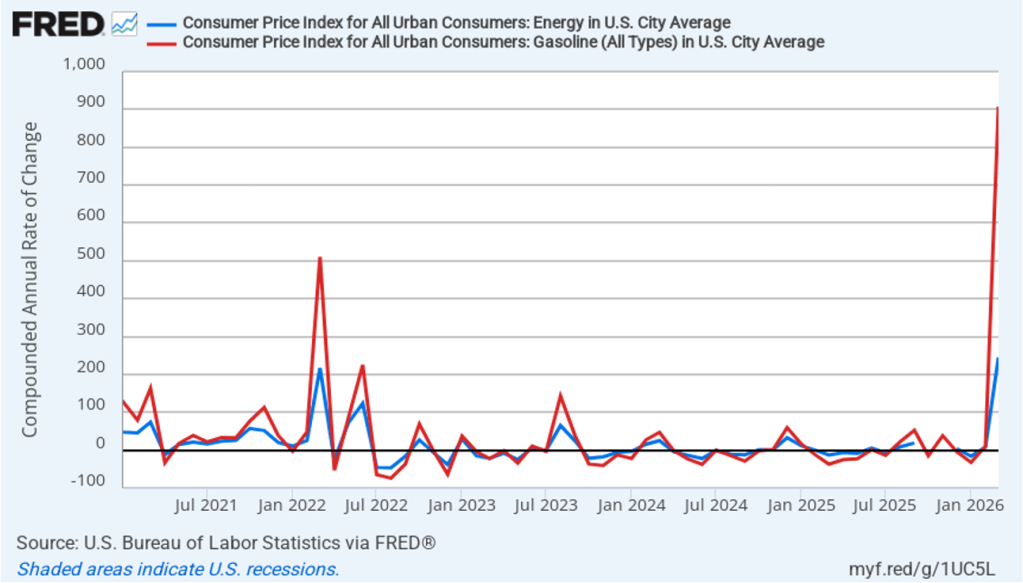
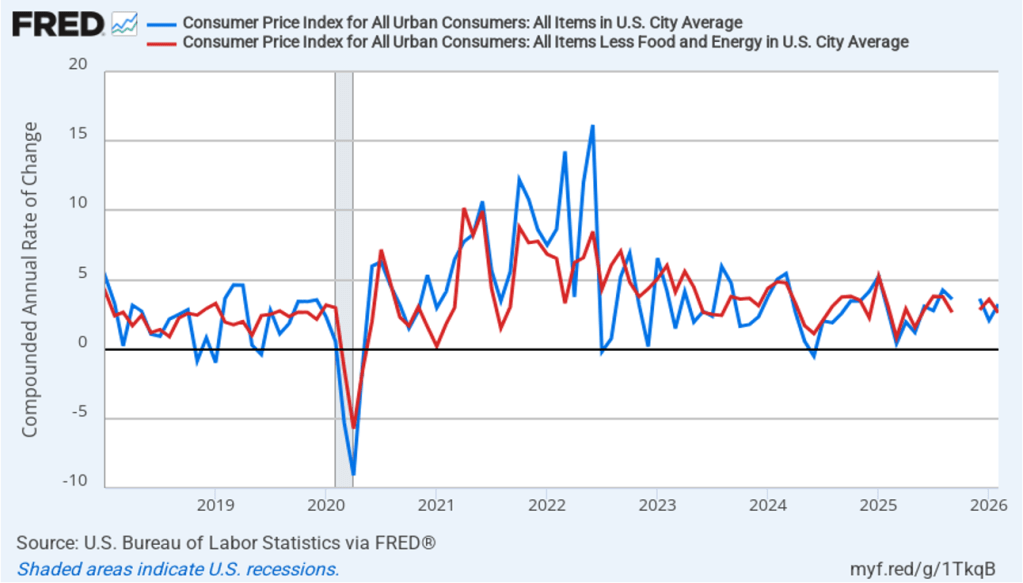
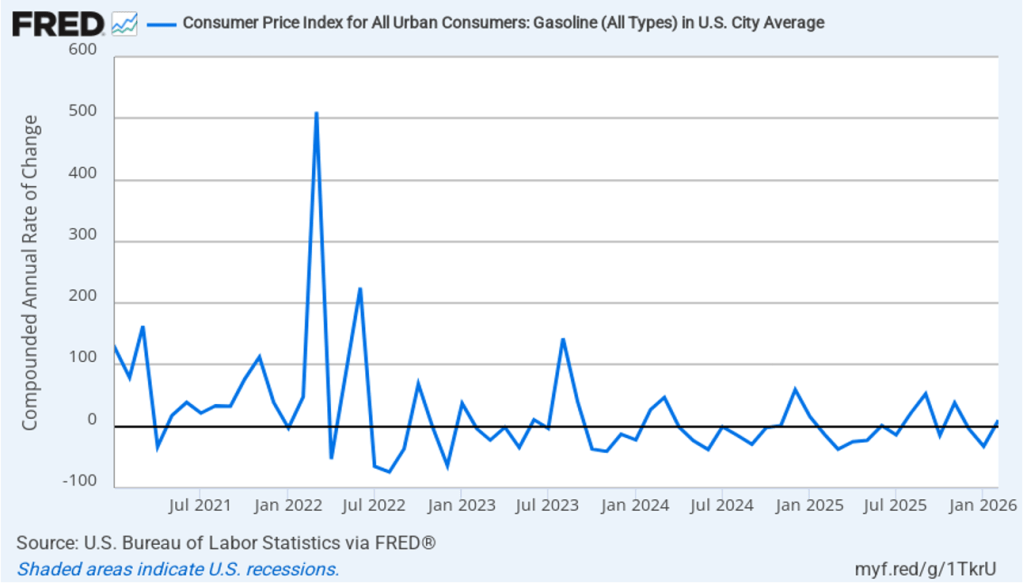
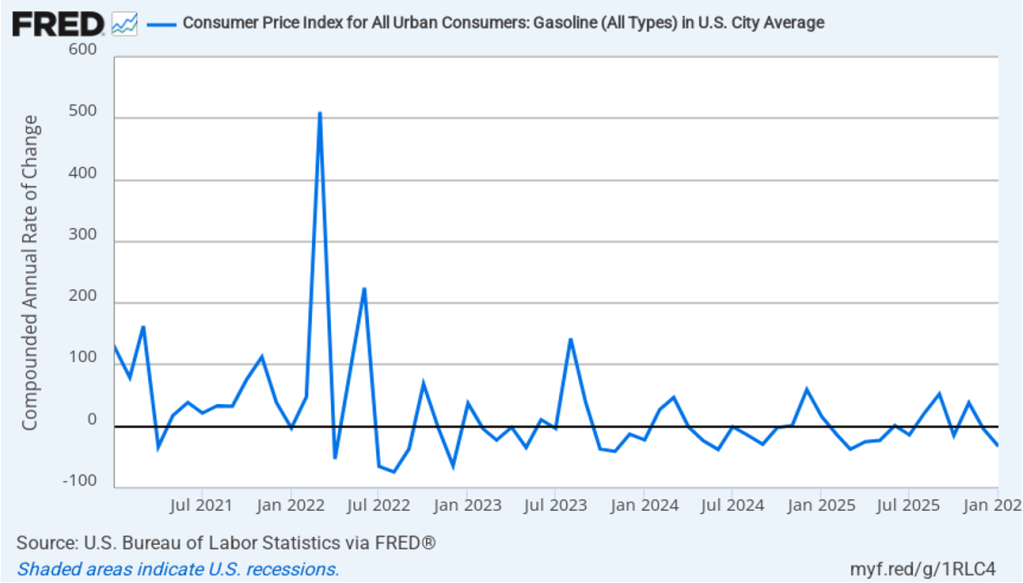
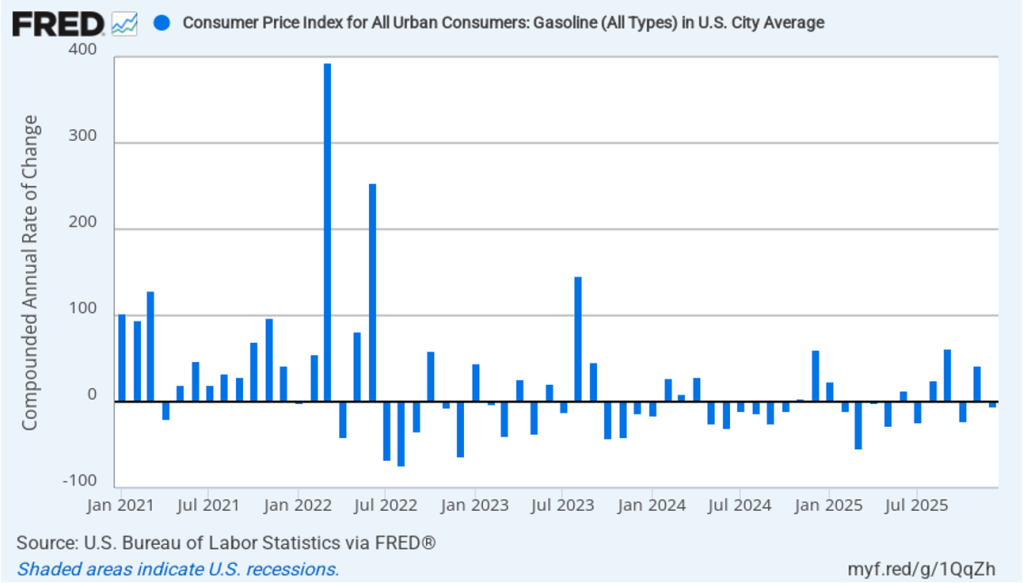
The following figure illustrates the role played by energy prices in causing the large swings in the monthly inflation rate since the conflict in Iran began at the end of February. The red line shows the 1-month inflation rate in all energy prices included in the CPI. Inflation in energy prices, which had increased at annual rate of 245 percent in March, fell at annual rate of 50.6 percent in June. The blue line shows the 1-month inflation rate in gasoline prices, which in March had spiked to more than 900 percent measured at an annual rate, fell at an annual rate of 70.6 percent in June. The recent escalation in the conflict in Iran has increased oil prices, which will likely lead to an increase in the inflation rate in July.

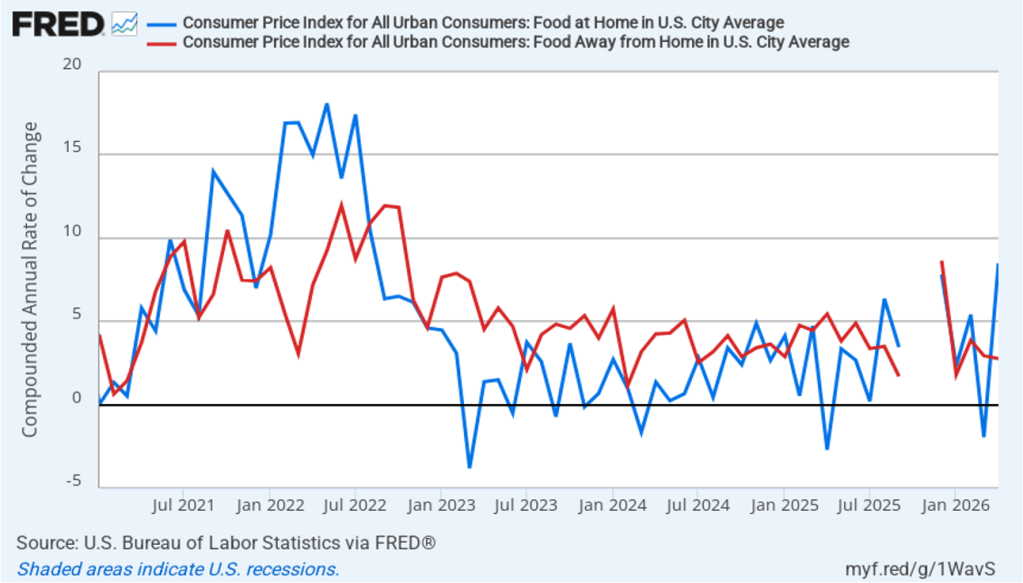
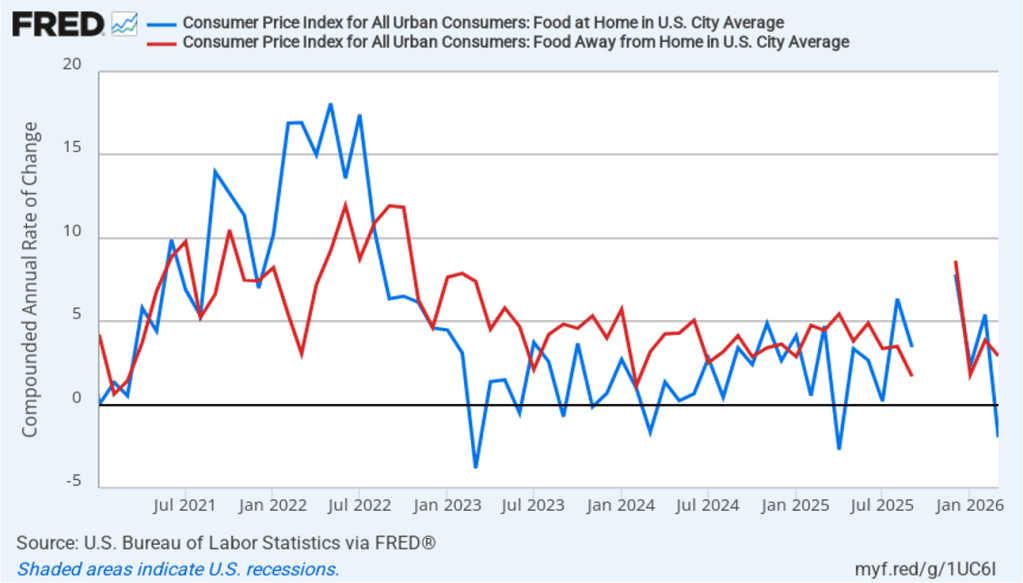
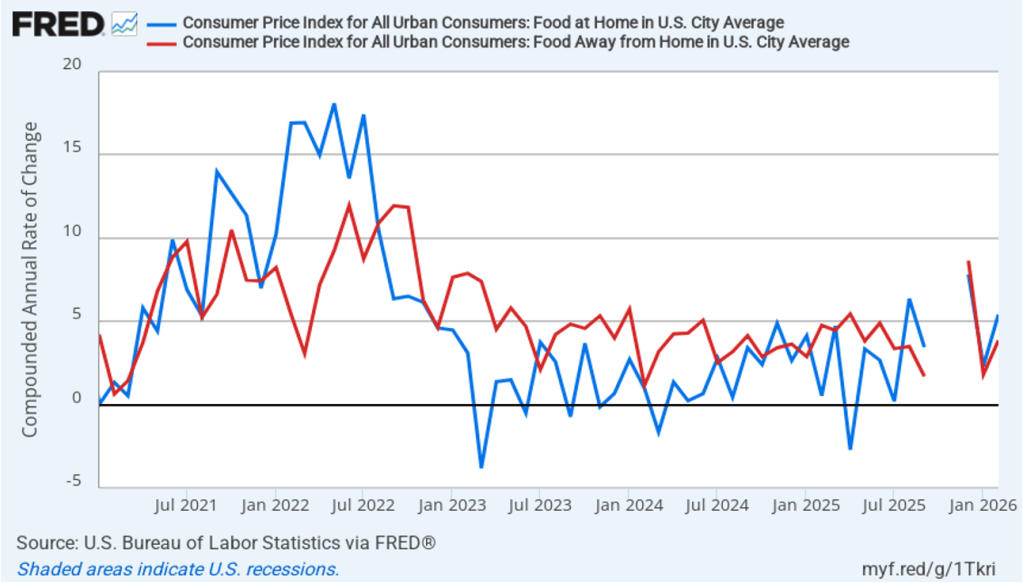
There has been a fear that the rise in energy prices that began in March would pass through to increases in food prices, which are a key concern for many consumers. The following figure shows 1-month inflation in the CPI category “food at home” (the blue bar)—primarily food purchased at grocery stores—and the category “food away from home” (the red bar)—primarily food purchased at restaurants. Inflation in grocery prices increased from 0.8 percent in May to a still fairly low 2.3 percent in June. Inflation in food prices away from home fell from 3.7 percent in May to 2.8 percent in June. To this point, increases in energy priced do not seem to have had much effect on grocery prices or on restaurant prices.

The unexpectedly large decline in inflation in today’s report has likely reduced the chance that Federal Reserve policymakers will increase their target for the federal funds rate at the next meeting of the Federal Open Market Committee (FOMC) on July 28–29. In trading in the federal funds futures market this morning, investors assigned a 83.4 percent probability to the FOMC keeping its target unchanged, which was up sharply from a 58.3 probability yesterday. Traders assign a 61.3 percent probability to the committee increasing its target at its September 15–16 meeting, down from 75.1 percent yesterday.
In testimony before Congress today after the CPI report was released, Fed Chair Kevin Warsh cautioned that good news in a single month’s inflation report should be treated with caution: “There might be some who look at today’s data and say ‘mission accomplished.’ That is not my view.”