More on Hidden Inflation

This yogurt remained the same price although the container shrank from 5.3 ounces to 4.5 ounces.

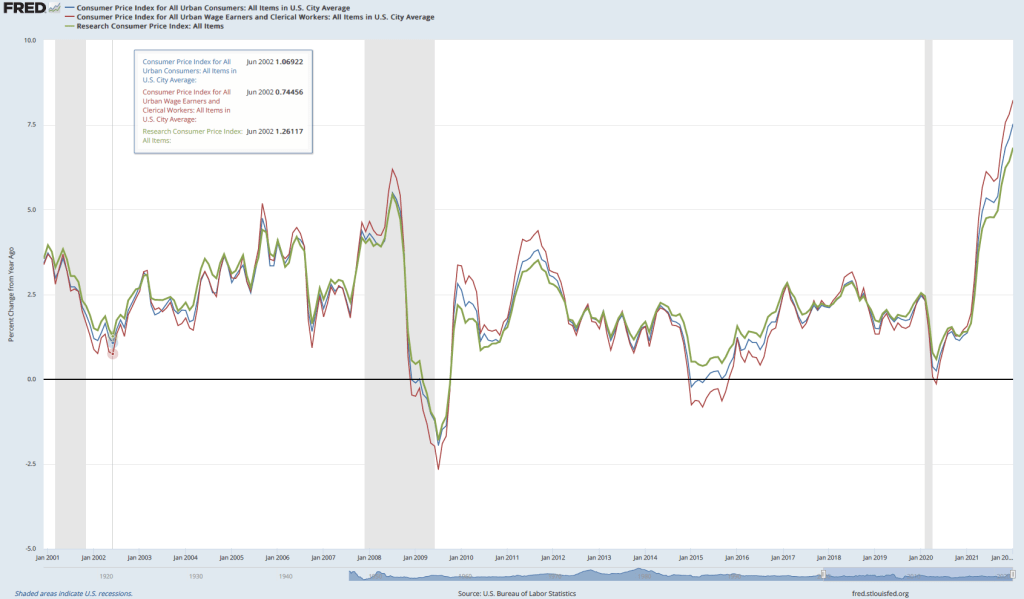
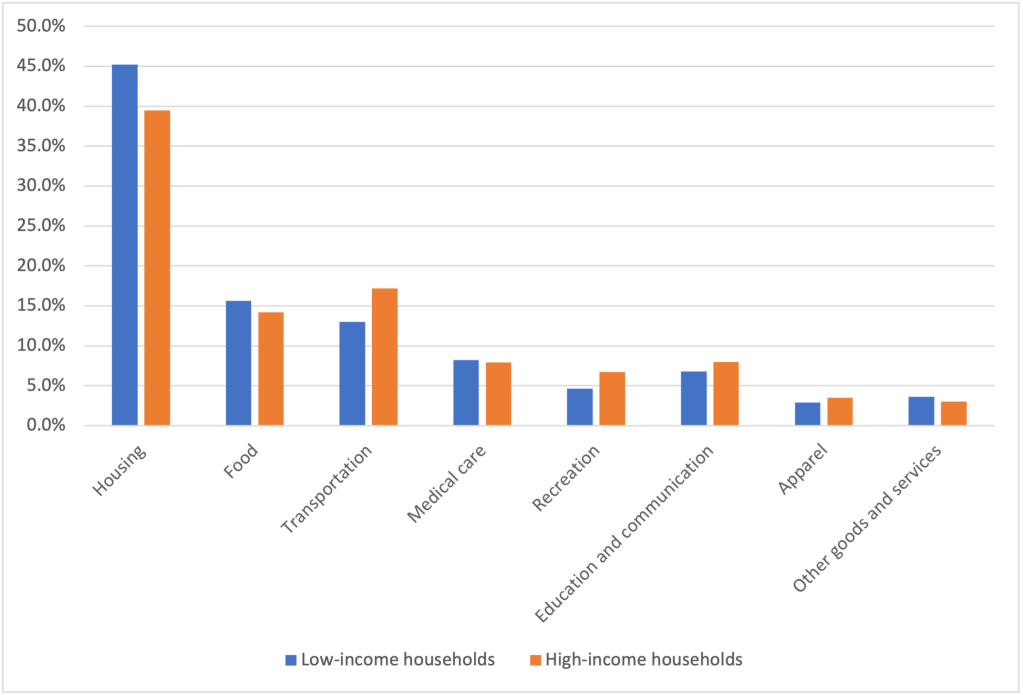
Each month, hundreds of employees of the Bureau of Labor Statistics (BLS) gather data on prices of goods and services from stores in 87 cities and from websites. The BLS constructs the consumer price index (CPI) by giving each price a weight equal to the fraction of a typical family’s budget spent on that good or service. (CPI is discussed in Macroeconomics, Chapter 9, Section 9.4 and in Economics, Chapter 19, Section 19.4.) Ideally, the BLS tracks prices of the same product over time. But sometimes a particular brand and style of shirt, for example, is discontinued. In that case, the BLS will instead use the price of a shirt that is a very close substitute.

A more difficult problem arises when the price of a good increases at the same time that the quality of the good improves. For instance, a new model iPhone may have both a higher price and a better battery than the model it replaces, so the higher price partly reflects the improvement in the quality of the phone. The BLS has long been aware of this problem and has developed statistical techniques that attempt to identify which part of the price increases are due to increases in quality. Economists differ in their views on how successfully the BLS has dealt with this quality bias to the measured inflation rate. Because of this bias in constructing the CPI, it’s possible that the published values of inflation may overstate the actual annual rate of inflation by 0.5 percentage point. For instance, the BLS might report an inflation rate of 3.5 percent when the actual inflation rate—if the BLS could determine it—was 4.0 percent.
As the inflation rate increased beginning in the spring of 2021, a number of observers pointed to hidden inflation that was occurring. There were two main types of hidden inflation:

  1. The quality of some services was declining
  2. Some packaged goods contained smaller quantities at the same price

Here’s one example of the deteriorating quality of some services. Because during 2021 and 2022 many restaurants were having difficulty hiring servers, it was often taking longer for customers to have their orders taken and to have their food brought to the table. Because restaurants were also having difficulty hiring enough cooks, they also limited the items available on their menus. In other words, the service these restaurants were offering was not as good as it had been prior to the pandemic. So even if the restaurants kept their prices unchanged, their customers were paying the same price, but receiving less.
Alan Cole, a former senior economist with the Congressional Joint Economic Committee, discussed these other examples on his blog: “hotels clean rooms less frequently on multi-night stays, shipping delays are longer, and phone hold times at airlines are worse.” In a column in the New York Times, economics writer Neil Irwin made similar points: “Complaints have been frequent about the cleanliness of [restaurant] tables, floors and bathrooms.” And: “People trying to buy appliances and other retail goods are waiting longer.”

A column in the Wall Street Journal on business travel by Scott McCartney was headlined “The Incredible Disappearing Hotel Breakfast.” McCartney noted that many hotels continue to advertise free hot breakfasts on their websites and apps but have stopped providing them. He also noted that hotels “have suffered from labor shortages that have made it difficult to supply services such as daily housekeeping or loyalty-group lounges,” in addition to hot breakfasts.
In all of these cases, the actual prices of the services had increased more than had the listed prices because the deterioration in quality meant that people were receiving less for their money.


In addition to deterioration in the quality of services, hidden inflation during this period also took the form of consumers buying some packaged goods in which the quantities had been reduced, although the price was unchanged. For example, in June 2022, an article by the Associated Press noted that:


• “A small box of Kleenex now has 60 tissues; a few months ago, it had 65.”
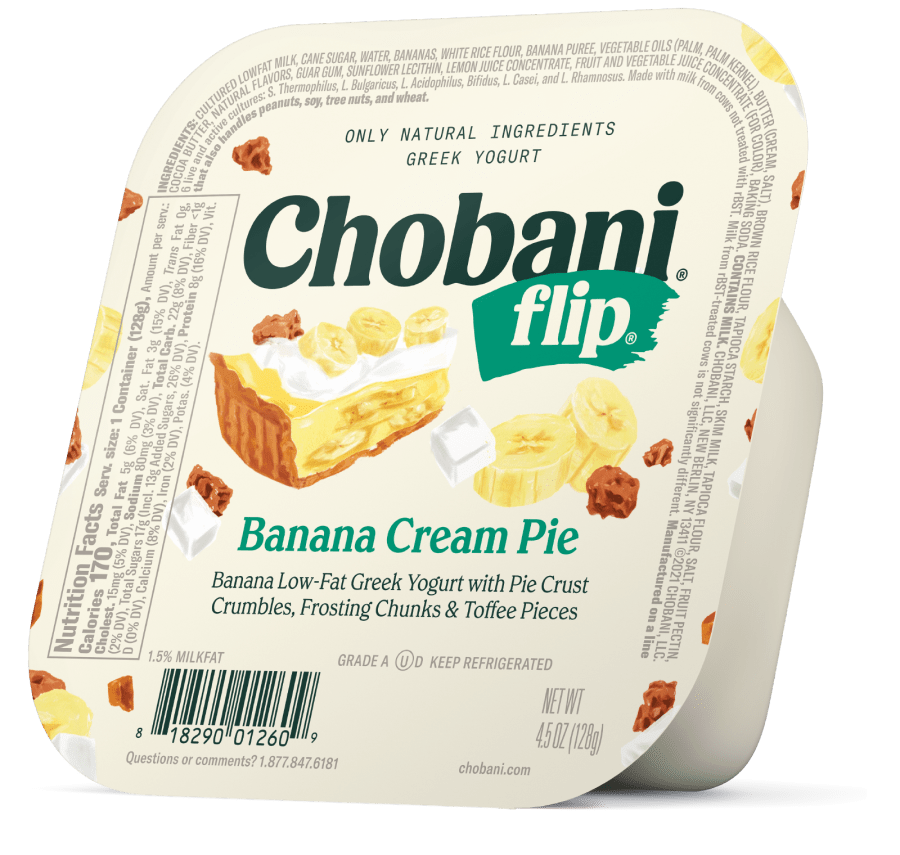
• “Chobani Flips yogurts have shrunk from 5.3 ounces to 4.5 ounces.”
• “Earth’s Best Organic Sunny Days Snack Bars went from eight bars per box to seven, but the price listed at multiple stores remains $3.69.”


An article in the Wall Street Journal observed that: “Shrinkflation, as economists call it, tends to be easier for companies to pass on to consumers. Despite labels that show price by weight, research shows that most customers look at only the overall price.”


The BLS does try to adjust the measurement of the CPI for shrinkflation, which it can do because the BLS keeps careful track of the quantities included in the packaged goods that are included in its survey.


But the BLS makes no attempt to adjust the CPI for the deterioration in the quality of services because doing so would be very difficult. As Irwin observes: “Customer service preferences—particularly how much good service is worth—varies highly among individuals and is hard to quantify. How much extra would you pay for a fast-food hamburger from a restaurant that cleans its restroom more frequently than the place across the street?” And an economist at the BLS noted that, “We do not capture the decrease in service quality associated with cleaning a [hotel] room every two days rather than one.”


As we noted earlier, most economists believe that the failure of the BLS to fully account for improvements in the quality of goods results in changes in the CPI overstating the true inflation rate. This bias may have been more than offset during 2021–2022 by deterioration in the quality of services resulting in the CPI understating the true inflation rate. As the dislocations caused by the pandemic gradually resolve themselves, it seems likely that the deterioration in services will be reversed. But it’s possible that the deterioration in the provision of some services may persist. Fortunately, unless the deterioration increases over time, it would not continue to distort the measurement of the inflation rate because the same lower level of service would be included in every period’s prices.


Sources: Dee-Ann Durbin, “No, You’re Not Imagining It—Package Sizes Are Shrinking,” apnews.com, June 8, 2022; Annie Gasparro and Gabriel T. Rubin, “The Hidden Ways Companies Raise Prices,” Wall Street Journal, February 12, 2022; Alan Cole, “How I Reluctantly Became an Inflation Crank,” fullstackeconomics.com, September 8, 2021; Scott McCartney, “The Incredible Disappearing Hotel Breakfast—and Other Amenities Travelers Miss,” Wall Street Journal, October 20, 2021; and Neil Irwin, “There Is Shadow Inflation Taking Place All Around Us,” New York Times, October 14, 2021.

A Day in the Life of a Price Checker for the Bureau of Labor Statistics

Emily Mascitis checks prices at an auto-repair shop in Philadelphia. (Photo from the Wall Street Journal.)

As we discuss in Macroeconomics, Chapter 9, Section 9.4, (Economics, Chapter 19, Section 19.4) in calculating the consumer price index (CPI) each month, the Bureau of Labor Statistics sends hundreds of employees to gather price data from stores and offices. A reporter for the Wall Street Journal followed a price checker as she visited an auto-repair shop, a grocery store, and other businesses.

The article provides an excellent discussion of the care with which prices are collected, particularly with respect to making sure that the prices are for the same good or service each month. For instance, while in a grocery, the price checker almost made the mistake of recording the price of a can of low sodium chicken noodle soup, rather than the price of regular chicken noodle soup as in previous months.

At one point, the price checker noted that the price of clementines had been increasing rapidly and remarked that when buying fruit for her own family “We need to pick a less expensive fruit.” Switching from buying a fruit, in this case clementines, with a price that is increasing rapidly to a fruit with a price that is increasing more slowly, say regular oranges, is an example of the substitution bias. That’s one of the four biases discussed in Section 9.4 that can cause the measured increase in the CPI to overstate the true rate of inflation.

The article can be found here. (A subscription may be required.)

Source: Rachel Wolfe, “How the Inflation Rate Is Measured: 477 Government Workers at Grocery Stores,” Wall Street Journal, May 10, 2022.

Does Inflation Affect Lower-Income People More than Higher-Income People?

There’s a consensus among economists that increases in unemployment during a recession typically are larger for lower-income people than for higher-income people. Lower-income people are more likely to hold jobs requiring fewer skills and firms typically expect that when they lay off less-skilled workers during a recession they will be able to higher them—or other workers with similar skills—back after the recession ends. Because higher income have skills that may be difficult to replace, firms are more reluctant to lay them off. 

For instance, in an earlier blog post (found here) we noted that during the period in 2020 when many restaurants were closed, the Cheesecake Factory continued to pay its 3,000 managers while it laid off most of its servers. That strategy made it easier for the restaurant chain to more easily expand its operations when the worst of government-ordered closures were over. More generally, Serdar Birinci and YiLi Chien of the Federal Reserve Bank of St. Louis found that workers in the lowest 20 percent (or quintile) of earnings experienced an increased unemployment rate from 4.4 percent in January 2020 to 23.4 percent in April 2020, whereas workers in the highest quintile of earnings experienced an increase only from 1.1 percent in January to 4.8 percent in April.

If lower-income people are hit harder by unemployment, are they also hit harder by inflation? Answering that question is difficult because the U.S. Bureau of Labor Statistics (BLS) doesn’t routinely release data on inflation in the prices of goods and services purchased by households at different income levels.  The main measure of consumer price inflation compiled by the BLS represents changes in the consumer price index (CPI). The CPI is an index of the prices in a market basket of goods and services purchased by households living in urban areas. The information on consumer purchases comes from interviews the BLS conducts every three months with a sample of consumers and from weekly diaries in which a sample of consumers report their purchases. (We discuss the CPI in Macroeconomics, Chapter 9,  Section 9.4 and in Economics, Chapter 19, Section 19.4.)

The BLS releases three measures of the CPI, the two most widely used of which are the CPI-U for all urban consumers and CPI-W for urban wage earners. CPI-W covers the subset of households that receive at least half their household income from clerical or wage occupations and who have at least one wage earner who worked for 37 weeks or more during the previous year. CPI-U represents about 93 percent of the U.S. population and CPI-W represents about 29 percent of the U.S. population. Finally, in 1988 Congress instructed the BLS to compile a consumer price index reflecting the purchases of people aged 62 and older. This version of the CPI is labeled R-CPI-E; the R indicates that it is a research series and the E indicates that it is intended to measure the prices of goods and services purchased by elderly people. Because the sample used to calculate the R-CPI-E is relatively small and because of some other difficulties that may reduce the accuracy of the index, the BLS considers it a series best suited for research and does not include the data in its monthly “Consumer Price Index” publication. In any event, as the following figure shows, inflation, measured as the percentage change in the CPI from the same month in the previous year, has been very similar for all three measures of the CPI.

Because the market baskets of goods and services consumed by a mix of high and low-income households is included in all three versions of the CPI, none of the versions provides a way to measure the possibly different effects of inflation on low-income and on high-income households. A study by Josh Klick and Anya Stockburger of the BLS attempts to fill this gap by constructing measures of the CPI for low-income and for high-income households. They define low-income households as those in the bottom 25 percent (quartile) of the income distribution and high-income households as those in the top quartile of the income distribution. During the time period of their analysis—December 2003 to December 2018—the bottom quartile had average annual incomes of $12,705 and the top quartile had average annual incomes of $155,045.

The BLS researchers constructed market baskets for the two groups. The expenditure weights—representing the mix of products purchased—don’t differ too strikingly between lower-income and higher-income households, as the figure below shows. The largest differences are housing, with low-income households having a market basket weight of 45.2 percent and high-income households having a market basket weight of 39.5 percent, and transportation, with low-income households having a market basket weight of 13.0 percent and high-income households having a market basket weight of 17.2 percent.

The following table shows the inflation rate as measured by changes in different versions of the CPI over the period from December 2003 to December 2018. During this period, the CPI-U (the version of the CPI that is most frequently quoted in news stories) increased at an annual rate of 2.1 percent, which was the same rate as the CPI-W. The R-CPI-E increased at a slightly faster rate of 2.2 percent. Lower-income households experienced the highest inflation rate at 2.3 percent and higher-income households experienced the lowest inflation rate of 2.0 percent.  

CPI-UCPI-WR-CPI-ECPI for lowest income quartileCPI for highest income quartile
2.1%2.2%2.1%2.3%2.0%

The differences in inflation rates across groups were fairly small. Can we conclude that the same was true during the recent period of much higher inflation rates? We won’t know with certainty until the BLS extends its analysis to cover at least the years 2021 and 2022. But we can make a couple of relevant observations. First, for many people the most important aspect of inflation is whether prices are increasing faster of slower than their wages. In other words, people are interested in what is happening to their real wage. (We discuss calculating real wage rates in Macroeconomics, Chapter 9, Section 9.5 and in Economics, Chapter 19, Section 19.5.)

The Federal Reserve Bank of Atlanta compiles data on wage growth, including wage growth by workers in different income quartiles. The following figure shows that workers in the top quartile have experienced more rapid wage growth in the months since the beginning of the Covid-19 pandemic than have workers in the other quartiles. This gap continues a trend that began in 2015. The bottom quartile has experienced the slowest rate of income growth. (Note that the researchers at the Atlanta Fed compute wage growth as a 12-month moving average rather than as the percentage from the same month in the previous year, as we have been doing when calculating inflation using the CPI.) For example, in January 2022, calculated this way, average wage growth in the top quartile was 5.8 percent as opposed to 2.9 percent in the bottom quartile.

As with any average, there is some variation in the experiences of different individuals. Although, as a group, lower-income workers have seen wage growth that lags behind other workers, in some industries that employ many lower-income people, wage growth has been strong. For instance, as measured by average hourly earnings, wages for all workers in the private sector increased by 5.7 percent between January 2021 and 2022. But average hourly earnings in the leisure and hospitality industry—which employs many lower-income workers—increased by 13.0 percent.

Overall, it seems likely that the real wages of higher-income workers have been increasing while the real wages of lower-income workers have been decreasing, although the experience of individual workers in both groups may be very different than the average experience. 

Sources: Josh Klick and Anya Stockburger, “Experimental CPI for Lower and Higher Income Households Serdar,” U.S. Bureau of Labor Statistics, Working Paper 537, March 8, 2021; Birinci and YiLi Chien, “An Uneven Crisis for Lower-Income Households,” Federal Reserve Bank of St. Louis, Annual Report 2020, April 7, 2021; and Federal Reserve Bank of Atlanta, “Wage Growth Tracker,” https://www.atlantafed.org/chcs/wage-growth-tracker.

The Pandemic and Hidden Inflation

If the price of your meal is the same, but the service is slow and the menu is limited you have experienced hidden inflation.

Each month, hundreds of employees of the Bureau of Labor Statistics gather data on prices of goods and services from stores in 87 cities and from websites. The BLS constructs the consumer price index (CPI) by giving each price a weight equal to the fraction of a typical family’s budget spent on that good or service. (We discuss the construction of the CPI in Chapter 9, Section 9.4 of Macroeconomics and Chapter 19, Section 19.4 of Economics.) Ideally, the BLS tracks prices of the same product over time. But sometimes a particular brand and style of shirt, for example, is discontinued. In that case, the BLS will use instead the price of a shirt that is a very close substitute.

A more difficult problem arises when the price of a good increases at the same time that the quality of the good improves. For instance, a new model iPhone may have both a higher price and a better battery than the model it replaces, so the higher price partly reflects the improvement in the quality of the phone.  The BLS has long been aware of this problem and has developed statistical techniques that attempt to identify that part of price increases that are due to increases in quality. Economists differ in their views on how successfully the BLS has dealt with this quality bias to the measured inflation rate. Because of this bias in constructing the CPI, it’s possible that the published values of inflation may overstate the actual annual rate of inflation by 0.5 percentage point. So, for instance, the BLS might report an inflation rate of 3.5 percent when the actual inflation rate—if the BLS could determine it—was 4.0 percent.

During 2021, a number of observers pointed to a hidden type of inflation occurring, particularly in some service industries. For example, because many restaurants were having difficulty hiring servers, it was often taking longer for customers to have their orders taken and to have their food brought to the table.  Because restaurants were also having difficulty hiring enough cooks, they also limited the items available on their menus. In other words, the service these restaurants were offering was not as good as it had been prior to the pandemic. So even if the restaurants kept their prices unchanged, their customers were paying the same price but receiving less. 

Alan Cole, who was formerly a senior economist with the Congressional Joint Economic Committee, noted on his blog that “goods and services are getting worse faster than the official statistics acknowledge, suggesting that our inflation problem has actually been bigger than the official statistics suggest.” As examples, he noted that “hotels clean rooms less frequently on multi-night stays,” “shipping delays are longer, and phone hold times at airlines are worse.” In a column in the New York Times, economics writer Neil Irwin made similar points: “Complaints have been frequent about the cleanliness of [restaurant] tables, floors and bathrooms.”  And: “People trying to buy appliances and other retail goods are waiting longer.”

A column in the Wall Street Journal on business travel by Scott McCartney was headlined “The Incredible Disappearing Hotel Breakfast.” McCartney noted that many hotels continue to advertise free hot breakfasts on their websites and apps but have stopped providing them. He also noted that hotels “have suffered from labor shortages that have made it difficult to supply services such as daily housekeeping or loyalty-group lounges,” in addition to hot breakfasts.

The BLS makes no attempt to adjust the CPI for these types of deterioration in the quality of services because doing so would be very difficult. As Irwin notes: “Customer service preferences—particularly how much good service is worth—varies highly among individuals and is hard to quantify. How much extra would you pay for a fast-food hamburger from a restaurant that cleans its restroom more frequently than the place across the street?”

As we noted earlier, most economists believe that the failure of the BLS to fully account for improvements in the quality of goods results in changes in the CPI overstating the true inflation rate.  This bias may have been more than offset since the beginning of the pandemic by deterioration in the quality of services resulting in the CPI understating the true inflation rate. As the dislocations caused by the pandemic gradually resolve themselves, it seems likely that the deterioration in services will be reversed. But it’s possible that the deterioration in the provision of some services may persist. Fortunately, unless the deterioration increases over time, it would not continue to distort the measurement of the inflation rate because the same lower level of service would be included in every period’s prices.

Sources: Alan Cole, “How I Reluctantly Became an Inflation Crank,” fullstackeconomics.com, September 8, 2021; Scott McCartney, “The Incredible Disappearing Hotel Breakfast—and Other Amenities Travelers Miss,” wsj.com, October 20, 2021; and Neil Irwin, “There Is Shadow Inflation Taking Place All Around Us,” nytimes.com, October 14, 2021.