Image generated by ChatGPT
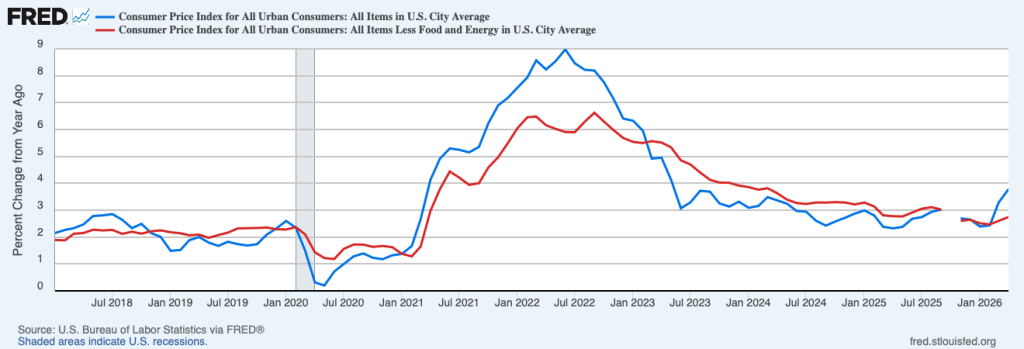
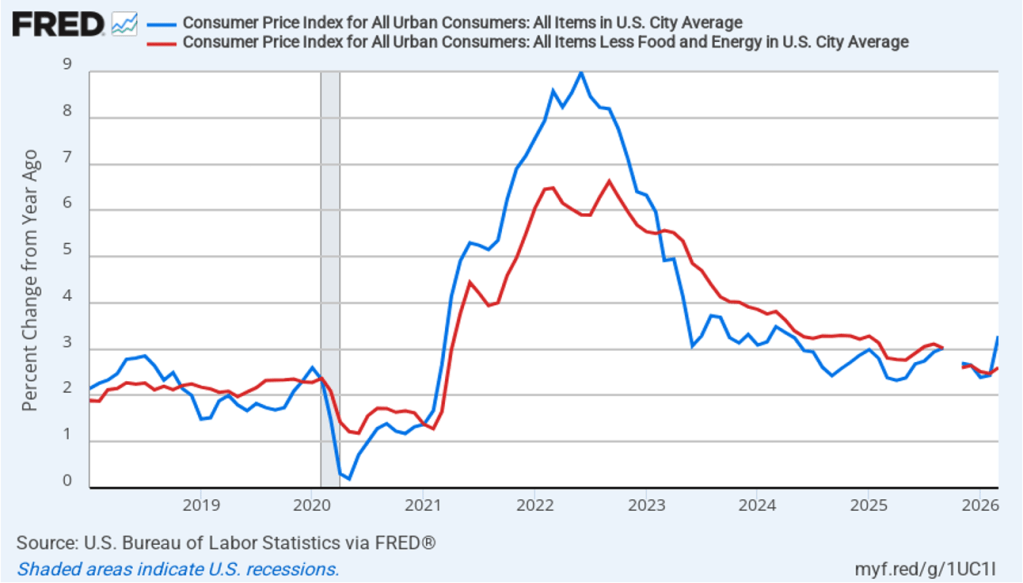
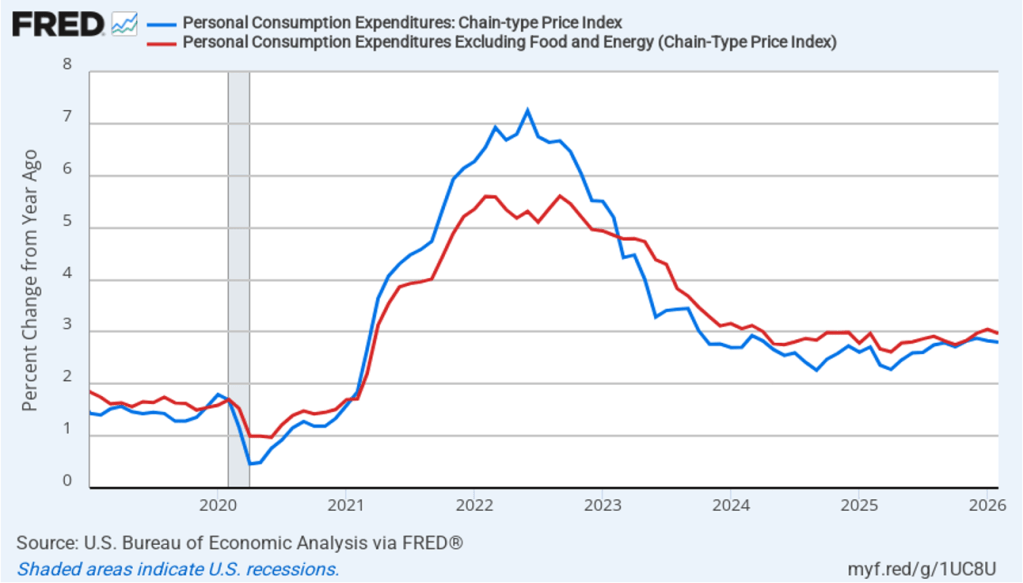
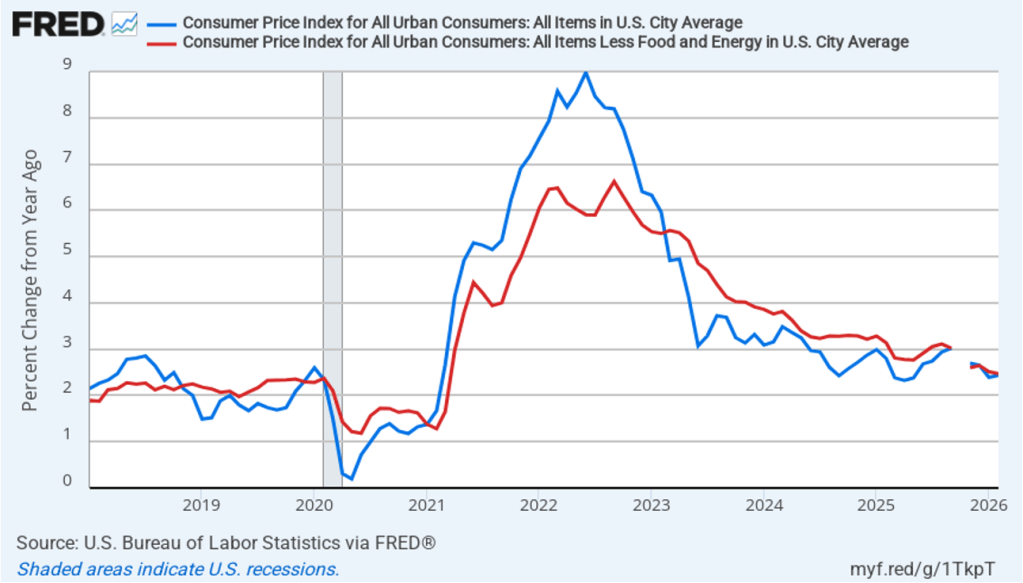
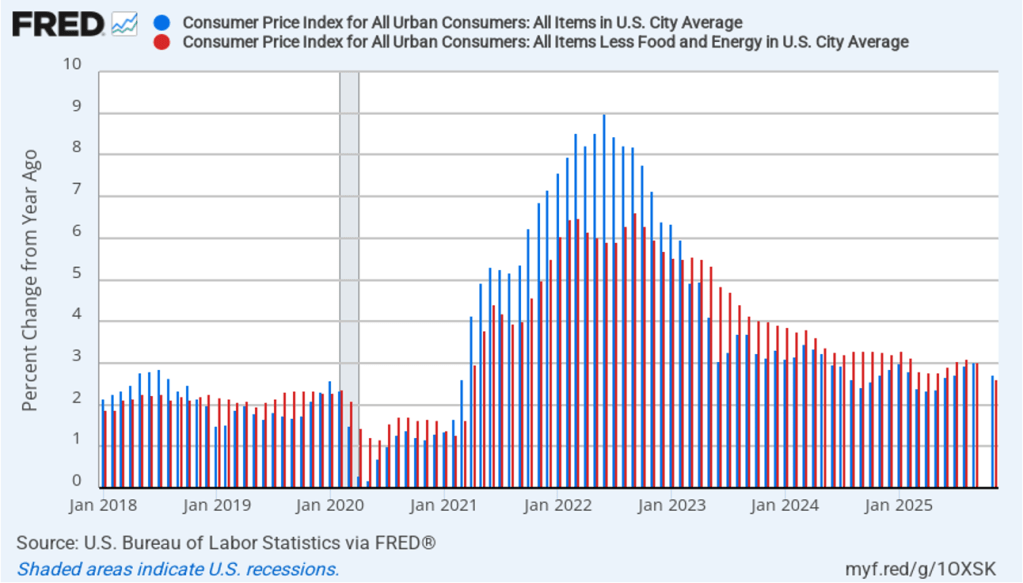
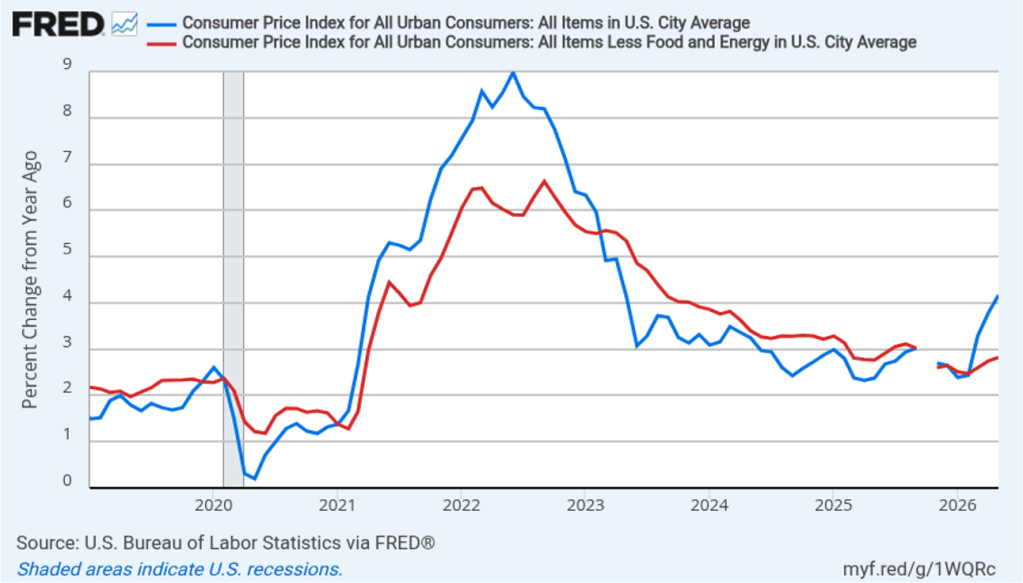
Today (June 10), the Bureau of Labor Statistics (BLS) released its report on the consumer price index (CPI) for May. As expected, higher energy prices caused by the conflict in Iran have continued to result in high rates of inflation. The following figure compares headline CPI inflation (the blue line) and core CPI inflation (the red line).
- The headline inflation rate, which is measured by the percentage change in the CPI from the same month in the previous year, was 4.2 percent in May, up from 3.8 in April. This was the highest inflation rate since April 2023.
- The core inflation rate, which excludes the prices of food and energy, ticked up only slightly to 2.8 percent in May from 2.7 percent in April.
Headline inflation was equal to and core inflation was slightly lower than economists surveyed by FactSet had forecast. (Note that because of last year’s federal government shutdown, inflation data for October and November 2025 are not available.)
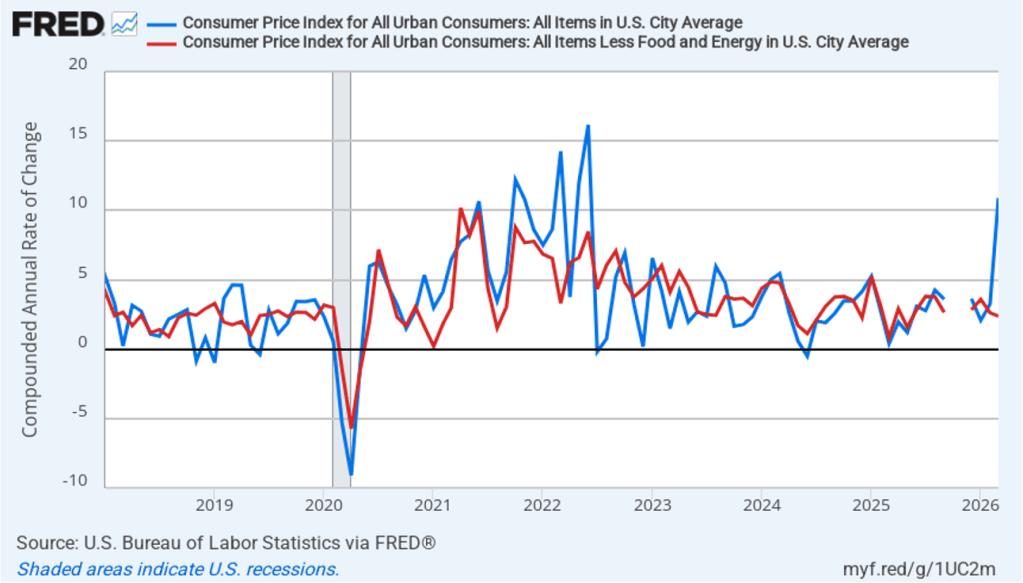
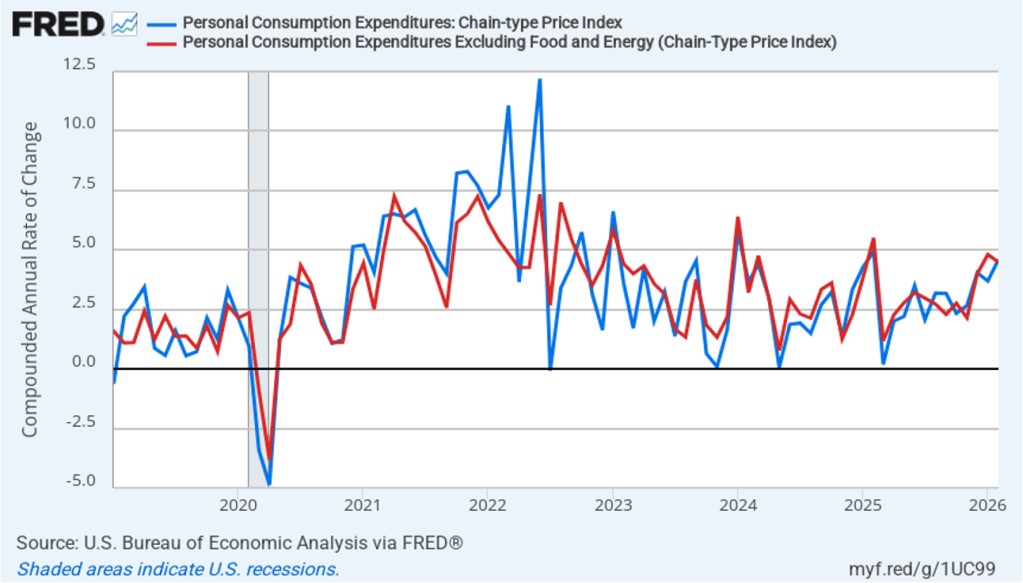
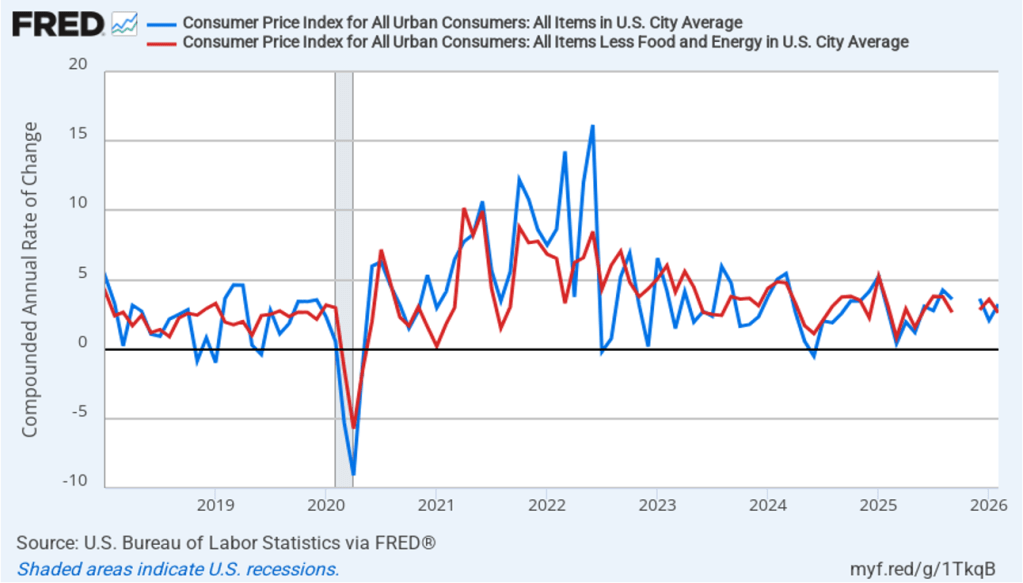
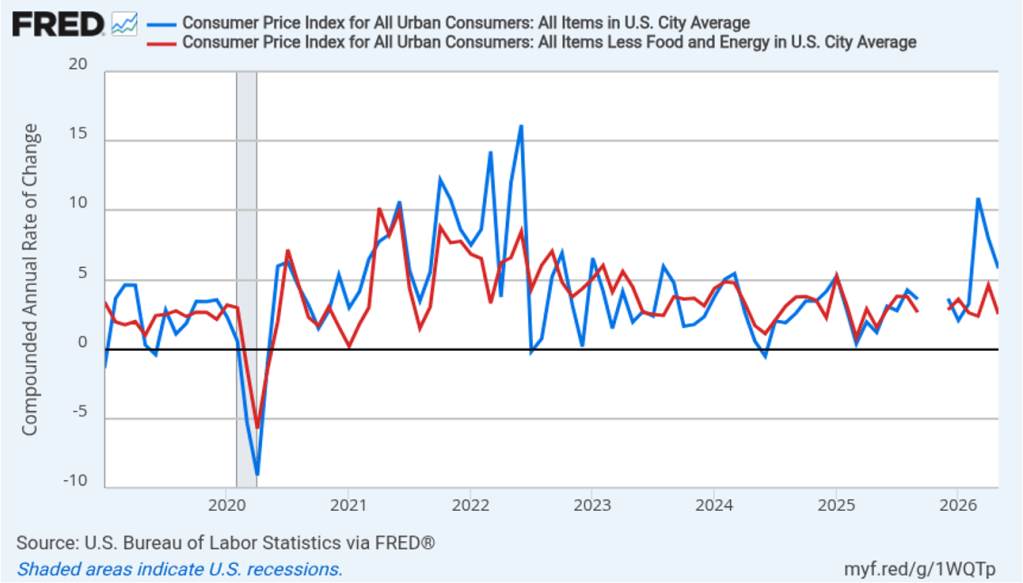
In the following figure, we look at the 1-month inflation rate for headline and core inflation—that is the annual inflation rate calculated by compounding the current month’s rate over an entire year. Calculated as the 1-month inflation rate, headline inflation (the blue line) was high at 5.8 percent in May, but down from a very high 8.0 percent in April and 10.9 percent in March. Core inflation (the red line) was 2.5 percent in May, down significantly from 4.6 percent in April.
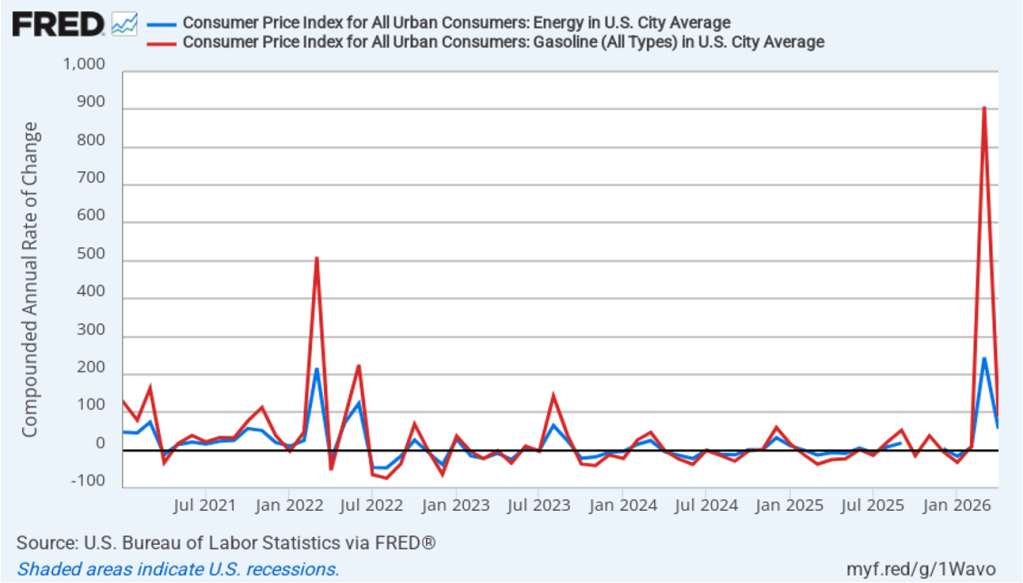
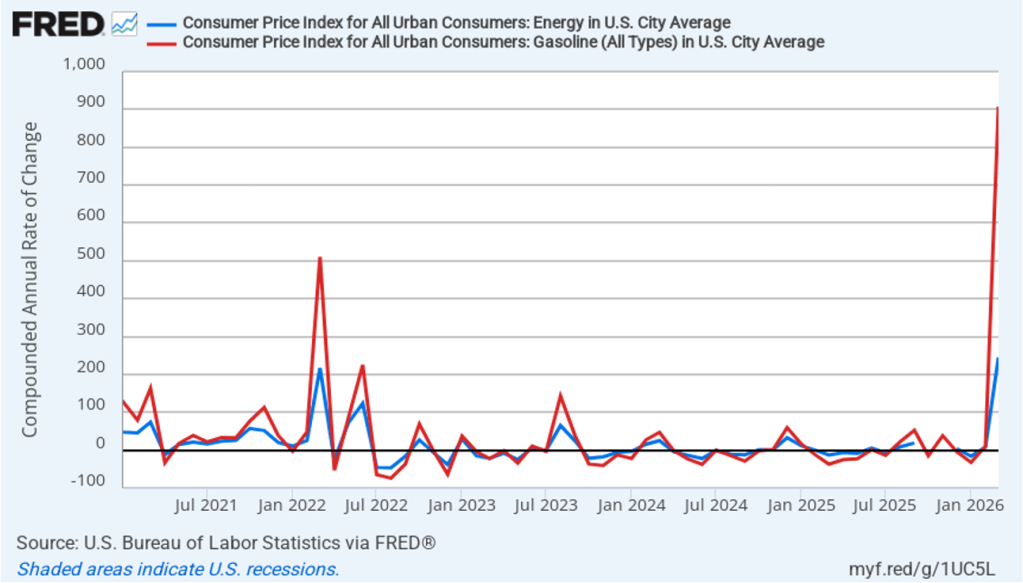
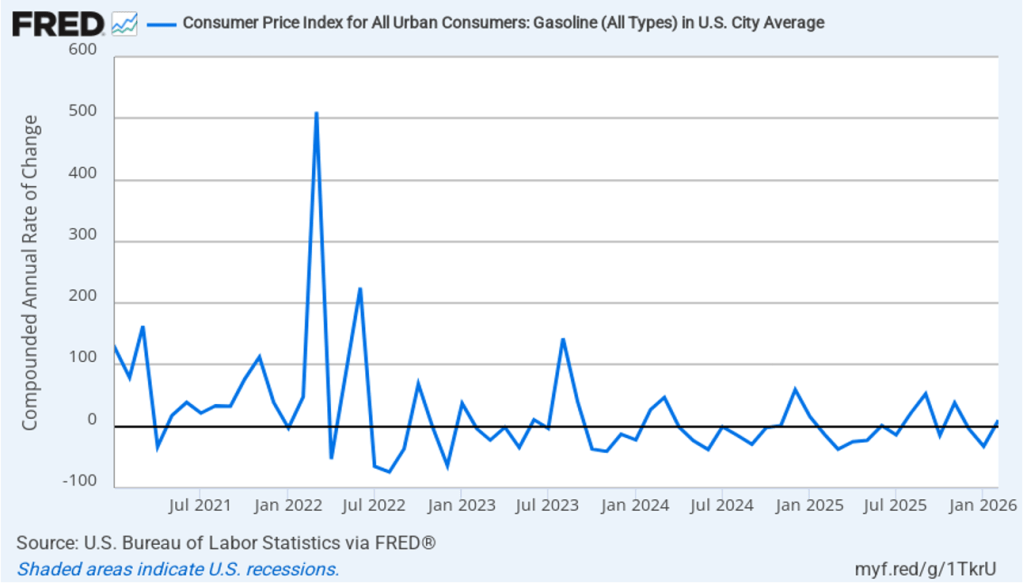
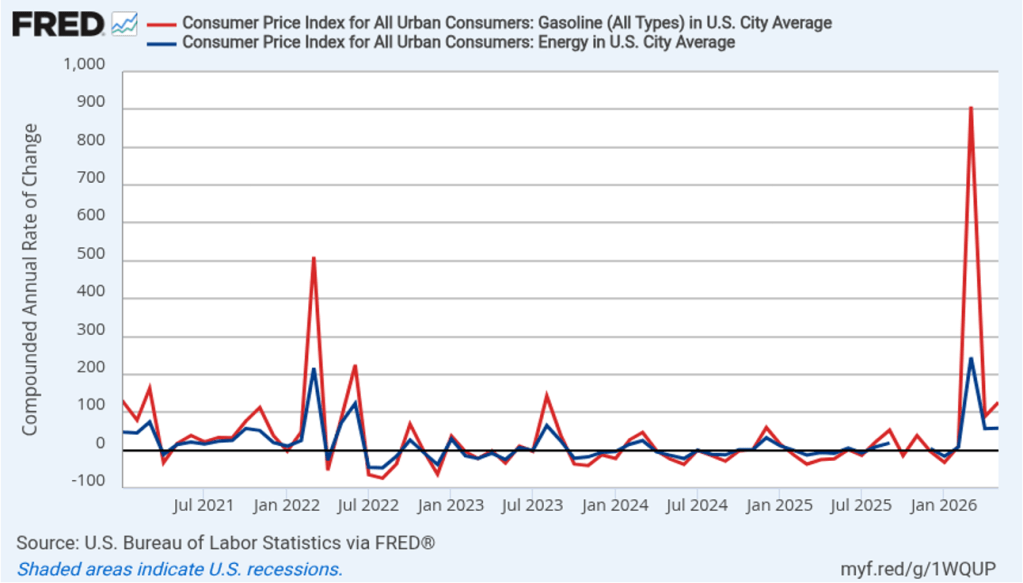
The following figure emphasizes the role played by energy prices in causing the jump in inflation. The blue line shows the 1-month inflation rate in all energy prices included in the CPI. Inflation in energy prices increased from a very high 56.6 percent in April to a slightly higher 58.8 percent in May. The red line shows the 1-month inflation rate in gasoline prices, which rose from a very high 88.8 percent in April to an even higher 126.4 percent in May.
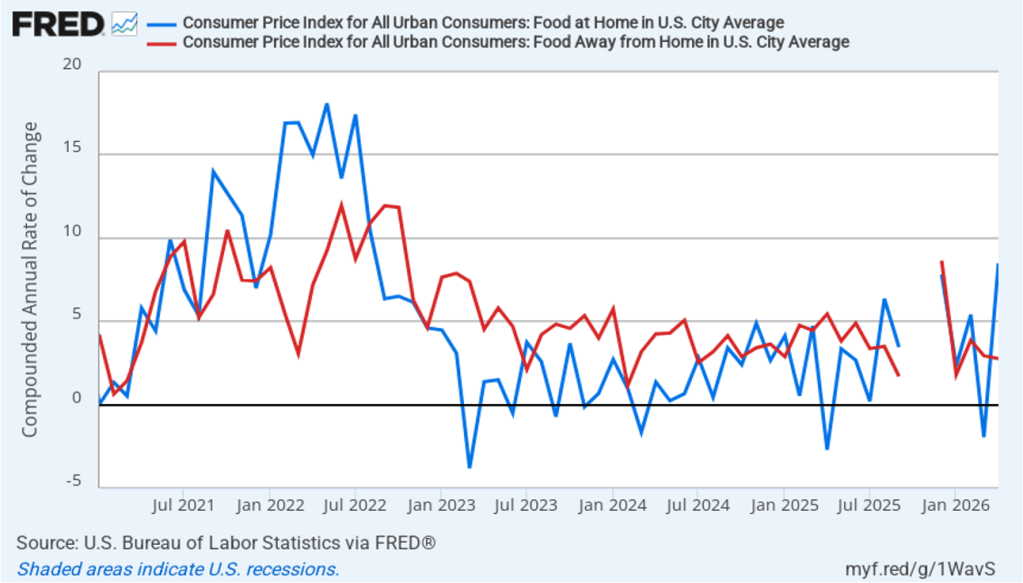
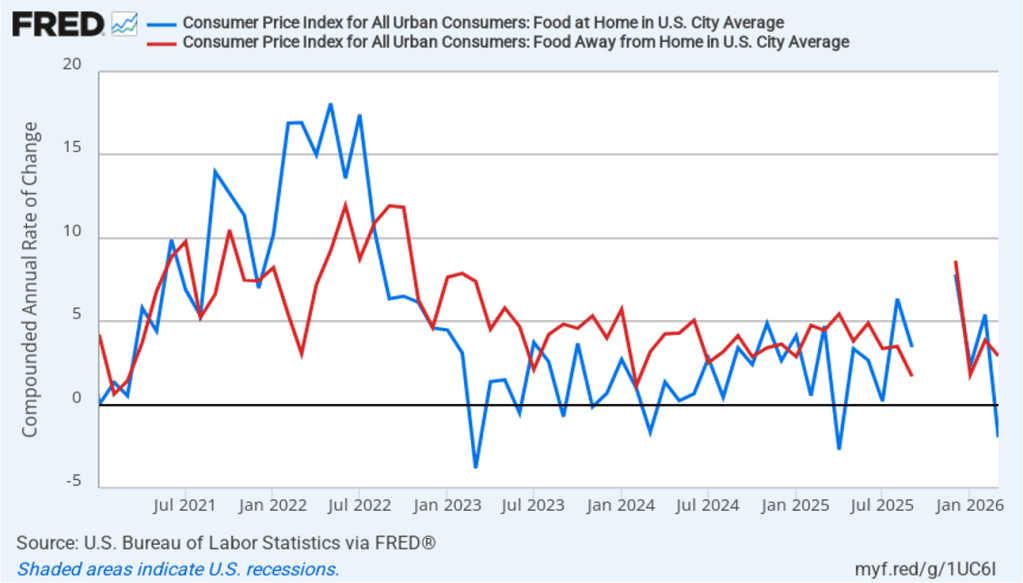
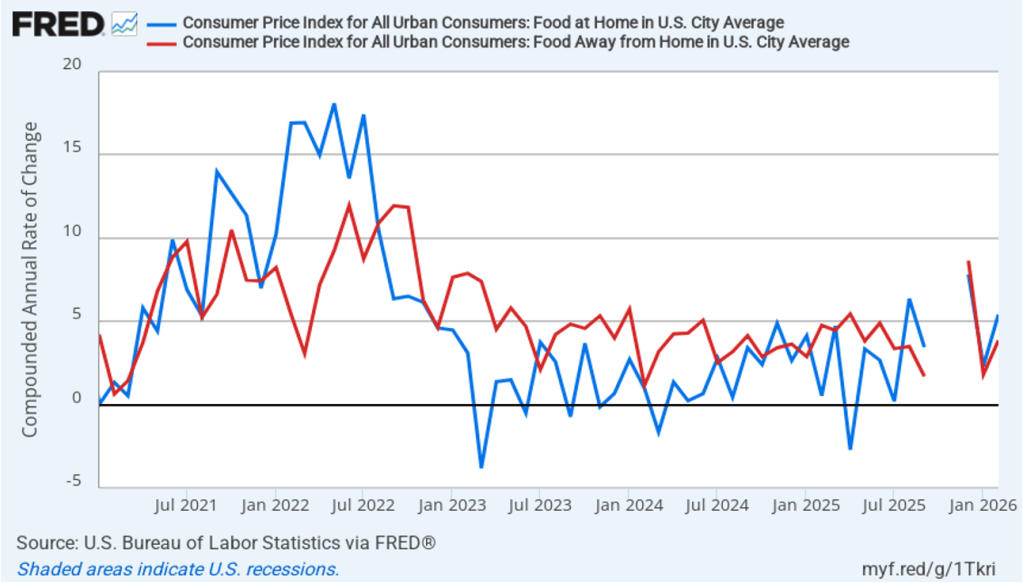
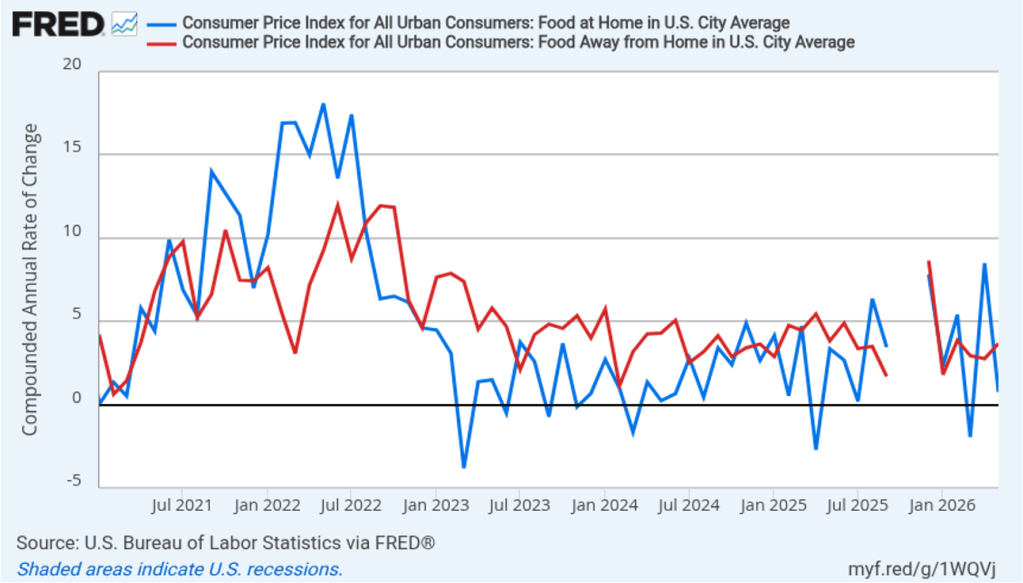
Did the jump in energy prices pass through to increases in food prices, which are a key concern for many consumers? The following figure shows 1-month inflation in the CPI category “food at home” (the blue bar)—primarily food purchased at grocery stores—and the category “food away from home” (the red bar)—primarily food purchased at restaurants. Inflation in grocery prices slowed markedly to 0.8 percent in May from 8.5 percent in April. Inflation in food prices away from home was 3.7 percent in May, up from 2.8 percent in April. April’s very high rate of increase in grocery prices was due to rising energy prices, but also to sharp increases in beef and fruit and vegetable prices, which had risen for reasons largely unrelated to higher energy costs. Consumers enjoyed some relief in May from the sharp decrease in the rate of increase in grocery prices.
This inflation report is unlikely to have much effect on Fed policymakers as they prepare for the next meeting of the Federal Open Market Committee (FOMC) on June 16–17—Kevin Warsh’s first meeting as Fed chair. Persistently high inflation rates combined with relatively strong data on economic growth and employment make it more likely that the FOMC will increase, rather than cut, its target for the federal funds rate later in the year.
At this point, trading in the federal funds futures market indicates that investors believe that its unlikely that the committee will raise or lower its target for the federal funds rate at its June, July, or September meetings. This morning, investors assigned a 48.6 percent probability of the FOMC raising its target for the federal funds rate at its October 27–28 meeting and a 66.2 percent of doing so at its meeting on December 8–9.