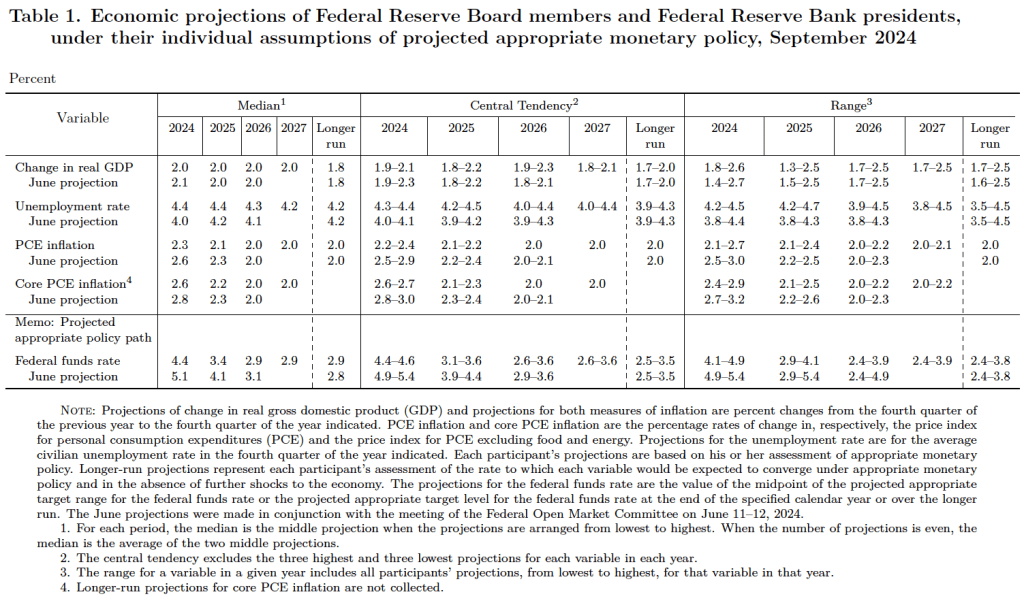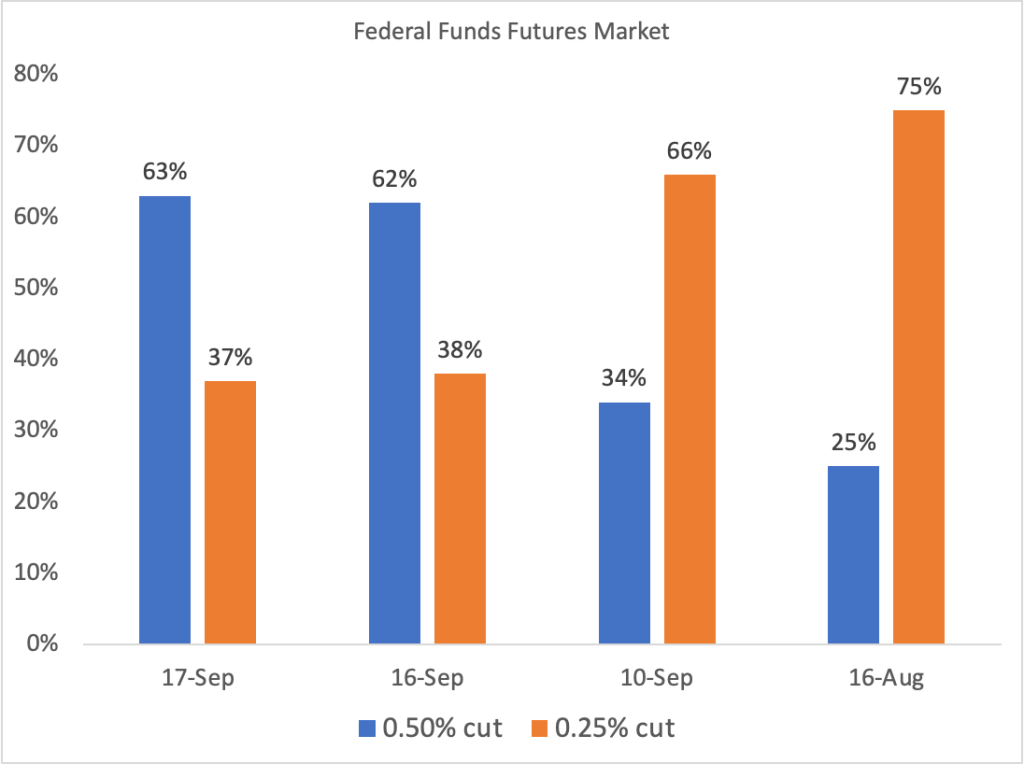
The “Employment Situation” report (often referred to as the “jobs report”), released monthly by the Bureau of Labor Statistics (BLS), is always closely followed by economists and policymakers because it provides important insight in the current state of the U.S. economy. The jobs report for August, which was released in early September, showed signs that the labor market was cooling. The report played a role in the decision by the Fed’s policy-making Federal Open Market Committee to cut its target for the federal funds rate by 0.50 percentage point (50 basis points) at its meeting on September 17-18. A 0.25 percentage point (25 basis points) cut would have been more typical.
In a press conference following the meeting, Fed Chair Jerome Powell explained that one reason that the Fed’s policy-making Federal Open Market Committee (FOMC) cut its for the federal funds rate by 50 basis points rather than by 25 basis points was the state of the labor market: “In the labor market, conditions have continued to cool. Payroll job gains averaged 116,000 per month over the past three months, a notable step-down from the pace seen earlier in the year.”
The September jobs report released this morning (October 4) indicates that conditions in the labor market appear to have turned around. The jobs report has two estimates of the change in employment during the month: one estimate from the establishment survey, often referred to as the payroll survey, and one from the household survey. As we discuss in Macroeconomics, Chapter 9, Section 9.1 (Economics, Chapter 19, Section 19.1), many economists and policymakers at the Federal Reserve believe that employment data from the establishment survey provides a more accurate indicator of the state of the labor market than do either the employment data or the unemployment data from the household survey. (The groups included in the employment estimates from the two surveys are somewhat different, as we discuss in this post.)
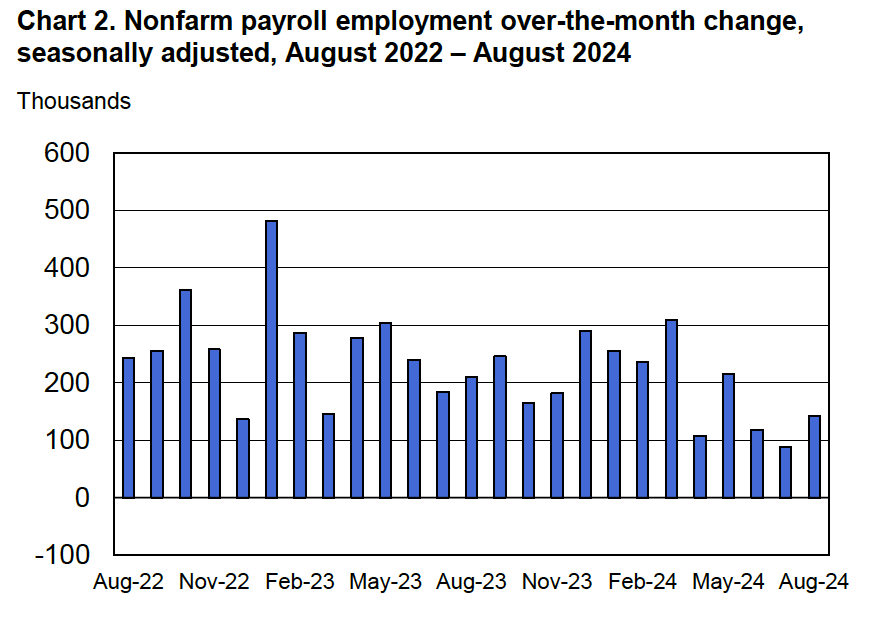
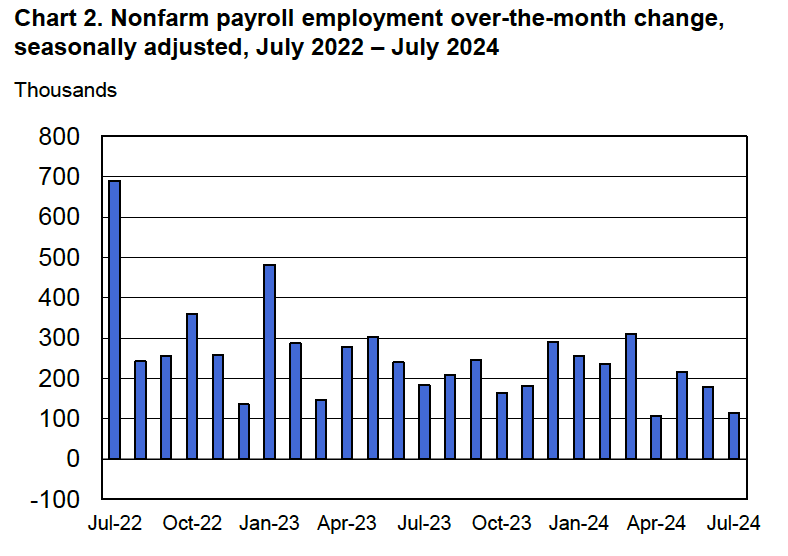
Economists surveyed by the Wall Street Journal and by Bloomberg had forecast a net increase in payroll employment of 150,000 and an unchanged unemployment rate of 4.2 percent. The BLS reported a higher net increase of 250,000 jobs and a tick down of the unemployment rate to 4.1 percent. In addition, the BLS revised upward its estimates of the employment increases in July and August by a total of 72,000. (The BLS notes that: “Monthly revisions result from additional reports received from businesses and government agencies since the last published estimates and from the recalculation of seasonal factors.”) The following figure, taken from the BLS report, shows the net changes in employment for each month during the past two years.
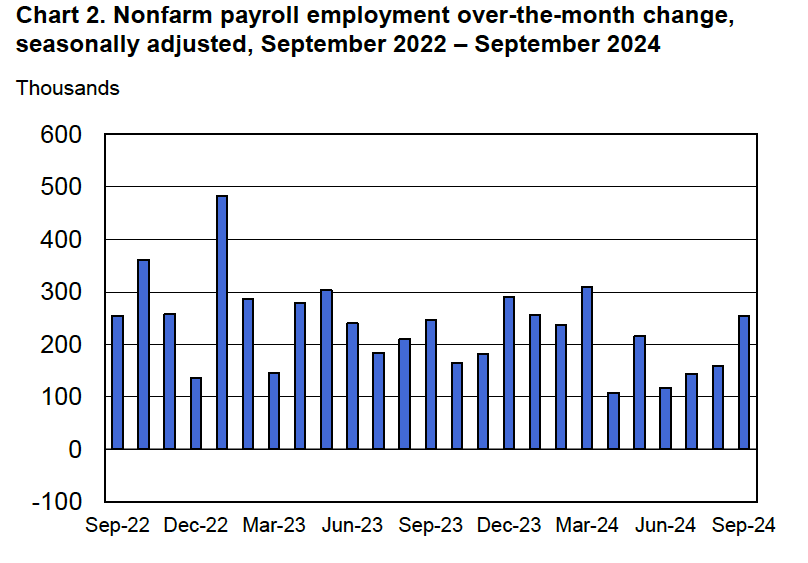
What had seemed from the BLS’s initial estimates to be slow growth in employment from April to June has been partly reversed by revisions. With the current estimates, employment has been increasing since July at a pace that should reduce any concerns that U.S. economy is on the brink of a recession.
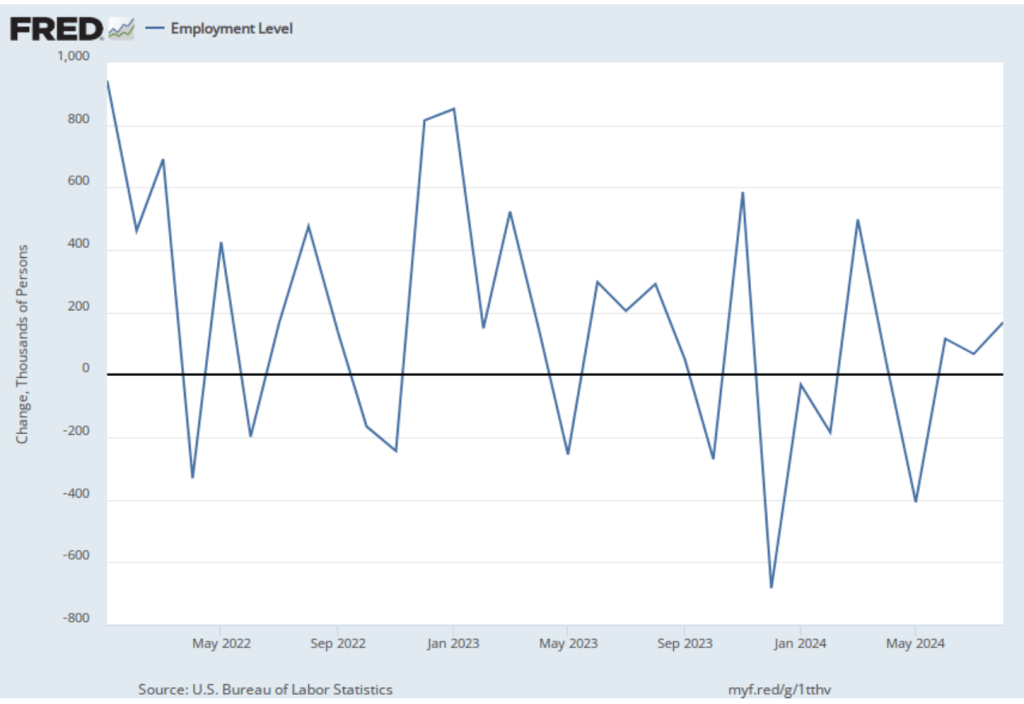
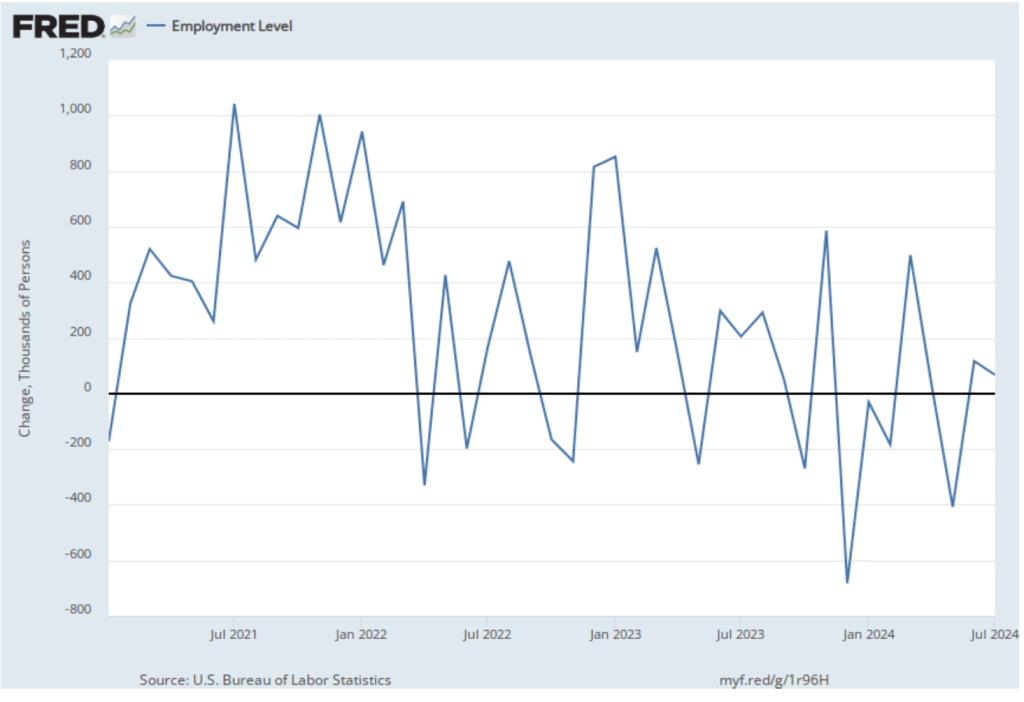
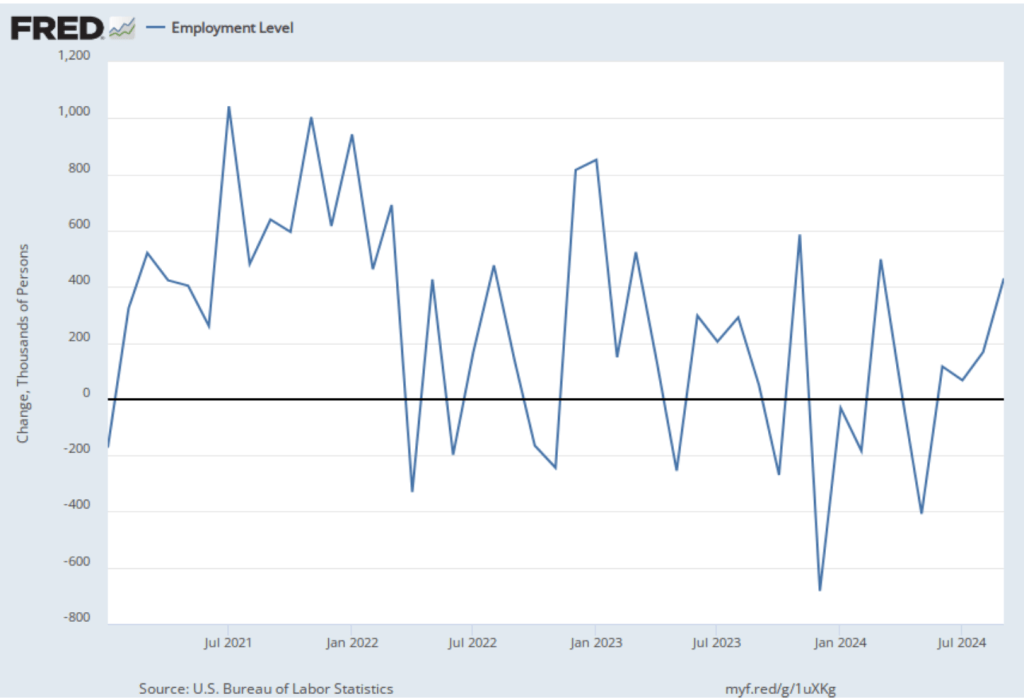
As the following figure shows, the net change in jobs from the household survey moves much more erratically than does the net change in jobs from the establishment survey. The net change in jobs as measured by the household survey increased from 168,000 in August to 430,000 in September. So, in this case the direction of change in the two surveys was the same, with both showing strong increases in the net number of jobs created in September.
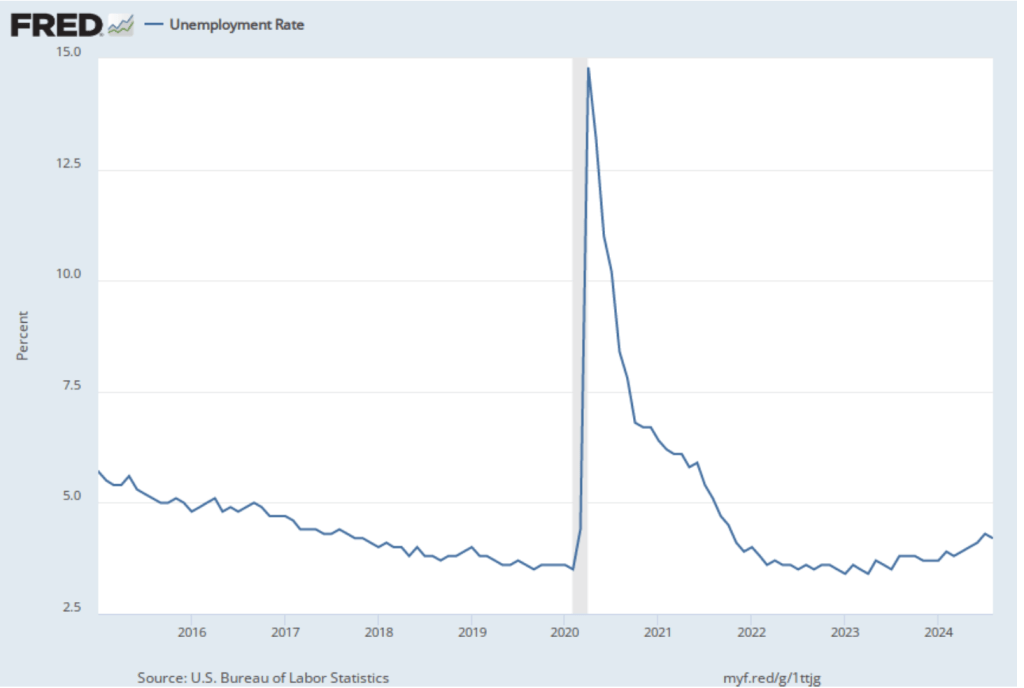
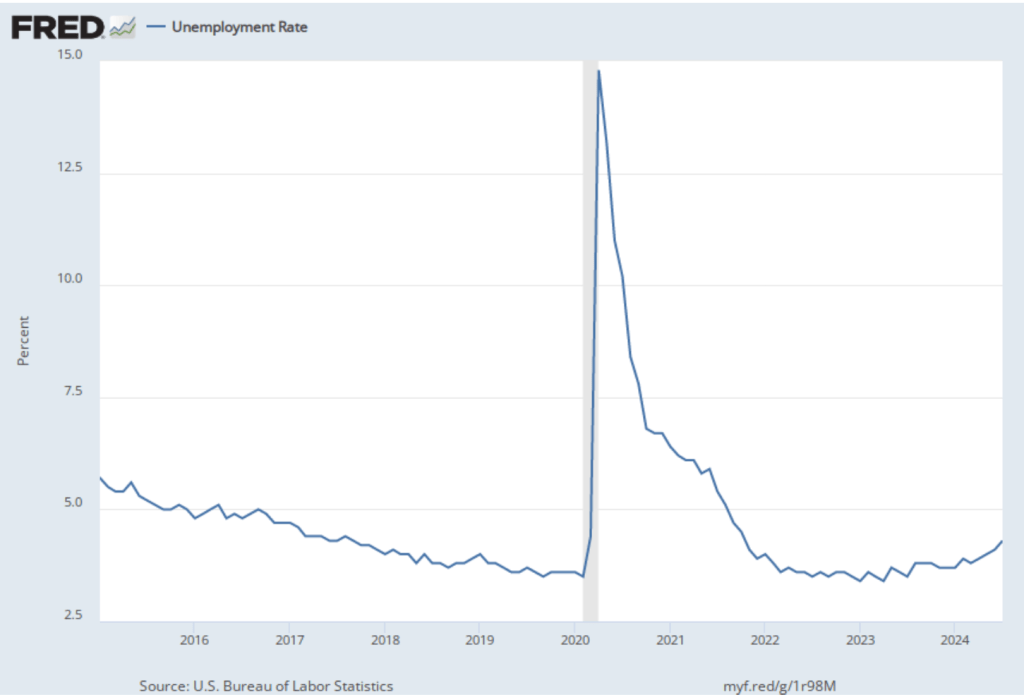
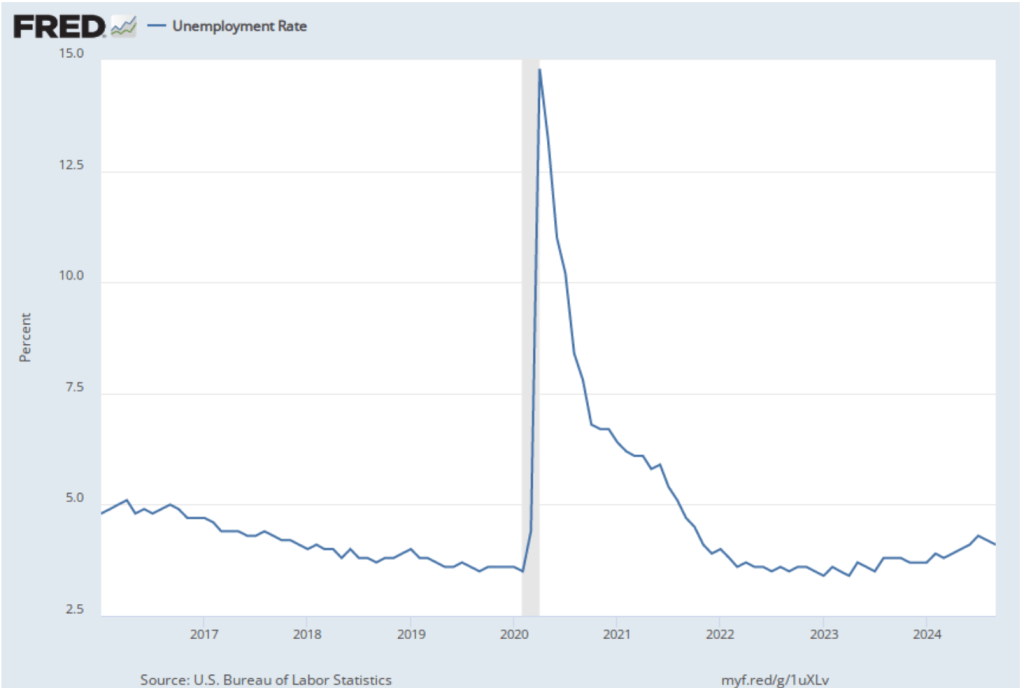
As the following figure shows, the unemployment rate, which is also reported in the household survey, decreased slightly for the second month in a row. It declined from 4.2 percent in August to 4.1 percent in September.
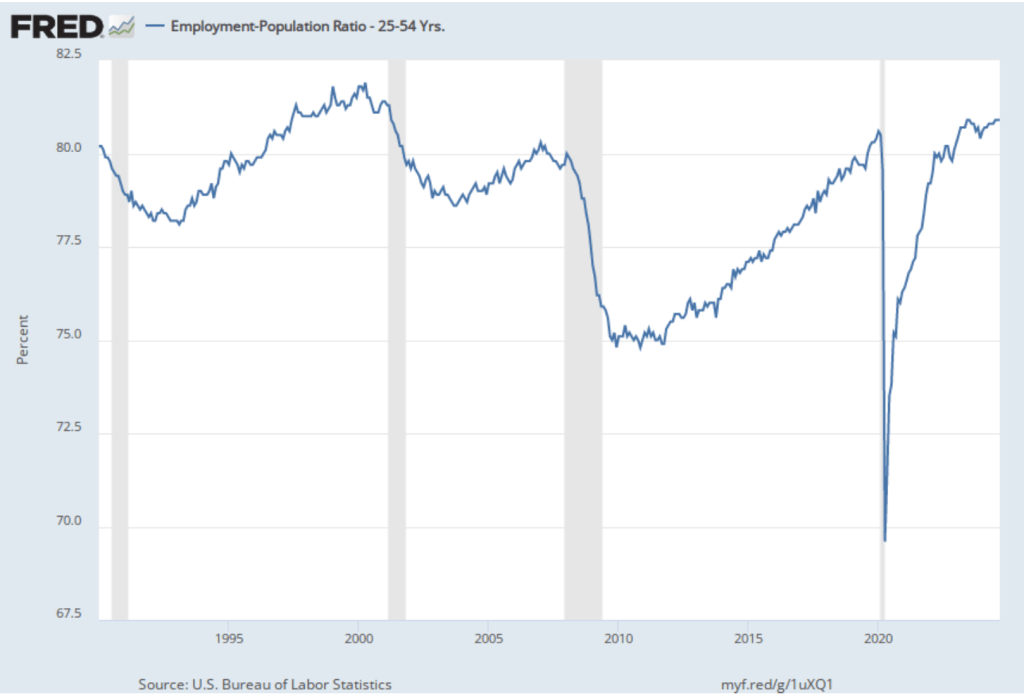
The household survey also provides data on the employment-population ratio. The following figure shows the employment-population ratio for prime age workers—those aged 25 to 54. It’s been unchanged since July at 80.9 percent, the higest level since 2001.
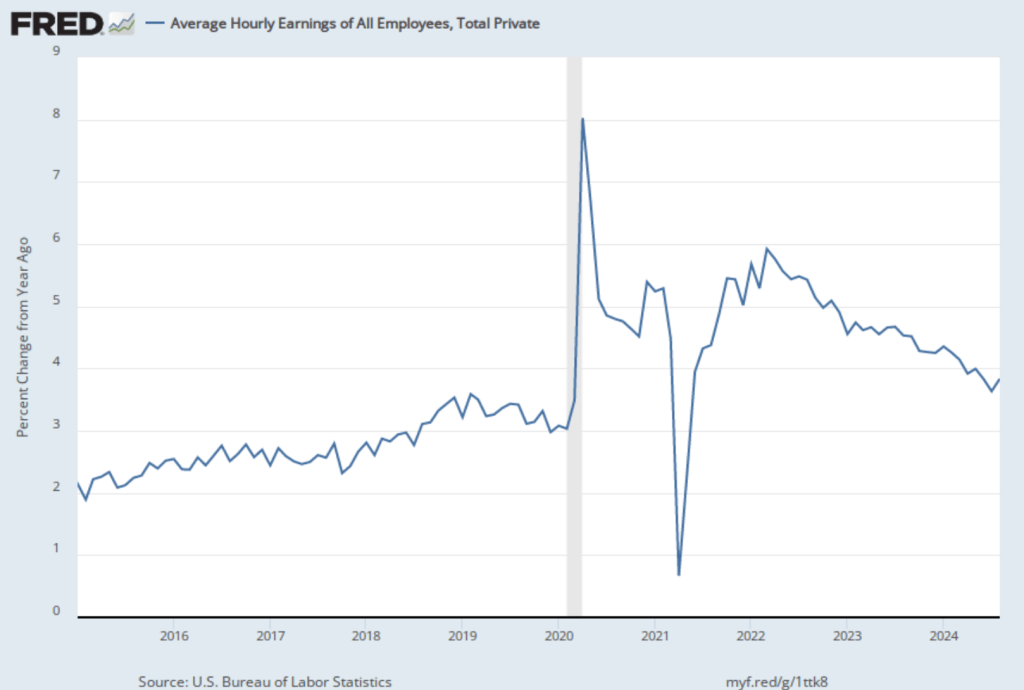
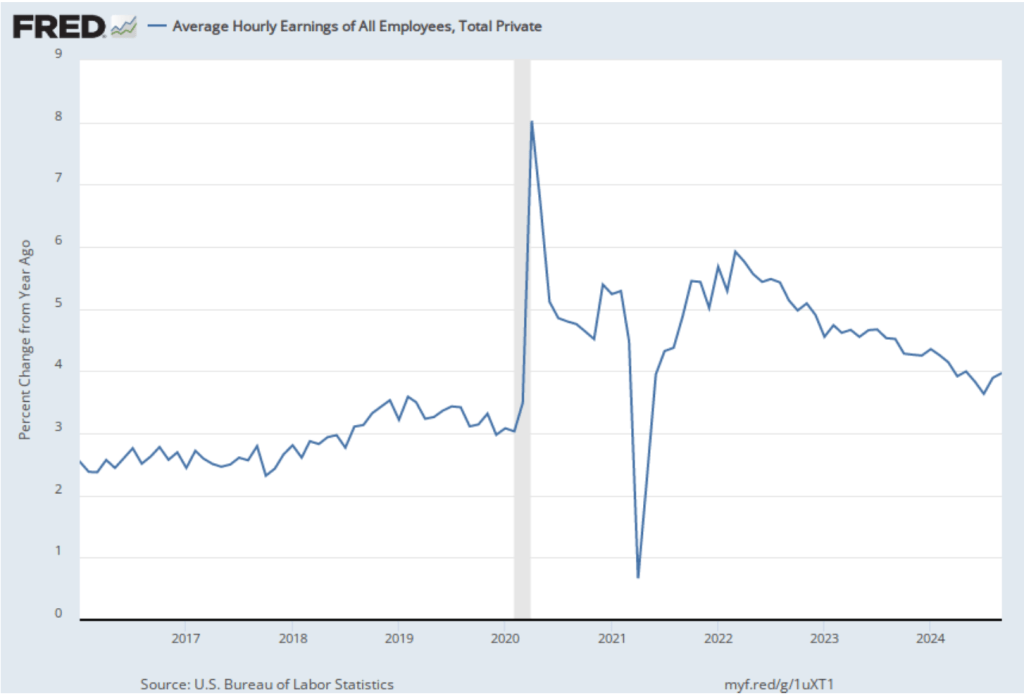
The establishment survey also includes data on average hourly earnings (AHE). As we note in this post, many economists and policymakers believe the employment cost index (ECI) is a better measure of wage pressures in the economy than is the AHE. The AHE does have the important advantage that it is available monthly, whereas the ECI is only available quarterly. The following figure shows the percentage change in the AHE from the same month in the previous year. AHE increased 4.0 percent in September, up from a 3.9 percent increase in August.
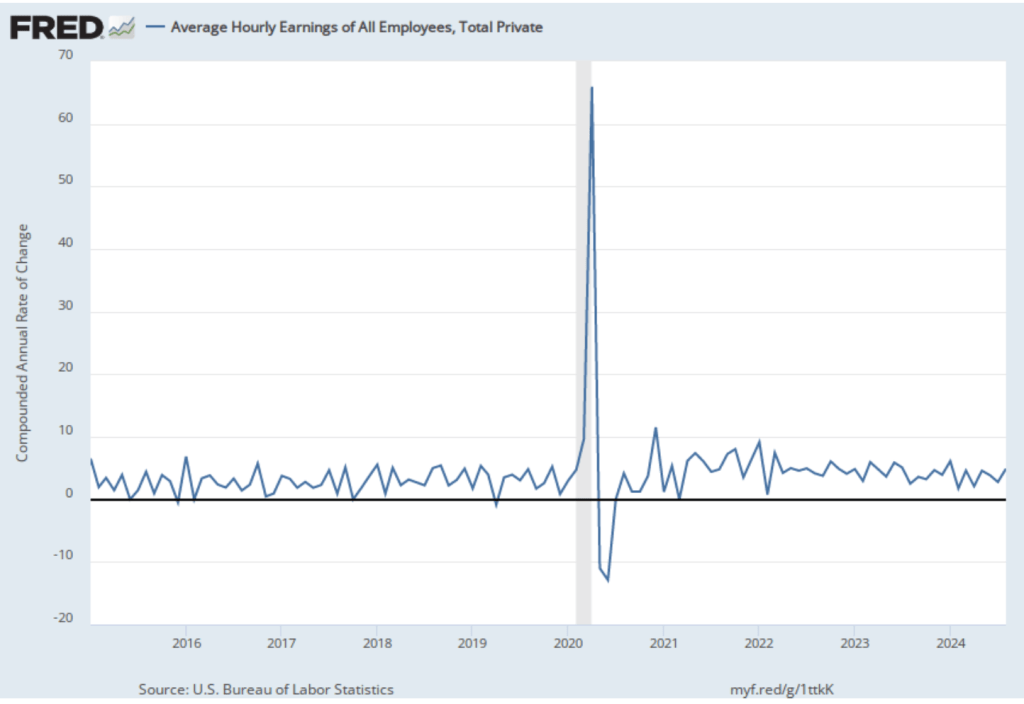
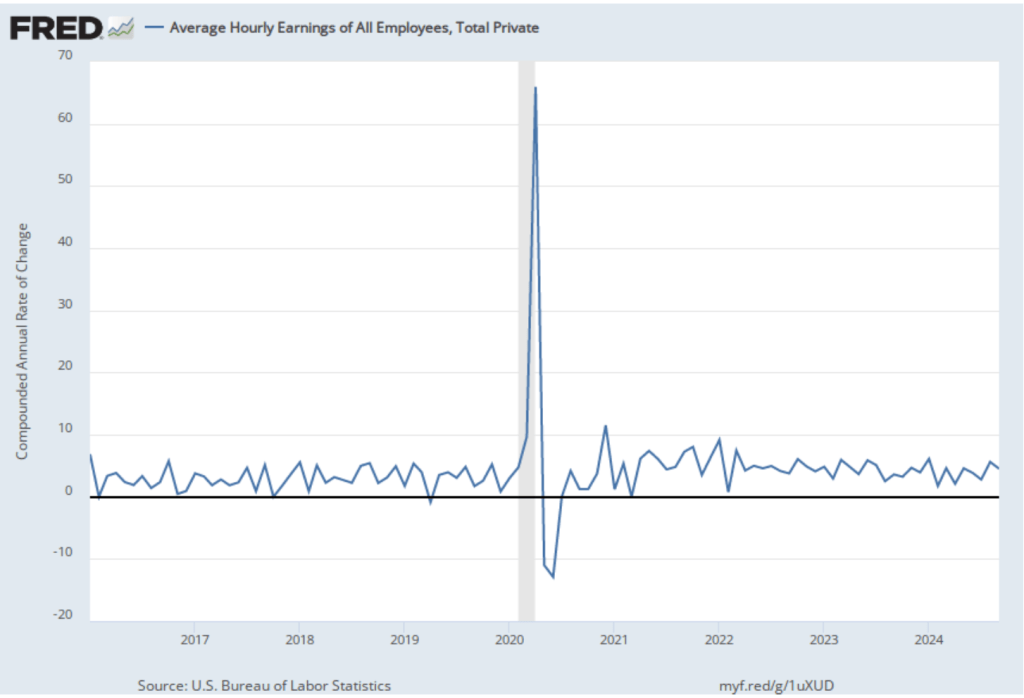
The following figure shows wage inflation calculated by compounding the current month’s rate over an entire year. (The figure above shows what is sometimes called 12-month wage inflation, whereas this figure shows 1-month wage inflation.) One-month wage inflation is much more volatile than 12-month wage inflation—note the very large swings in 1-month wage inflation in April and May 2020 during the business closures caused by the Covid pandemic.
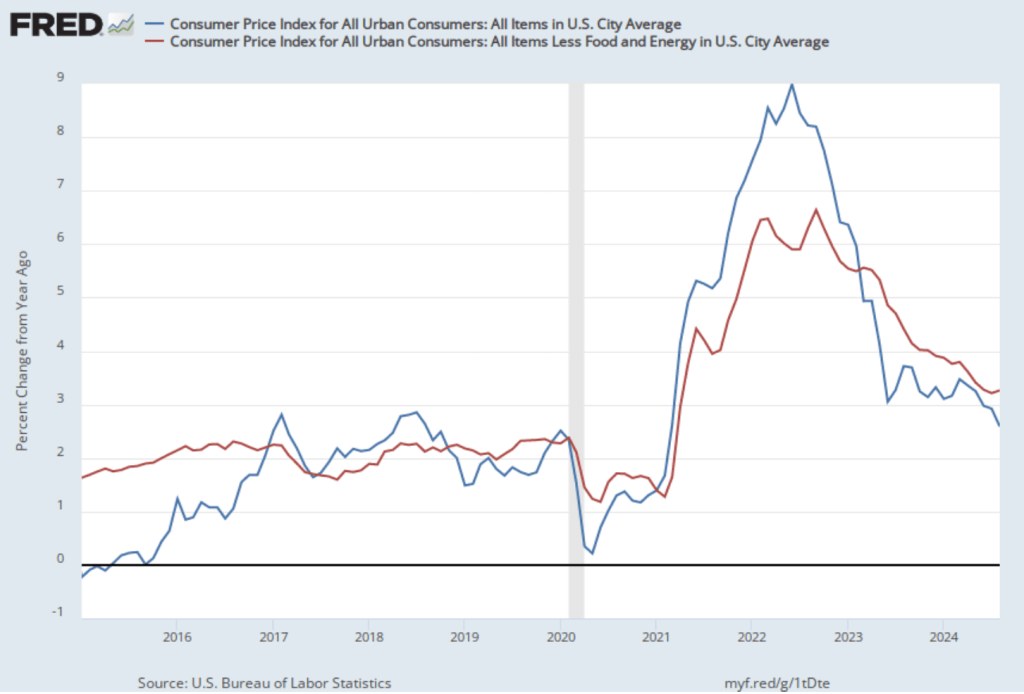
The 1-month rate of wage inflation of 4.5 percent in September is a decrease from the 5.6 percent rate in August. Whether measured as a 12-month increase or as a 1-month increase, AHE is increasing more rapidly than is consistent with the Fed achieving its 2 percent target rate of price inflation.
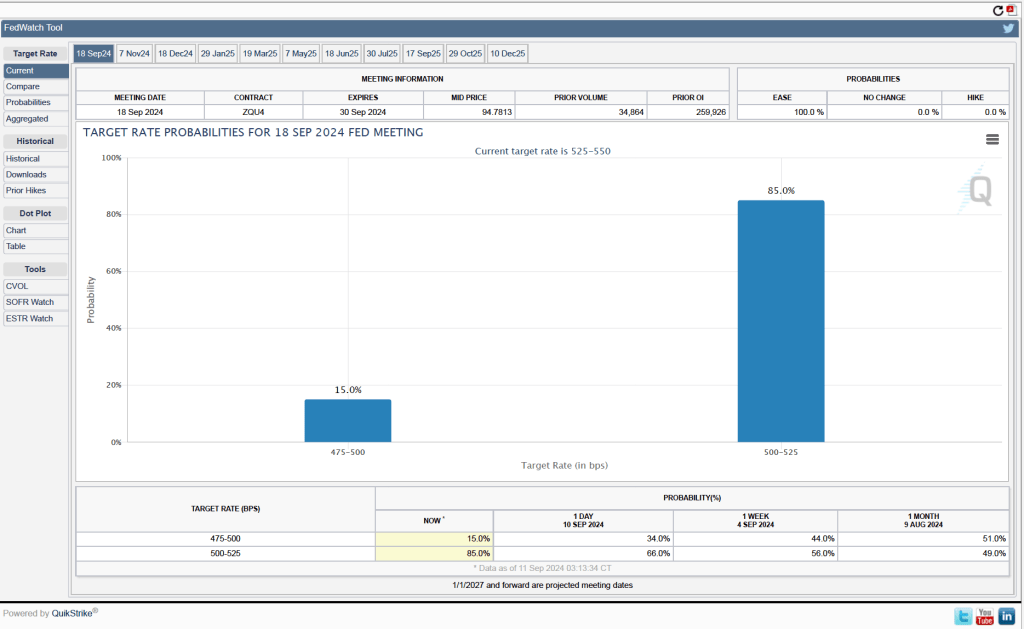
What effect will this jobs report likely have on the FOMC’s actions at its final two meetings of the year on November 6-7 and December 17-18? Some investors were expecting that the FOMC would cut its target for the federal funds rate by 50 basis points at its next meeting, matching the cut at its September meeting. This jobs report makes it seem more likely that the FOMC will cut its target by 25 basis points.
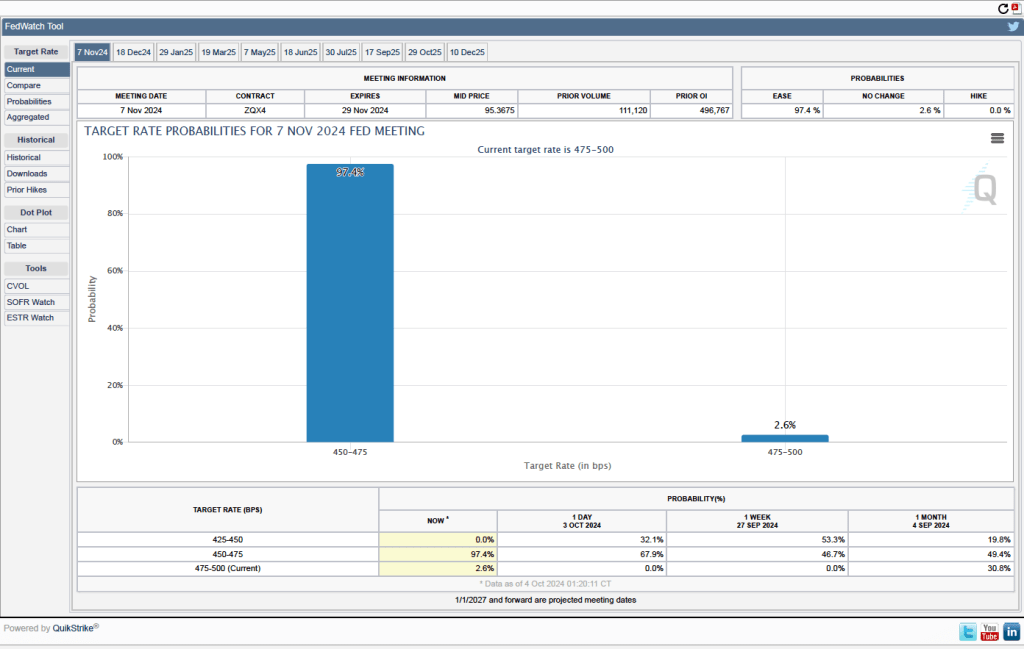
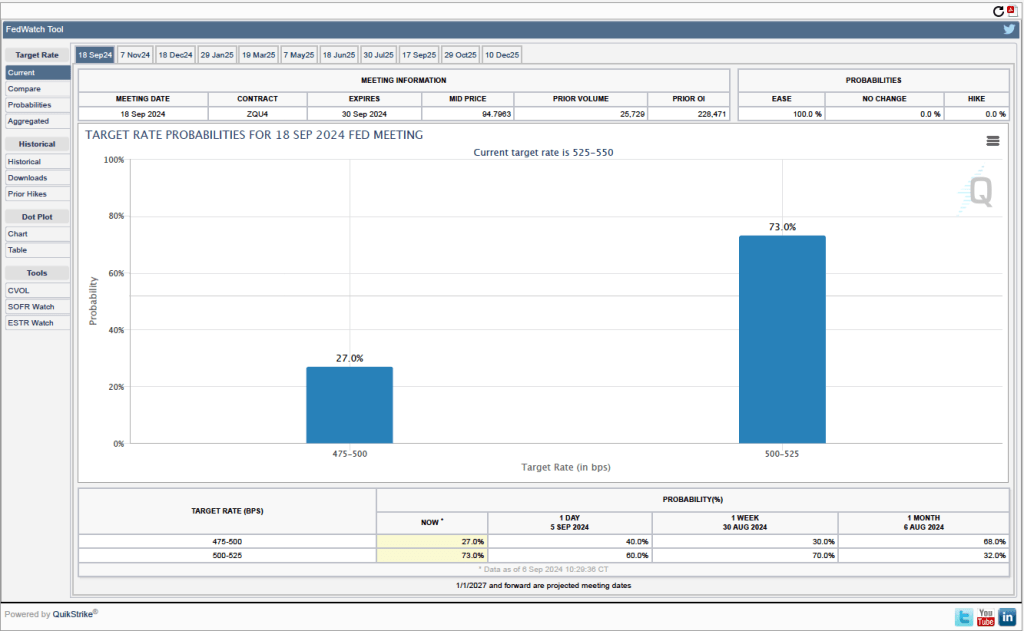
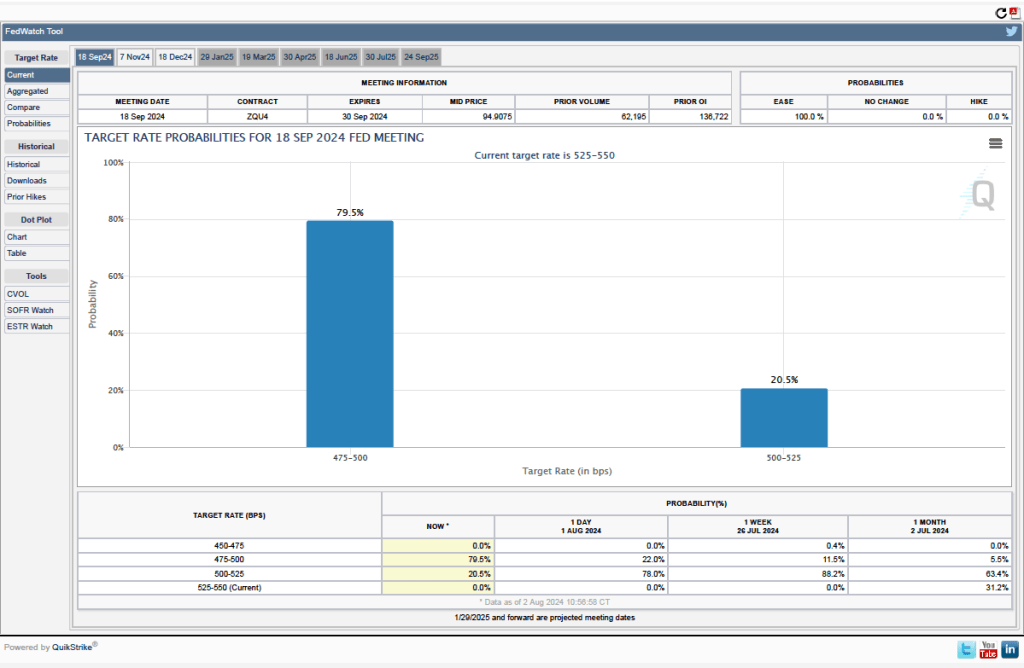
One indication of expectations of future rate cuts comes from investors who buy and sell federal funds futures contracts. (We discuss the futures market for federal funds in this blog post.) As shown in the following figure, today these investors assign a probability of 97.4 percent to the FOMC cutting its target for the federal funds rate by 25 basis points percentage point at its next meeting and a probability of 2.6 percent to the FOMC leaving its target unchanged at a range of 4.75 percent to 5.00 percent. Investors see effectively no chance of a 50 basis point cut at the next meeting.