Image created by ChatGPT
This morning (November 6), the Bureau of Labor Statistics (BLS) released its “Employment Situation” report (often called the “jobs report”) for October. Following September’s disappointing report, October brought better news: Payroll employment increased by 165,000, well above the 65,000 increase economists surveyed by the Wall Street Journal had forecast. The unemployment rate edged down from 4.2 percent to 4.1 percent. Revisions to earlier months also made recent job growth look stronger than previously reported.
The jobs report draws on two surveys. The establishment survey counts jobs on employers’ payrolls, while the household survey counts employed people and provides the unemployment rate. As we discuss in Macroeconomics, Chapter 9, Section 9.1 (Economics, Chapter 19, Section 19.1), the surveys cover somewhat different groups. The payroll survey generally provides a less volatile measure of monthly employment changes. The household survey supplies information about workers that payroll records cannot provide.
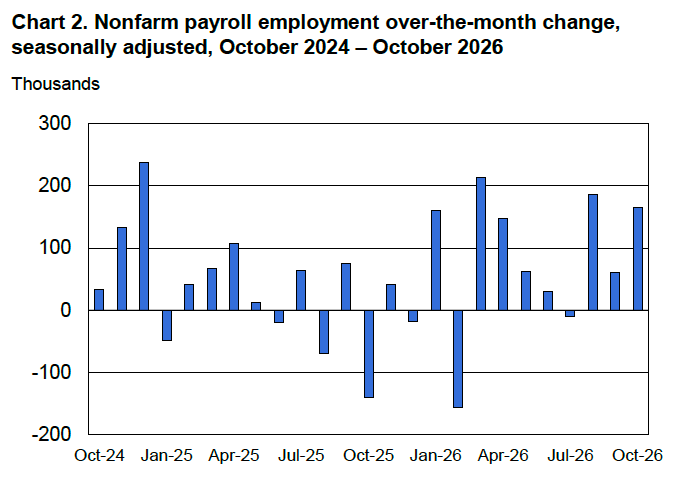
The BLS revised August’s payroll employment increase from 133,000 to 186,000 and September’s increase from 29,000 to 60,000. Together, those revisions added 84,000 jobs to the previously reported totals. ((The BLS notes that: “Monthly revisions result from additional reports received from businesses and government agencies since the last published estimates and from the recalculation of seasonal factors.”) With the revisions, job growth averaged 137,000 per month from August through October, compared with just 28,000 from May through July. Through October, payroll employment growth has averaged about 86,000 per month this year, compared with 10,000 per month in 2025 and 122,000 in 2024. Employment is growing faster than last year, but the average pace remains below that of 2024. The following figure from the jobs report shows the substantial monthly fluctuations in employment, as well as the stronger job growth over the past three months.
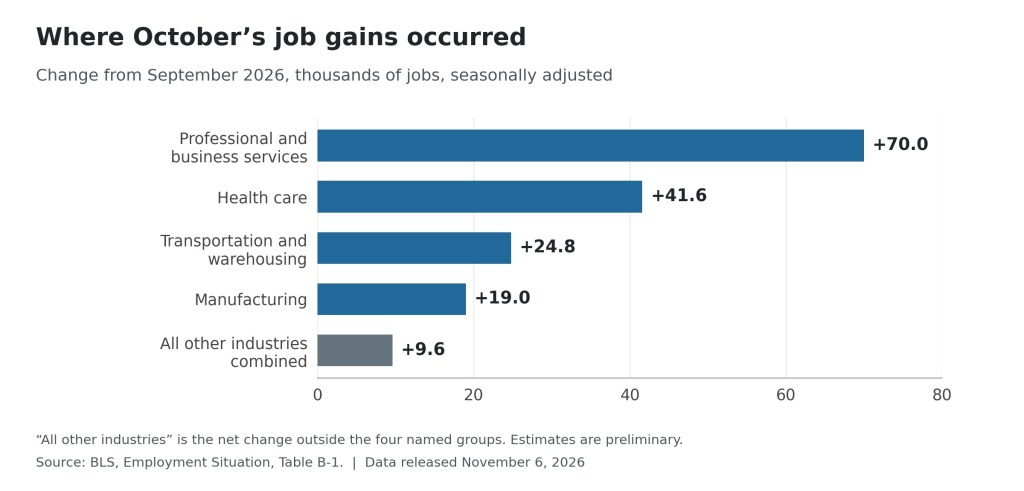
The professional and business services employment category led October’s job gains, adding 70,000. Health care added about 42,000 jobs, transportation and warehousing added about 25,000, and manufacturing added 19,000. These four groups accounted for about 94 percent of the net increase in employment. The leisure and hospitality and wholesale trade categories lost jobs. Of the overall 165,000 increase in jobs, 159,000 were in the private sector and 6,000 were in government. The following figure shows the contributions of the four leading groups and all other industries combined.
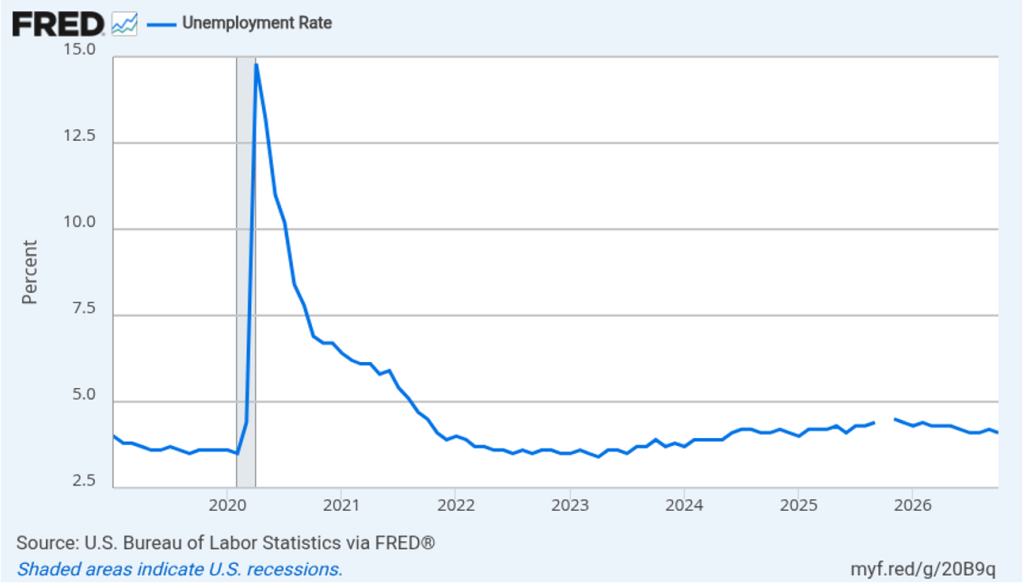
The unemployment rate, which is calculated from data in the household survey, was 4.1 percent in October, down slightly from 4.2 percent in September. The estimated size of the labor force and the number of workers employed increased in October, while the number of workers unemployed fell. The following figure shows that the unemployment rate has been remarkably stable over the past year and a half, staying between 4.0 percent and 4.4 percent in each month since June 2024. The Federal Open Market Committee’s most recent estimate of the natural rate of unemployment—the normal rate of unemployment over the long run—is 4.2 percent. So, currently the unemployment rate is slightly below that estimate of the natural rate. (We discuss the natural rate of unemployment in Macroeconomics, Chapter 9 and Economics, Chapter 19.)
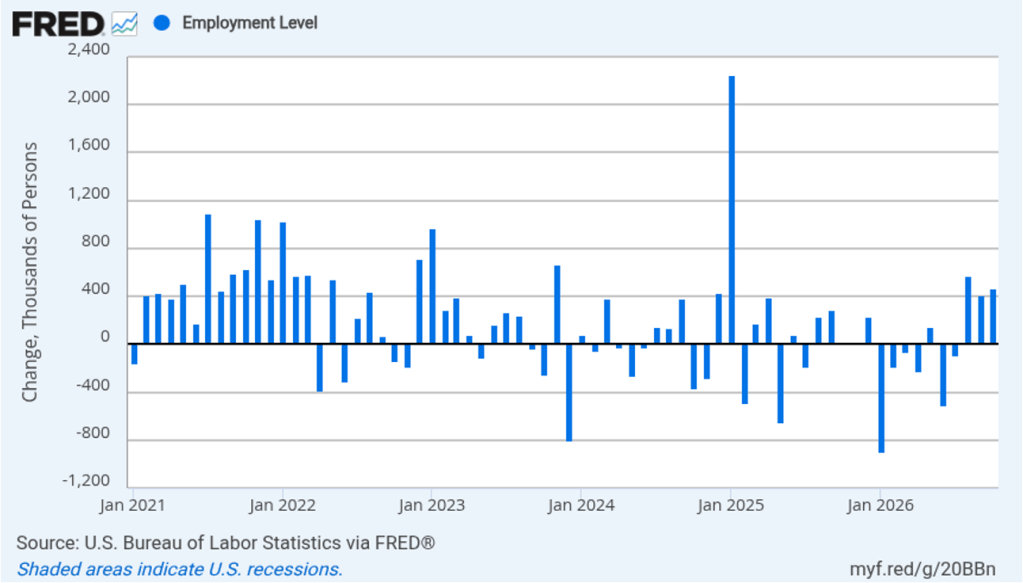
As the following figure shows, the monthly net change in jobs from the household survey moves much more erratically than does the net change in jobs from the establishment survey. As measured by the household survey, there was a net increase of 463,000 jobs in October, far larger than the net increase in employment shown in the establishment survey. Since January, the household survey has shown a net increase in jobs in only four months, with a total net decrease of 377,000 jobs over the period. In contrast, the establishment survey has shown a net increase of 861,000 jobs over the same period. (Note that because of last year’s shutdown of the federal government, there are no data for October or November.)
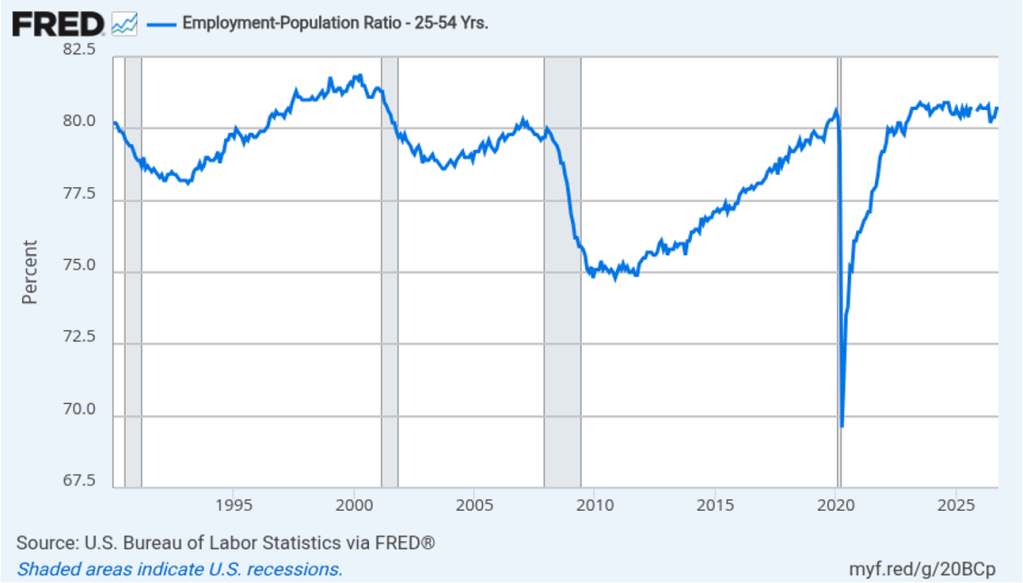
The household survey has another important labor market indicator: the employment-population ratio for prime age workers—those workers aged 25 to 54. In October, the ratio was 80.7 percent, unchanged from September. The prime-age population ratio can show volatility from month to month but has remained above 80 percent every month since December 2022.
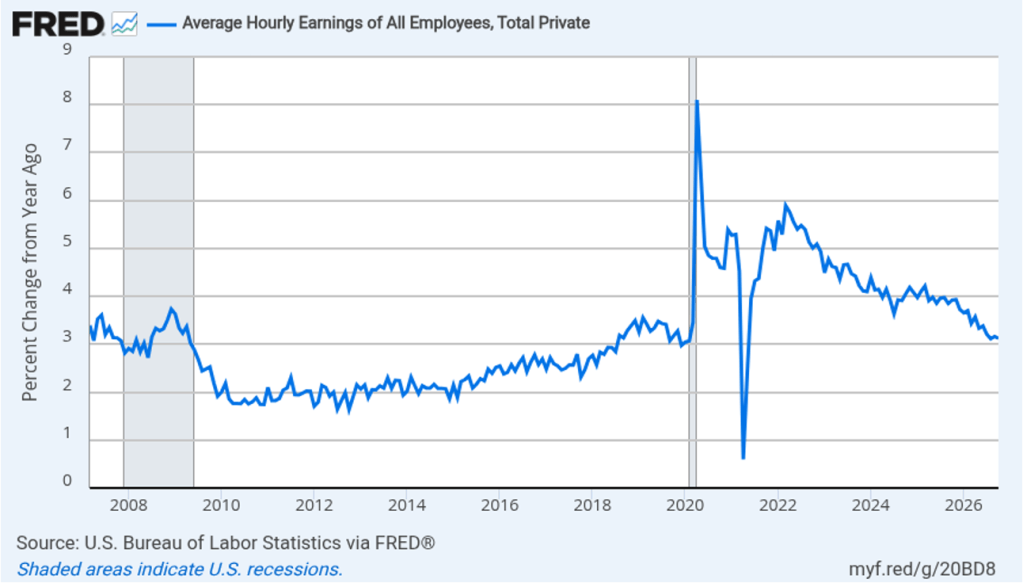
The establishment survey also includes data on average hourly earnings (AHE) measure of wages and salaries. The following figure shows the percentage change in AHE from the same month in the previous year. AHE increased 3.1 percent in October, down from 3.2 percent in September. That was the smallest increase since May 2021. The rate of increase in AHE has been below 4.0 percent each month since August 2025, indicating that cost pressure from wage increases has not been a significant source of price inflation during the past year. Over this same period, wage increases have struggled to keep up with price increases, resulting in a decline in real wages.
Will the strong October jobs report matter for Federal Reserve policy? At its October 27–28 meeting, the Federal Open Market Committee (FOMC) left its target range for the federal funds rate unchanged at 3.75 percent to 4.00 percent. Inflation remains a concern: The personal consumption expenditures price index in September was up 3.6 percent from September 2025, well over the Fed’s 2 percent annual target. Today’s jobs report indicates strength in labor market, which may make Fed policymakers more willing to focus on inflation. That would increase the likelihood that the committee will raise the target for the federal funds rate at its next meeting on December 8–9.
Trading in the federal funds futures market this afternoon indicates that investors believe that the committee will increase its federal funds rate target at its December meeting. Yesterday, trading in the federal funds futures market indicated that investors assigned a 66.9 percent probably to a rate increase at the December meeting, while this afternoon the probability had increased to 79.1 percent.