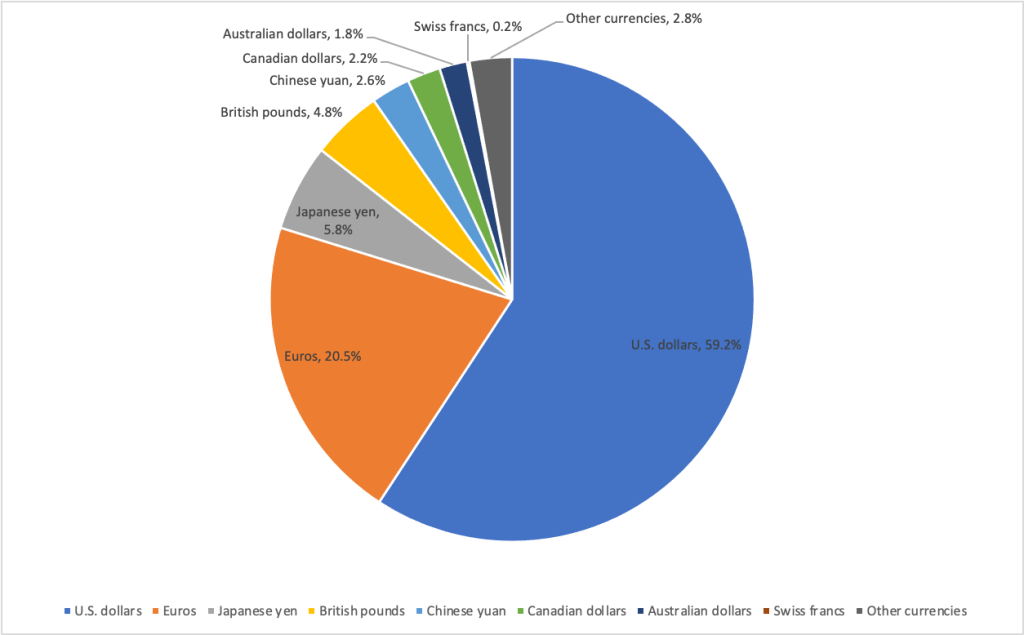
When Congress established the Federal Reserve System in 1913, it intended to make the Fed independent of the rest of the federal government. (We discuss this point in the opener to Macroeconomics, Chapter 15 and to Economics, Chapter 25. We discuss the structure of the Federal Reserve System in Macroeconomics, Chapter 14, Section 14.4 and in Economics, Chapter 24, Section 24.4.) The ultimate responsibility for operating the Fed lies with the Board of Governors in Washington, DC. Members of the Board of Governors are nominated by the president and confirmed by the Senate to 14-year nonrenewable terms. Congress intentionally made the terms of Board members longer than the eight years that a president serves (if the president is reelected to a second term).
The president is still able to influence the Board of Governors in two ways:
- The terms of members of the Board of Governors are staggered so that one term expires on January 31 of each even-number year. Although this approach means that it’s unlikely that a president will be able to appoint all seven members during the president’s time in office, in practice, many members do not serve their full 14-year terms. So, a president who serves two terms will typically have an opportunity to appoint more than four members of the Board.
- The president nominates one member of the Board to serve a renewable four-year term as chair, subject to confirmation by the Senate.
The terms of Fed chairs end in the year after the year a president begins either the president’s first or second term. As a result, presidents are often faced with what is at times a difficult decision as to whether to reappoint a Fed chair who was first appointed by a president of the other party.
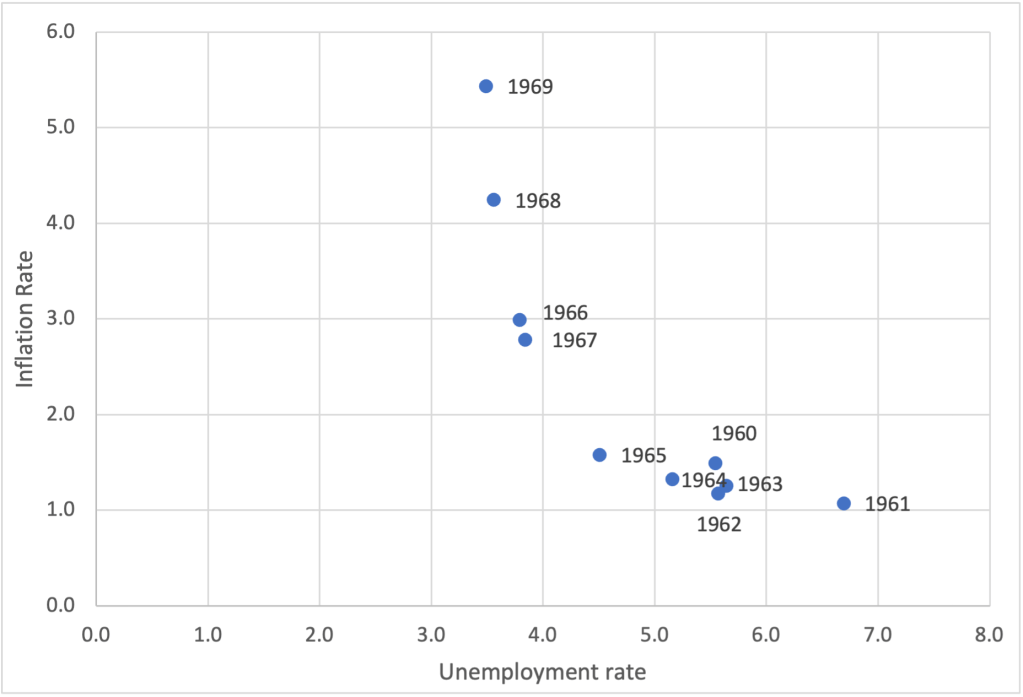
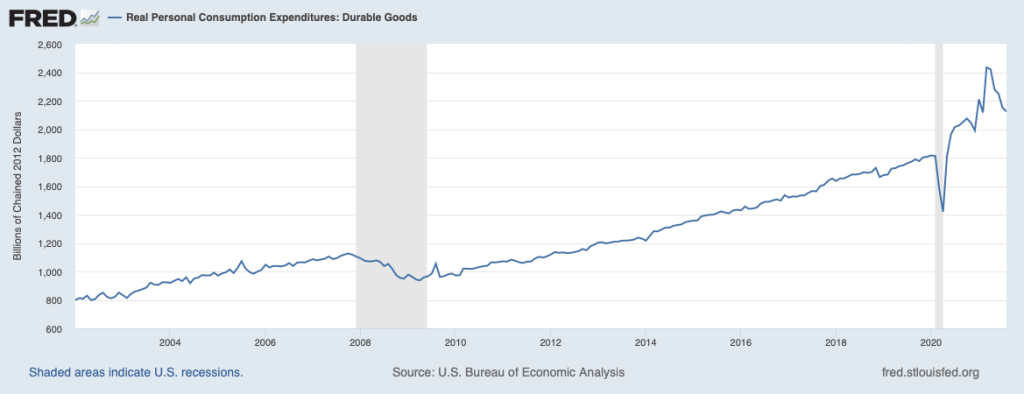
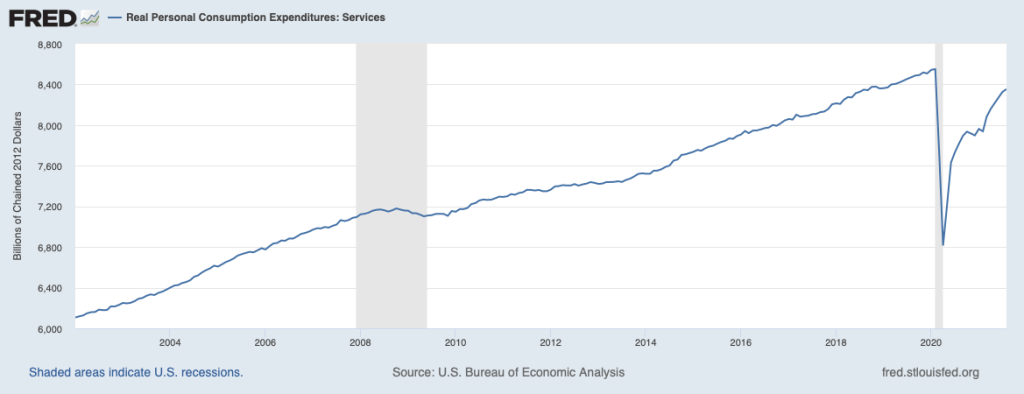
For example, after taking office in January 2009, President Barack Obama, a Democrat, faced the decision of whether to nominate Fed Chair Ben Bernanke to a second term to begin in 2010. Bernanke had originally been appointed by President George W. Bush, a Republican. Partly because the economy was still suffering the aftereffects of the financial crisis and the Great Recession, President Obama decided that it would potentially be disruptive to financial markets to replace Bernanke, so he nominated him for a second term.
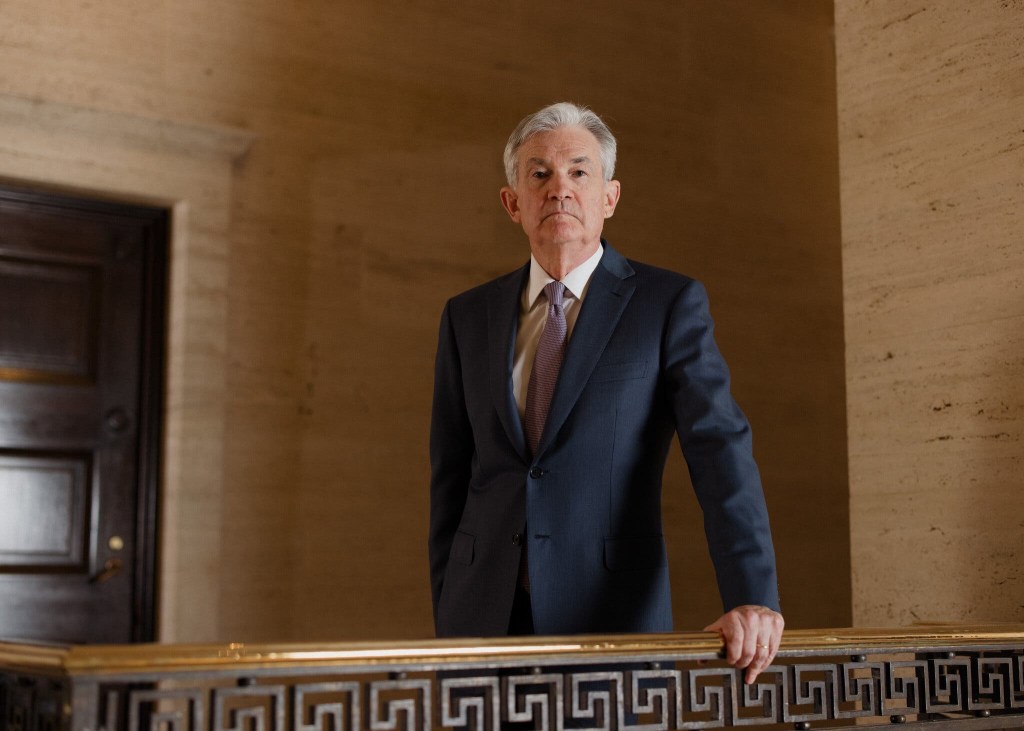
After taking office in January 2017, President Donald Trump, a Republican, had to decide whether to nominate Fed Chair Janet Yellen, who had been appointed by Obama, to another term that would begin in 2018. He decided not to reappoint Yellen and instead nominated Jerome Powell, who was already serving on the Board of Governors. Although a Republican, Powell had been appointed to the Board in 2014 by Obama.
President Biden’s reasons for nominating Powell to a second term to begin in 2022 were similar to Obama’s reasons for nominating Bernanke to a second term: The U.S. economy was still recovering from the effects of the Covid-19 pandemic, including the strains the pandemic had inflicted on the financial system. He believed that replacing Powell with another nominee would have been potentially disruptive to the financial system.
There had been speculation that Biden would choose Lael Brainard, who has served on the Board of Governors since 2014 following her appointment by Obama, to succeed Powell as Fed chair. Instead, Biden appointed Brainard as vice chair of the Board. In announcing the appointments, Biden stated: “America needs steady, independent, and effective leadership at the Federal Reserve. That’s why I will nominate Jerome Powell for a second term as Chair of the Board of Governors of the Federal Reserve System and Dr. Lael Brainard to serve as Vice Chair of the Board of Governors.”
Sources: Nick Timiraos and Andrew Restuccia, “Biden Will Tap Jerome Powell for New Term as Fed Chairman,” wsj.com, November 22, 2021; and Jeff Cox and Thomas Franck, “Biden Picks Jerome Powell to Lead the Fed for a Second Term as the U.S. Battles Covid and Inflation,” cnbc.com, November 22, 2021.