The Employment Cost Index, Inflation, and the Possibility of a Wage-Price Spiral

In respect to its mandate to achieve price stability, the Federal Open Market Committee focuses on data for the personal consumption expenditure (PCE) price index and the core PCE price index. (The core PCE price index omits food and energy prices, as does the core consumer price index.) After the March, June, September, and December FOMC meetings, each committee member projects future values of these price indexes. The projections, which are made public, provide a means for investors, businesses, and households to understand what the Fed expects to happen with future inflation.

In his press conference following the December 2021 FOMC meeting, Chair Jerome Powell surprised some economists by discussing the importance of the employment cost index (ECI) in the committee’s evaluation of the current state of inflation. Powell was asked this question by a journalist: “I wonder if you could talk a little bit about what prompted your recent pivot toward greater wariness around inflation.” He responded, in part:

“We got the ECI reading on the eve of the November meeting—it was the Friday before the November meeting—and it was very high, 5.7 percent reading for the employment compensation index for the third quarter … That’s really what happened [that resulted in FOMC deciding to focus more on inflation]. It was essentially higher inflation and faster—turns out much faster progress in the labor market.”

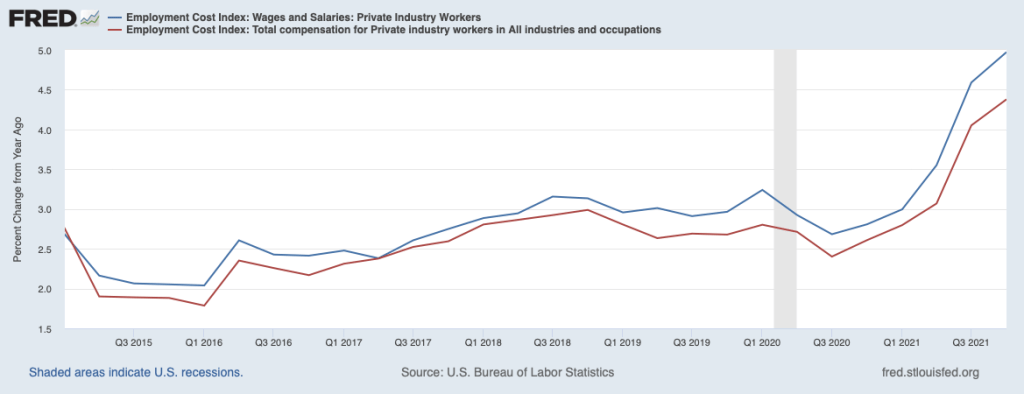
The ECI is compiled by the Bureau of Labor Statistics and is published quarterly. It measures the cost to employers per employee hour worked. The BLS publishes data that includes only wages and salaries and data that includes, in addition to wages and salaries, non-wage benefits—such as contributions to retirement accounts or health insurance—that firms pay workers. The figure below shows the ECI including just wages and salaries (red line) and including all compensation (blue line). The difference between the two lines shows that wages and salaries have been increasing more rapidly than has total compensation. 

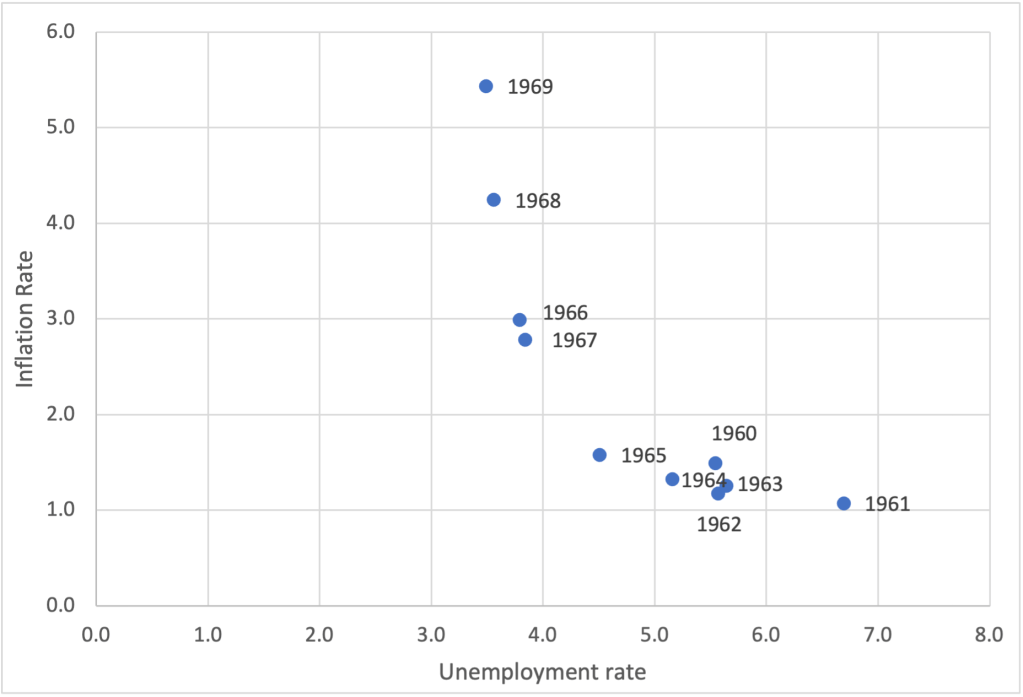
A focus on the labor market when analyzing inflation is unsurprising. In Macroeconomics, Chapter 17, Section 17.1 (Economics, Chapter 27, Section 27.1) we discuss how the Phillips curve links the state of the labor market—as measured by the unemployment rate—to the inflation rate. The link between the unemployment rate and the inflation rate operates through the labor market: When the unemployment rate is low, firms raise wages as they attempt to attract the relatively small number of available workers and to keep their own workers from leaving. (As first drawn by economist A.W. Phillips, the Phillips curve showed the relationship between the unemployment rate and the rate of wage inflation, rather than the relationship between the unemployment rate and the rate of price inflation.) As firms’ wage costs rise, they increase prices. So, as Powell noted, we would expect that if wages are rising rapidly, the rate of price inflation will also increase. 

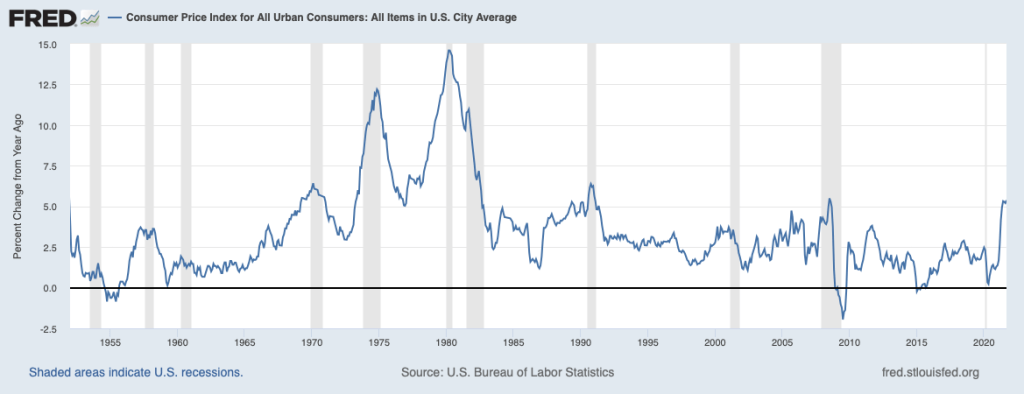
Powell noted that the FOMC is concerned that rising wages might eventually lead to a wage-price spiral in which higher wages lead to higher prices, which, in turn, cause workers to press for higher nominal wages to keep their real wages from falling, which then leads firms to increases their prices even more, and so on. Some economists interpret the inflation rates during the Great Inflation for 1968–1982 as resulting from a wage-price spiral. One condition for a wage-price spiral to begin is that workers and firms cease to believe that the Fed will be able to return to its target inflation rate—which is currently 2 percent.

In terms of the Phillips curve analysis of Chapter 17, a wage-price spiral can be interpreted as a shifting up of the short-run Phillips curve. The Phillips curve shifts up when households, firms, and investors increase their expectations of future inflation. We discuss this process in Chapter 17, Section 17.2. As the short-run Phillips curve shifts up the tradeoff between inflation and unemployment becomes worse. That is, the inflation rate is higher at every unemployment rate.  For the Fed to reduce the inflation rate—bring it back down to the Fed’s target—becomes more difficult without causing a recession. The Great Inflation was only ended after the Fed raised its target for the federal funds rate to levels that helped cause the severe recession of 1981–1982.

The FOMC has been closely monitoring movements in the ECI to make sure that it heads off a wage-price spiral before it begins.  

Sources:  The transcript of Chair Powell’s press conference can be found here; the most recent economic projections of FOMC members can be found here; and a news article discussing Powell’s fears of a wage-price spiral can be found here (subscription may be required).

Is the U.S. Economy Heading “Back to the ‘60s”?

A recent publication by economists Regis Barnichon, Luiz E. Oliveira, and Adam H. Shapiro at the Federal Reserve Bank of San Francisco asks that provocative question. “The ‘60s” is a reference to the events that led to the U.S. economy experiencing more than 10 years of high inflation rates. Below is a graph similar to Chapter 15, Figure 15.1 in Macroeconomics (Economics, Chapter 25, Figure 25.1) that shows the inflation rate in the United States as measured by the percentage change in the Consumer Price Index (CPI) for each year since 1952. Economists call the years from 1968 though 1982 the “Great Inflation” because inflation was greater during that period than during any other period in the history of the United States.

As we discuss in Macroeconomics, Chapter 17, Section 17.2 (Economics, Chapter 27, Section 27.2), many economists believe that the Great Inflation began as a result of the Federal Reserve attempting to keep the unemployment rate below the natural rate of unemployment for a period of several years. As predicted by the Phillips Curve, the inflation rate increased and, as Milton Friedman and Edmund Phelps had argued would likely happen, the expected inflation rate eventually increased. The inflation was made worse during the 1970s by two supply shocks resulting from sharp increases in oil prices.

Is the United States on the edge of repeating the experience of the Great Inflation? Earlier this year, Olivier Blanchard of the Peterson Institute for International Economics wrote a paper arguing that the U.S. economy was at significant risk of experiencing a significant acceleration in inflation. His paper included a figure similar to the one below showing the combinations of inflation and unemployment during each year of the 1960s. The figure shows a substantial acceleration in inflation over the course of the decade.

Blanchard notes that: 

“The history of the Phillips curve is one of shifts, largely due to the adjustment of expectations of inflation to actual inflation. True, expectations have [currently] been extremely sticky for a long time, apparently not reacting to movements in actual inflation. But, with such overheating, expectations might well deanchor. If they do, the increase in inflation could be much stronger.” 

….

“If inflation were to take off, there would be two scenarios: one in which the Fed would let inflation increase, perhaps substantially, and another—more likely—in which the Fed would tighten monetary policy, perhaps again substantially. Neither of these two scenarios is ideal. In the first, inflation expectations would likely become deanchored, cancelling one of the major accomplishments of monetary policy in the last 20 years and making monetary policy more difficult to use in the future. In the second, the increase in interest rates might have to be very large, leading to problems in financial markets.”

The authors of the San Francisco Fed publication are more optimistic. They begin their discussion by observing that because of the pandemic, the state of the labor market is more difficult to assess than in most years. They note that the unemployment rate of 4.8 percent in September 2021 was only slightly below the average unemployment rate over the past 30 years and well above the low unemployment rates of 2019 and early 2021. So, on the basis of the unemployment rate, policymakers at the Fed and in Congress might conclude that the inflation the U.S. economy is experiencing is not the result of overly tight labor markets such as those of the late 1960s. But the job openings rate(sometimes called the vacancy rate) is telling a different story. Job openings are positions that are both available to be filled within the next 30 days and for which firms are actively recruiting applicants from outside the firm. (According to the BLS: “The job openings rate is computed by dividing the number of job openings by the sum of employment and job openings and multiplying that quotient by 100.”)

The authors of the San Francisco Fed study note that “the vacancy rate is well above its 30-year average … and has surpassed its historic highs from the late 1960s … indicating that employers are having a difficult time filling positions. Confirming this high vacancy rate, the fraction of small businesses reporting that job openings are hard to fill is at historic highs ….” The figures below show the vacancy rate and the unemployment rate since January 2016.

The authors combine the unemployment rate and the vacancy rate into a statistic—the vacancy-to-unemployment ratio—that they demonstrate has historically done a better job of explaining movements in inflation than has the unemployment rate.  They expect that expansionary fiscal policy will result in an increase in vacancy-to-unemployment ratio and, therefore, an increase in the inflation rate. But they share the view of Blanchard and many other economists that a key issue is “the stability of longer-run inflation expectations.” 

We know that in the 1960s, several years of rising inflation made long-run inflation expectations unstable—in terms of the discussion in Chapter 17, the short-run Phillips curve shifted up. We don’t yet know what will happen to inflation expectations in late 2021 and in 2022, so we can’t yet tell how persistent current rates of inflation will be. 

Sources: Regis Barnichon, Luiz E. Oliveira, and Adam H. Shapiro, “Is the American Rescue Plan Taking Us Back to the ’60s?,” FRBSF Economic Letter, No. 2021-27, October 18, 2021; Olivier Blanchard, “In Defense of Concerns over the $1.9 Trillion relief Plan,” piie.com, February 18, 2021; and Federal Reserve Bank of St. Louis.

NEW! – 04/16/21 Podcast – Authors Glenn Hubbard & Tony O’Brien discuss monetary policy and the tools available to the Federal Reserve.

Authors Glenn Hubbard and Tony O’Brien follow up on last week’s fiscal policy podcast by discussing monetary policy in today’s world. The Fed’s role has changed significantly since it was first introduced. They keep an eye on inflation and employment but aren’t clear on which is their priority. The tools and models used by economists even a decade ago seem outdated in a world where these concepts of a previous generation may be outdated. But, are they? LIsten to Glenn & Tony discuss these issues in some depth as we navigate our way through a difficult financial time.

Just search Hubbard O’Brien Economics on Apple iTunes or any other Podcast provider and subscribe! Today’s episode is appropriate for Principles of Economics and/or Money & Banking!

Please listen & share!