The term “sticker shock” was first used during the 1970s to describe the surprise car buyers experienced when seeing how much car prices had risen. Because inflation during that decade was so high, anyone who hadn’t bought a car for several years was unprepared for the jump in car prices. During 2020 and 2021, sticker shock returned, particularly to the used car market. Prices were increasing so rapidly that even people who had purchased a car a year or two before were surprised by the increases.
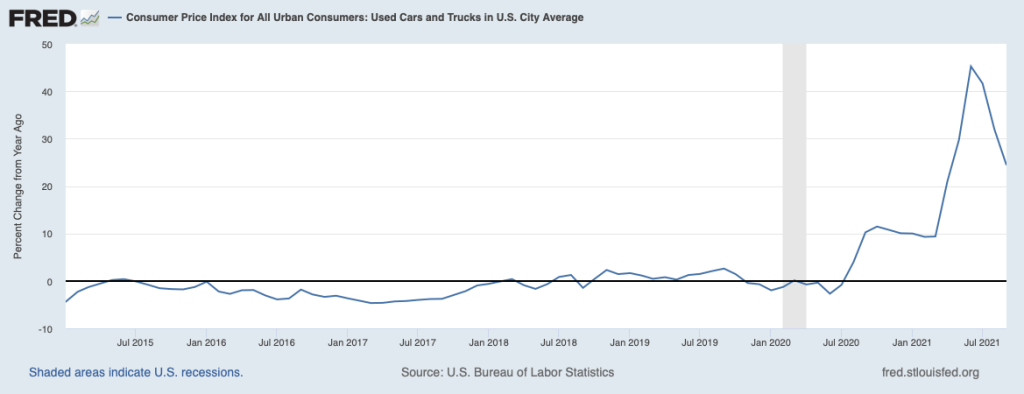
The following graph shows U.S. Bureau of Labor Statistics (BLS) data on inflation in the market for used cars in the months since January 2015. Inflation is measured as the percent change from the same month in the previous year in the used cars and trucks component of the Consumer Price Index (CPI). The CPI is the most widely used measure of inflation. Used car prices began rising in August 2020, peaking at a 45 percent increase in June 2021. Inflation at such rates over a period longer than a year is very unusual in any of components of the CPI.
What explains the extraordinary burst of inflation in used car prices during 2020 and 2021? Three factors seem to have been of greatest importance:
A decline in the supply of new cars resulting from a shortage in semiconductors caused an increase in new car prices. Rising new car prices led some consumers who would otherwise have bought a new car to enter the used car market, increasing the demand for used cars.
Because of the Covid-19 pandemic, some people became reluctant to ride buses and other mass transit, increasing the demand for both new and used cars.
As the pandemic increased in severity in the spring of 2020, most rental car companies decided to purchase fewer new cars for their fleets. After keeping a car in its fleet for one year, rental car companies typically sell the car to used car dealers for resale. Because rental car companies were selling them fewer cars, used car dealers had fewer cars on their lots. So the supply of used cars declined.
We can use the demand and supply model to explain the jump in used car prices. As shown in the following figure, the demand curve for used cars shifted to the right from D1 to D2, as some consumers who would otherwise have bought new cars, bought used cars instead, and as some people swithced from public transportation to driving their cars to work. At the same time, the supply of used cars shifted to the left from S1 to S2 because used car dealers were able to buy fewer used cars from rental car companies. The result was that the price of used cars rose from P1 to P2 at the same time that the quantity of used cars sold fell from Q1 to Q2.
Sources: Yueqi Yang, “U.S. Used-Car Prices, Key Inflation Driver, Surge to Record,” bloomberg.com, October 7, 2021; Nora Naughton, “Looking to Buy a Used Car? Expect High Prices, Few Options,” wsj.com, May 10, 2021; Cox Automotive, “13-Month Rolling Used-Vehicle SAAR,” coxautoinc.com, October 15, 2021; and Federal Reserve Bank of St. Louis.
In Economics, Chapter 10, Section 10.4, when discussing behavioral economics, we mentioned Richard Thaler’s idea of nudges, which are small changes that government policymakers or business managers can make that may affect people’s behavior. Underlying the concept of nudges is the assumption that at least some of the time people may not be making fully rational decisions (We discuss in the chapter the reasons why people may not always make fully rational decisions.) An example of a nudge is a business automatically enrolling employees into retirement savings plans to overcome the tendency of many people to be unrealistic about their future behavior.
Once vaccines for the Covid-19 virus became widely available to the general adult population in 2021, some government policymakers were concerned that not enough people were being vaccinated to quickly curb the pandemic. Some people who declined to be vaccinated had carefully thought through the decision and declined the vaccine either because they believed they were at only a small risk of developing a severe case of Covid-19 or for other reasons. But some people who were not vaccinated intended eventually to receive the injection but for various reasons had not yet done so. The second group were potentially candidates for being nudged into becoming vaccinated.
A recent National Bureau of Economic Research working paper by Tom Chang of the University of Southern California and colleagues reports an experiment that measured the effect of nudges intended to increase the likelihood of someone becoming vaccinated. The study was conducted in Contra Costa Country in northern California with 2,700 Medicaid (a state run system of health care offered to people with low incomes) recipients who agreed to participate. The study took place between May and July 2021 after all adults in the county had been eligible for several weeks to receive a vaccine. Half the people involved in the experiment received three nudges: 1) a video noting the positive effects of being vaccinated, 2) a financial incentive of either $10 or $50 if they received a vaccination within two weeks, and 3) “a highlighted convenient link to the county’s new public vaccination appointment scheduling system or just a message about getting vaccinated without a link.” The other half of the people involved in the experiment received none of these nudges.
The authors’ statistical analysis of the results of the experiment indicates that none of the nudges individually or in combination significantly raised vaccination rates. Do these results show conclusively that nudges are ineffective in increasing Covid-19 vaccination rates? The authors note that the people involved in this experiment were not representative of the U.S. population. All had low incomes (which made them eligible for Medicaid), they were relatively young, and were more likely to be Black or Hispanic than is true of the overall U.S. population. The study also took place just before the peak in the spread of the Delta variant of Covid-19 at a time when infection rates appeared to be declining. So, while for these reasons the study cannot be called a definitive, it does provide some evidence that nudges may not be effective in changing behavior towards vaccinations.
Source: Tom Chang, Mireille Jacobson, Manisha Shah, Rajiv Pramanik, and Samir B. Shah, “Financial Incentives and other Nudges Do Not Increase Covid-19 Vaccinations among the Vaccine Hesitant,” National Bureau of Economic Research, Working Paper 29403, October 2021.
In 1901, U.S. Steel became the world’s first corporation with a stock market value greater than $1 billion. In October 2021, Tesla joined Alphabet (Google’s corporate parent), Amazon, Apple, and Microsoft as the only U.S. corporations whose stock market value exceeds $1 trillion. (The Saudi Arabian Oil Company is the only non-U.S. firm with a market value above $1 trillion.)
As large U.S. corporations developed in the late nineteenth and early twentieth centuries, a key problem facing them was how to allocate the firms’ scarce financial capital across competing uses. (A thorough—and lengthy!—discussion of the development of the modern U.S. corporation is Alfred Chandler’s book, The Visible Hand: The Managerial Revolution in American Business.) By 1940, many large corporations had formed executive committees comprised of the chief executive officer (CEO), the chief operating officer (COO), and other so-called C-suite executives.
Executive committees typically don’t become involved in the day-to-day operations of the firms, leaving those responsibilities to lower level managers. Instead, executive committees devote most of their time to strategic issues such as whether to introduce new products, where to locate sales and production facilities, and how much of the firm’s resources to devote to research and development and to marketing. The decisions that an executive committee concentrates on involve how best to allocate the firm’s financial capital, funds that come from investors who buy the firm’s stocks and bonds and from the firm’s retained earnings—the firm’s profits that aren’t distributed as dividends to the firm’s shareholders. In allocating these funds, executive committees face trade-offs of the type we discuss in Chapter 2. For instance, if a U.S.-based firm uses funds to build a factory in another country, it may not have the funds to expand its domestic factories.
Allocating the firm’s financial capital will not have much effect on the firm’s profits in the short run but can be the main determinant of the firm’s profitability—and even its survival—in the long run. For instance, the failure of Blockbuster Video to expand into offering rentals of DVDs by mail or to offering a movie streaming service, resulted in the company shrinking from having 4,000 stores in the early 2000s to a single store today. In contrast, the decision in 2018 by U.S. pharmaceutical firm Pfizer to partner with BioNTech, a small German firm, to develop vaccines using messenger RNA (or mRNA) biotechnology proved very profitable for Pfizer (and saved many lives) when the Covid-19 virus led to a worldwide epidemic.
At Tesla, CEO Elon Musk has final say on strategic decisions, a situation typical of many large firms where a single executive, through stock ownership, has control of the company. One of his key decisions has been where to locate his production facilities. In making this decision, Musk faces trade-offs in how to use the scarce funds the firm has available for expanding production capacity. Building a facility in one place means not being able to fund building a facility in another place. In addition, funds used to build new factories is not available to increase research and development on autonomous cars or on other improvements to car design or technology.
Initially, Tesla operated a single factory in Fremont, California. Built in 1962, the factory had been owned by General Motors and then jointly by GM and Toyota before being sold to Tesla in 2010. In 2019, Tesla began construction of a second factory in Shanghai, China and in 2021 was awaiting final governmental approval to build a factory in Grünheide, Germany.
Why would Tesla, or another U.S. firm, decide to build factories in other countries? The simplest answer is that firms expand their operations outside the United States when they expect to increase their profitability by doing so. Today, most large U.S. corporations are multinational firms with factories and other facilities overseas. Firms might expect to increase their profits through overseas operations for five main reasons:
To avoid tariffs or the threat of tariffs. Tariffs are taxes imposed by countries on imports from other countries. Sometimes firms establish factories in other countries to avoid having to pay tariffs.
2. To gain access to raw materials. Some U.S. firms have expanded abroad to secure supplies of raw materials. U.S. oil firms—beginning with Standard Oil in the late nineteenth century—have had extensive overseas operations aimed at discovering, recovering, and refining crude oil.
3. To gain access to low-cost labor. In recent decades, some U.S. firms have located factories or other facilities in countries such as China, India, Malaysia, and El Salvador to take advantage of the lower wages paid to workers in those countries.
4. To reduce exchange-rate risk. The exchange rate tells us how many units of foreign currency are received in exchange for a unit of domestic currency. Fluctuations in exchange rates can reduce the profits of a firm that exports goods to other countries. (We discuss this point in more detail in Economics, Chapter 28, Section 28.3 and in Macroeconomics, Chapter 18, Section 18.3.)
5. To respond to industry competition. In some instances, companies expand overseas as a competitive response to an industry rival. The worldwide competition for markets between Pepsi and Coke is an example of this kind of expansion.
All of these reasons, apart from 2., likely played a role in Tesla’s decision to build factories in China and Germany.
In 2021, Tesla was building a factory in Austin, Texas. It was also moving its corporate headquarters from California to Texas. With these actions, the firm may have been responding to lower taxes in Texas and lower housing costs for its workers.
In October 2021, Tesla’s $1 trillion stock market value seemed very high relative to the profits it was currently earning and also because it made Tesla’s value greater than the values of the next nine largest car makers combined. The price of its stock reflected the expectation among investors that Tesla’s profits would increase in future years. Tesla’s decisions about locating its new factories would play a key role in determining whether that expectation turns out to be correct.
Sources: Rebecca Elliott and Dave Sebastian, “Tesla Surpasses $1 Trillion in Market Value as Hertz Orders 100,000 Vehicles,” wsj.com, October 25, 2021; Al Root, “How Tesla Gained $175 Billion in Value From Hertz’s $4 Billion Order. It Makes Perfect Sense,” barrons.com, October 26, 2021; Bojan Pancevski and Jared S. Hopkins, “How Pfizer Partner BioNTech Became a Leader in Coronavirus Vaccine Race,” wsj.com, October 22, 2020; William Boston, “Tesla Awaits Green Light for Production in Germany,” wsj.com, October 12, 2021; Niraj Chokshi, “Tesla Will Move Its Headquarters to Austin, Texas, in Blow to California,” nytimes.com, October 13, 2021; and Alfred D. Chandler, Jr., The Visible Hand: The Managerial Revolution in American Business, Cambridge: Harvard University Press, 1977; and Tesla.com.
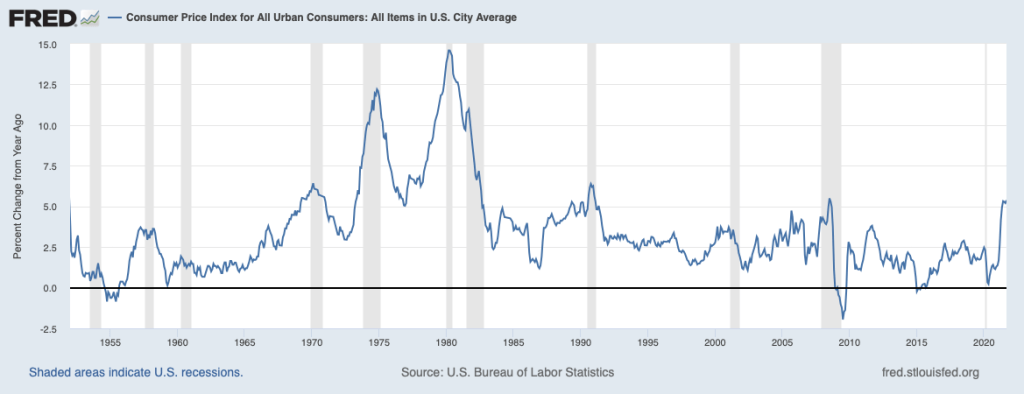
A recent publication by economists Regis Barnichon, Luiz E. Oliveira, and Adam H. Shapiro at the Federal Reserve Bank of San Francisco asks that provocative question. “The ‘60s” is a reference to the events that led to the U.S. economy experiencing more than 10 years of high inflation rates. Below is a graph similar to Chapter 15, Figure 15.1 in Macroeconomics (Economics, Chapter 25, Figure 25.1) that shows the inflation rate in the United States as measured by the percentage change in the Consumer Price Index (CPI) for each year since 1952. Economists call the years from 1968 though 1982 the “Great Inflation” because inflation was greater during that period than during any other period in the history of the United States.
As we discuss in Macroeconomics, Chapter 17, Section 17.2 (Economics, Chapter 27, Section 27.2), many economists believe that the Great Inflation began as a result of the Federal Reserve attempting to keep the unemployment rate below the natural rate of unemployment for a period of several years. As predicted by the Phillips Curve, the inflation rate increased and, as Milton Friedman and Edmund Phelps had argued would likely happen, the expected inflation rate eventually increased. The inflation was made worse during the 1970s by two supply shocks resulting from sharp increases in oil prices.
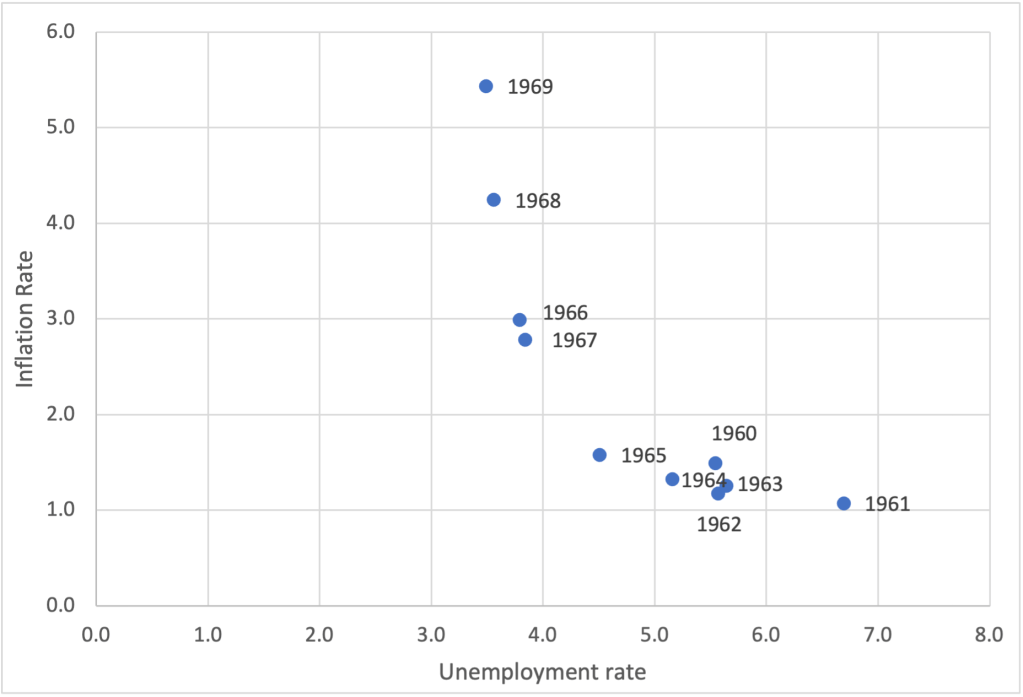
Is the United States on the edge of repeating the experience of the Great Inflation? Earlier this year, Olivier Blanchard of the Peterson Institute for International Economics wrote a paper arguing that the U.S. economy was at significant risk of experiencing a significant acceleration in inflation. His paper included a figure similar to the one below showing the combinations of inflation and unemployment during each year of the 1960s. The figure shows a substantial acceleration in inflation over the course of the decade.
Blanchard notes that:
“The history of the Phillips curve is one of shifts, largely due to the adjustment of expectations of inflation to actual inflation. True, expectations have [currently] been extremely sticky for a long time, apparently not reacting to movements in actual inflation. But, with such overheating, expectations might well deanchor. If they do, the increase in inflation could be much stronger.”
….
“If inflation were to take off, there would be two scenarios: one in which the Fed would let inflation increase, perhaps substantially, and another—more likely—in which the Fed would tighten monetary policy, perhaps again substantially. Neither of these two scenarios is ideal. In the first, inflation expectations would likely become deanchored, cancelling one of the major accomplishments of monetary policy in the last 20 years and making monetary policy more difficult to use in the future. In the second, the increase in interest rates might have to be very large, leading to problems in financial markets.”
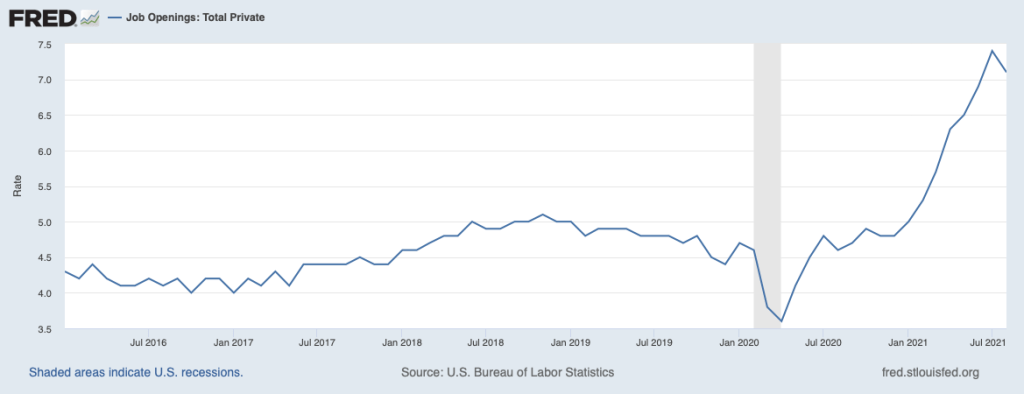
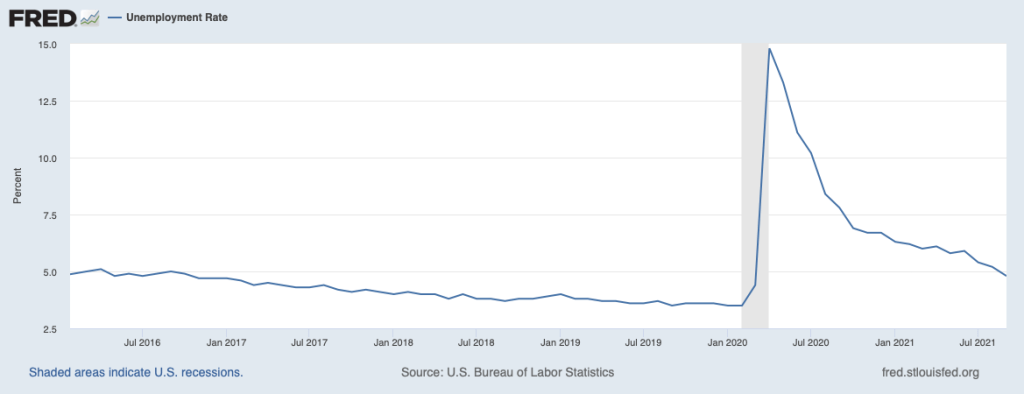
The authors of the San Francisco Fed publication are more optimistic. They begin their discussion by observing that because of the pandemic, the state of the labor market is more difficult to assess than in most years. They note that the unemployment rate of 4.8 percent in September 2021 was only slightly below the average unemployment rate over the past 30 years and well above the low unemployment rates of 2019 and early 2021. So, on the basis of the unemployment rate, policymakers at the Fed and in Congress might conclude that the inflation the U.S. economy is experiencing is not the result of overly tight labor markets such as those of the late 1960s. But the job openings rate(sometimes called the vacancy rate) is telling a different story. Job openings are positions that are both available to be filled within the next 30 days and for which firms are actively recruiting applicants from outside the firm. (According to the BLS: “The job openings rate is computed by dividing the number of job openings by the sum of employment and job openings and multiplying that quotient by 100.”)
The authors of the San Francisco Fed study note that “the vacancy rate is well above its 30-year average … and has surpassed its historic highs from the late 1960s … indicating that employers are having a difficult time filling positions. Confirming this high vacancy rate, the fraction of small businesses reporting that job openings are hard to fill is at historic highs ….” The figures below show the vacancy rate and the unemployment rate since January 2016.
The authors combine the unemployment rate and the vacancy rate into a statistic—the vacancy-to-unemployment ratio—that they demonstrate has historically done a better job of explaining movements in inflation than has the unemployment rate. They expect that expansionary fiscal policy will result in an increase in vacancy-to-unemployment ratio and, therefore, an increase in the inflation rate. But they share the view of Blanchard and many other economists that a key issue is “the stability of longer-run inflation expectations.”
We know that in the 1960s, several years of rising inflation made long-run inflation expectations unstable—in terms of the discussion in Chapter 17, the short-run Phillips curve shifted up. We don’t yet know what will happen to inflation expectations in late 2021 and in 2022, so we can’t yet tell how persistent current rates of inflation will be.
Sources: Regis Barnichon, Luiz E. Oliveira, and Adam H. Shapiro, “Is the American Rescue Plan Taking Us Back to the ’60s?,” FRBSF Economic Letter, No. 2021-27, October 18, 2021; Olivier Blanchard, “In Defense of Concerns over the $1.9 Trillion relief Plan,” piie.com, February 18, 2021; and Federal Reserve Bank of St. Louis.
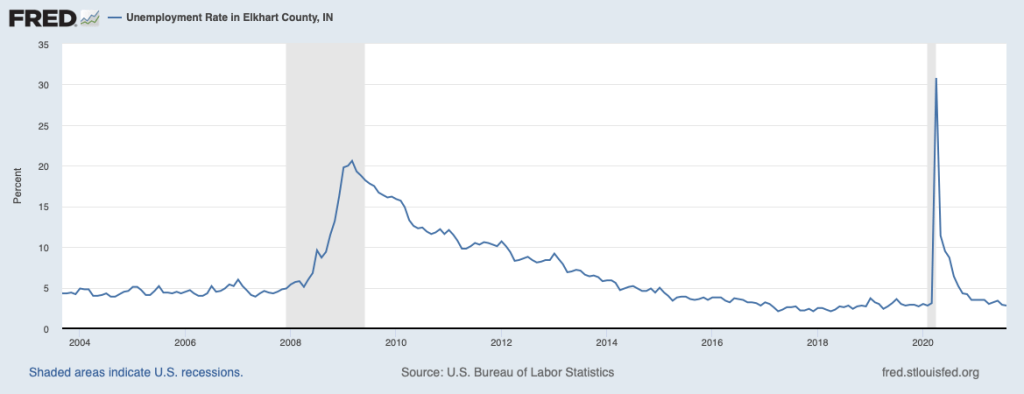
More than 80 percent of the recreational vehicles (RV) sold in the United States are manufactured in Elkhart County, Indiana. As we discuss in the opener to Chapter 22 in Economics (Chapter 12 in Macroeconomics), being dependent on sales of expensive durable goods like RVs means that the county is particularly vulnerable to the business cycle, with local firms experiencing rising sales during economic expansions and sharply falling sales during economic recessions. Accordingly, the unemployment rate in the county fluctuates much more during the business cycle than is typical—as shown in the above graph.
For example, during the Great Recession of 2007-2009, the unemployment rate in the country rose from a low of 3.9 percent in May 2007 to a high of 20 percent in March 2009, before declining during the following economic recovery. Just before the start of the Covid-19 recession of 2020, the unemployment rate in Elkhart was 2.8 percent. It then soared to 30.8 percent in April.
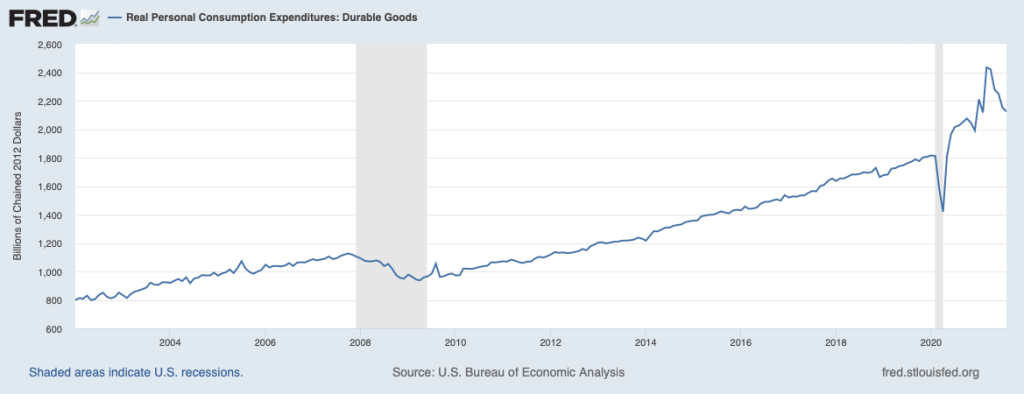
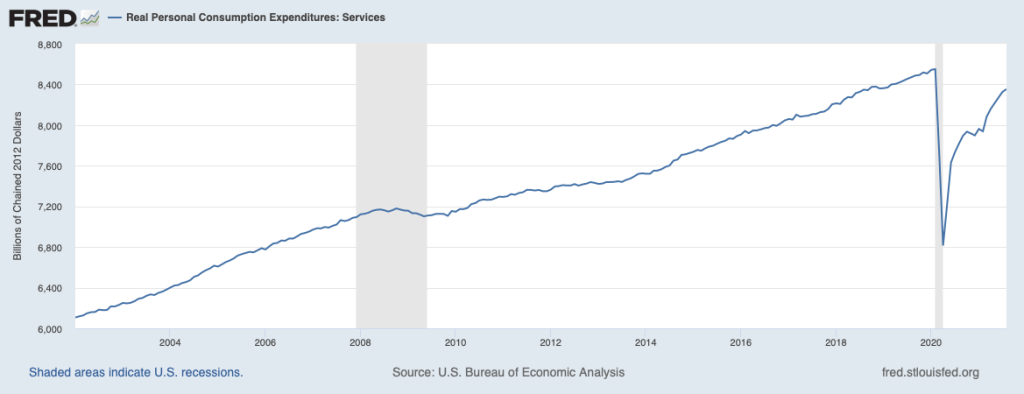
But, as we discuss in the chapter, the recovery from the 2020 recession was unusually rapid, although uneven. Many services industries, such as restaurants, gyms, and movie theaters continued to struggle well into 2021 as firms had difficulty attracting workers and as some consumers remained reluctant to spend time inside in close contact with other people. In contrast, consumer spending on durable goods was far above its pre-pandemic level, as well as being above the rate at which it had been growing during the years before the pandemic. The two graphs below show real consumer spending on durables and on services up through August 2021.
During 2021, sales of RVs through August were 50 percent higher than in the same period in 2020 and were on a pace to reach record annual sales. The success of the RV industry has led to rising incomes in Elkhart County, which, in turn, has allowed the area to attract other industries, including a logistics center that when completed will be the largest industrial building in Indiana and an Amazon warehouse that when completed will provide 1,000 new jobs. Rising incomes have also supported other businesses, such as community theaters, art galleries, and a recently reopened 1920s-era hotel.
In October 2021, the Wall Street Journal ranked Elkhart County first in its rating of metropolitan areas as measured by the index it compiles with realtor.com. The index “identifies the top metro areas for home buyers seeking an appreciating housing market and appealing lifestyle amenities.” If consumers continue to buy more goods and fewer services, it could be bad news for restaurants and other service industries, but good news for places like Elkhart that depend on goods-producing industries.
Sources: Nicole Friedman, “RV Capital of America Tops WSJ/Realtor.com Housing Index in Third Quarter,” wsj.com, October 19, 2021; Business Wire, “Amazon Announces New Robotics Fulfillment Center and Delivery Station in Elkhart County, Creating More Than 1,000 New, Full-Time Jobs,” businesswire.com, October 7, 2021; Construction Review Online, “Hotel Elkhart Grand Opening Celebrated in Elkhart, Indiana,” constructionreviewonline.com, October 4, 2021; Construction Review Online, “Elkhart County Logistics Facility to Bring about 1,000 jobs in Indiana,” constructionreviewonline.com, August 16, 2021; Federal Reserve Bank of St. Louis; and RV Industry Association.
In 2021, SPACs were the hottest trend on the stock market and had become the leading way for companies to go public. A public company is one with shares that trade on the stock market. Private firms make up more than 95 percent of all firms in the United States. Most will never become public firms because they will never grow large enough for investors to have sufficient information on the firms’ financial health to be willing to buy the firms’ stocks and bonds.
But some firms, particularly technology firms, grow rapidly enough that they are able to become public firms. Apple, Microsoft, Google, Uber, Facebook, Snap, and other firms have followed this path. When these firms went public, they did so using an initial public offering (IPO). (We briefly discuss IPOs in Economics and Microeconomics, Chapter 8, Section 8.2 and in Macroeconomics, Chapter 6, Section 6.2.) With an IPO, a firm uses one or more investment banks to underwrite the firm’s sales of new stocks or bonds to the public. In underwriting,investment banks typically guarantee a price for stocks or bonds to the issuing firm, sell the stocks or bonds in financial markets or directly to investors at a higher price, and keep the difference, known as the spread.
Beginning in 2020 and continuing through 2021, an increasing number of firms have used a different means of going public—merging with a SPAC. SPAC stands for special-purpose acquisition company and is a firm that holds only cash—it doesn’t sell a good or service—and only has the purpose of merging with another firm that wants to go public. Once a merger takes place, the acquired firm takes the place of the SPAC in the stock market. For instance, a SPAC named Diamond Eagle Acquisition merged with online sports betting site DraftKings in April 2020. Once the merger had been completed, DraftKings took Diamond Eagle’s place on the stock market, trading under the stock symbol DKNG. By 2021, the value of SPAC mergers had risen to being three times as much as the value of IPOs.
Some firms intending to go public prefer SPACs to traditional IPOs because they can bargain directly with the managers of the SPAC in determining the value of the firm. In addition, IPOs are closely regulated by the federal government’s Securities and Exchange Commission (SEC). In particular, the SEC monitors whether an investment bank is accurately stating the financial prospects of a firm whose IPO the bank is underwriting. The claims that SPACs make when attracting investors are less closely monitored. SPAC mergers can also be finalized more quickly than can traditional IPOs.
The experience of WeWork illustrates how some firms that have struggled to go public through an IPO have been able to do so by merging with a SPAC. Adam Neumann and Miguel McLevey founded WeWork in 2010 as a firm that would rent office space in cities, renovate the space, and then sub-lease it to other firms. In 2019, the firm prepared for an IPO that would have given the firm a total value of more than $40 billion. But doubts about the firm’s business model led to an indefinite postponement of the IPO and Neumann was forced out as CEO.
WeWork was reorganized under new CEO Sandeep Mathrani and went public in October 2021 by merging with BowX Acquisition Corporation, a SPAC. Although WeWork’s stock began trading (under stock symbol WE) at a price that put the firm’s value at about $9 billion—far below the value it expected at the time of its postponed IPO two years before—investors seemed optimistic about the firm’s future because its stock price rose sharply during the first two days it traded on the stock market.
Some policymakers are concerned that individual investors may not have sufficient information on firms that go public through a merger with a SPAC. Under one proposal being considered by Congress, financial advisers would only be allowed to recommend investing in SPACs to wealthy investors. The SEC is also considering whether new regulations governing SPACS were needed. Testifying before Congress, SEC Chair Gary Gensler sated: “There’s real questions about who’s benefiting [from firms going public using SPACs] and [about] investor protection.”
It remains to be seen whether SPACs will retain their current position as being the leading way for firms to go public.
Sources: Dave Sebastian, “WeWork Shares Rise on First Day of Trading, Two Years After Failed IPO,” wsj.com, October 21, 2021; Peter Santilli and Amrith Ramkumar, “SPACs Are the Stock Market’s Hottest Trend. Here’s How They Work,” wsj.com, March 29, 2021; Benjamin Bain, “SPAC Marketing Heavily Curtailed in House Democrats’ Draft Bill,” bloomberg.com, October 4, 2021; and Dave Michaels, “SEC Weighs New Investor Protections for SPACs,” wsj.com, May 26, 2021.
Beginning in the 1950s, several companies pioneered in developing modern shipping containers that once arrived at docks can be lifted by cranes and directly attached to trucks or loaded on to trains for overland shipping. As economist Marc Levinson was the first to discuss in detail in his 2004 book, The Box, container shipping, by greatly reducing transportation costs, helped to make the modern global economy possible. (We discuss globalization in Economics, Chapter 9, Section 9.1 and Chapter 21, Section 21.4, and in Macroeconomics, Chapter 7, Section 7.1 and Chapter 11, Section 11.4.)
Lower transportation costs meant that small manufacturing firms and other small businesses that depended on selling in local markets faced much greater competition, including from firms located thousands of miles away. The number of dockworkers declined dramatically as the loading and unloading of cargo ships became automated. Ports such as New York City, San Francisco, and Liverpool that were not well suited for handling containers because they lacked sufficient space for the automated equipment and the warehouses, lost most of their shipping business to other ports, such as Los Angeles, Seattle, and London. Consumers in all countries benefited because lower transportation costs meant they were able to buy cheaper imported goods and had a much greater variety of goods to choose from.
In the decades since the 1950s, shipping firms have continued to exploit economies of scale in container ships. (We discuss the concept of economies of scale in Econimics and Microeconomics, Chapter 11, Section 11.6.) Today, shipping containers have been standardized at either 20 feet or 40 feet long and the largest ships can haul thousands of containers. Levinson explains why economies of scale are important in this industry:
“A vessel to carry 3,000 containers did not require twice as much steel or twice as large an engine as a vessel to carry 1,500. [Because of automation, a] larger ship did not require a larger crew, so crew wages per container were much lower. Fuel consumption did not increase proportionally with the vessel’s size.”
To take advantage of these economies of scale, the ships needed to sail fully loaded. The largest ships can sail fully loaded only on routes where shipping volumes are highest, such as between Asia and the United States or between the United States and Europe. As a result, as Levinson notes, the largest ships are “uneconomic to run on most of the world’s shipping lanes” because on most routes the costs per container are higher for the largest ships for smaller ships. (Note that even these “smaller ships” are still very large in absolute size, being able to haul 1,000 containers.)
Large U.S. retail firms, such as Walmart, Home Depot, and Target rely on imported goods from Asian countries, including China, Japan, and Vietnam. Ordinarily, they are importing goods in sufficient quantities that the goods are shipped on the largest vessels, which today have the capacity to haul 20,000 containers. But during the pandemic, a surge in demand for imported goods combined with disruptions caused by Covid outbreaks in some Asian ports and a shortage of truck drivers and some other workers in the United States, resulted in a backlog of ships waiting to disembark their cargoes at U.S. ports. The ports of Los Angeles and Long Beach in southern California were particularly affected. By October 2021, it was taking an average of 80 days for goods to be shipped across the Pacific, compared with an average of 40 days before the pandemic.
Some large U.S. firms responded to the shipping problems by chartering smaller ships that ordinarily would only make shorter voyages. According to an article in the Wall Street Journal, “the charters provide the big retailers with a way to work around bottlenecks at ports such as Los Angeles, by rerouting cargo to less congested docks such as Portland, Ore., Oakland, Calif., or the East Coast.” Unfortunately, because the smaller ships lacked the economies of scale of the larger ships, the cost the U.S. firms were paying per container were nearly twice as high. (Note that this result is similar to the cost difference between a large and a small automobile factory, which we illustrated in Economics and Microeconomics, Figure 11.6.)
Unfortunately for U.S. consumers, the higher costs U.S. retailers paid for transporting goods across the Pacific Ocean resulted in higher prices on store shelves. Shopping for presents during the 2021 holiday season turned out to be more expensive than in previous years.
Sources: Marc Levinson, The Box: How the Shipping Container Made the World Smaller and the World Economy Bigger, Second edition, Princeton, NJ: Princeton University Press, 2016; Sarah Nassauer and Costas Paris, “Biggest U.S. Retailers Charter Private Cargo Ships to Sail Around Port Delays,” wsj.com, October 10, 2021; and Melissa Repko, “How Bad Are Global Shipping Snafus? Home Depot Contracted Its Own Container Ship as a Safeguard,” cnbc.com, June 13, 2021.
In this chapter, we have studied several types of elasticities, starting with the price elasticity of demand. Elasticity is a general concept that economists use to measure the effect of a change in one variable on another variable. An example of a more general use of elasticity, beyond the uses we discussed in this chapter, appears in a new academic paper written by Anne Sofie Tegner Anker of the University of Copenhagen, Jennifer L. Doleac of Texas A&M University, and Rasmus LandersØ of Aarshus University.
The authors are interested in studying the effects of crime deterrence. They note that rational offenders will be deterred by government policies that increase the probability that an offender will be arrested. Even offenders who don’t respond rationally to an increase in the probability of being arrested will still commit fewer crimes because they are more likely to be arrested. Governments have different policies available to reduce crime. Given that government resources are scarce, efficient allocation of resources requires policymakers to choose policies that provide the most deterrence per dollar of cost.
The authors note “we currently know very little about precisely how much deterrence we achieve for any given increase in the likelihood that an offender is apprehended.” They attempt to increase knowledge on this point by analyzing the effects of a policy change in Denmark in 2005 that made it much more likely that an offender would have his or her DNA entered into a DNA database: “The goal of DNA registration is to deter offenders and increase the likelihood of detection of future crimes by enabling matches of known offenders with DNA from crime scene evidence.”
The authors find that the expansion of Denmark’s DNA database had a substantial effect on recidivism—an offender committing additional crimes—and on the probability that an offender who did commit additional crimes would be caught. They estimate that “a 1 percent higher detection probability reduces crime by more than 2 percent.” In other words, the elasticity of crime with respect to the detection probability is −2.
Just as the price elasticity of demand gives a business manager a useful way to summarize the responsiveness of the quantity demanded of the firm’s product to a change in its price, the elasticity the authors estimated gives a policymaker a useful way to summarize the responsiveness of crime to a policy that increases the probability of catching offenders.
Source: Anne Sofie Tegner Anker, Jennifer L. Doleac, and Rasmus LandersØ, “The Effects of DNA Databases on the Deterrence and Detection of Offenders,” American Economic Journal: Applied Economics, Vol. 13, No. 4, October 2021, pp. 194-225.
As we discuss in the chapter, initially, bitcoin was thought of as a way to buy and sell goods and services. Some stores accepted bitcoin and allowed customers to make payment by scanning a bar code with a phone. Some websites offered merchants a way to process purchases made with bitcoins in a manner similar to the way merchants process credit card payments.
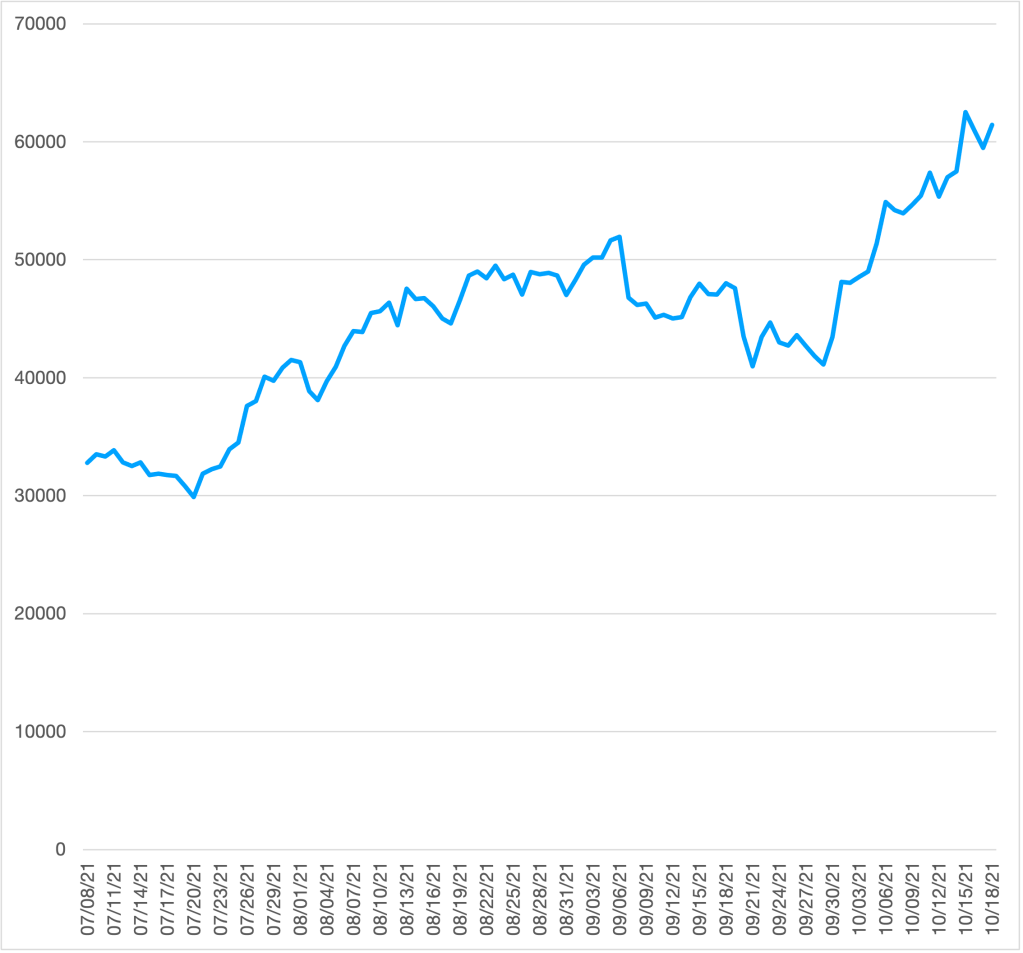
In practice, though, swings in the value of bitcoin have been much too large to make it a good substitute for cash, checks, or credit cards in everyday transactions. For instance, at the beginning of 2015, one bitcoin was worth about $300. Over the following five years, the price of bitcoin rose as high at $17,000 before falling to about $8,000 at the beginning of 2020. During 2021, the volatility of bitcoin prices increased, rising as high as $62,000 in April and falling as low as $30,000 in July before rising back above $60,000 in October. (The following chart shows movements in the price of bitcoin from early July to mid-October 2021; the vertical axis shows the price as dollars per bitcoin.)
Some economists have suggested that rather being a medium of exchange, like dollar bills, bitcoin has become a speculative asset, like gold. Bitcoin shares with gold the characteristic that ultimately its total supplied is limited. The supply of Bitcoin can’t increase beyond 21 million, a limit that is expected to be reached in 2030. The gold stock slowly increases as mines produce more gold, although the output of mines is small compared with the existing stock of gold. Some investors and speculators are reassured that, in contrast to the assets in M1 and M2 that can increase as much as the Fed chooses, gold and bitcoin have limits on how much they can increase.
Will Bitcoin Be a Good Hedge Against Inflation? Can It Be Useful in Diversifying a Portfolio?
Some investors and speculators believe that the limited quantities of gold and bitcoin available make them good hedges against inflation—that is, they believe that the prices of gold and bitcoin will reliably increase during periods of inflation. In fact, though, gold has proven to be a poor hedge against inflation because in the long run the price of gold has not reliably increased faster than the inflation rate. There is no good economic reason to expect that over the long run bitcoin would be a good inflation hedge either.
From a broader perspective than as just an inflation hedge, some economists argue that gold has a role to play in an investor’s portfolio—which is the collection of assets, such as stocks and bonds, that an investor owns. Investors can reduce the financial risk they face through diversification, or spreading their wealth among different assets. For instance, an investor who only holds Apple stock in her portfolio is subject to more risk than an investor with the same dollar amount invested in a portfolio that holds the stocks of multiple firms as well as non-stock investments. An investor obtains the benefits of diversification best by adding assets to her portfolio that are not well correlated with the assets she already owns—that is the prices of the assets she adds to her portfolio don’t typically move in the same direction as the prices of the assets she already owns.
For instance, during a typical recession sales of consumer staples, like baby diapers and laundry detergent, hold up well, while sales of consumers durables, like automobiles, usually decline significantly. So adding shares of stock in Proctor & Gamble to a portfolio that already has many shares of General Motors achieves diversification and reduces financial risk because movements in the price of shares of Proctor & Gamble are likely not to be highly correlated with movements in the price of shares of General Motors.
Studies have shown that during some periods movements in gold prices are not correlated with movements in prices of stocks or bonds. In other words, gold prices may rise during a period when stock prices are declining. As a result, an investor may want to add gold to her portfolio to diversify it. To this point, bitcoin hasn’t been around long enough to draw firm conclusions about whether adding bitcoin to a portfolio provides significant diversification, although some investors believes that it does.
Finance professionals are divided in their opinions on whether bitcoin is a good substitute for gold in a financial portfolio. In an interview, billionaire investor Ray Dalio, founder of Bridgewater Associates, the world’s hedge fund, noted that while he believes that bitcoin may serve as a hedge against inflation, but if he could only hold gold or bitcoin, “I would choose gold.” His preference for gold is due in part to his belief that the federal government may increase regulation of bitcoin and that regulators might eventually even decide to ban it. A businessinsider.com survey of 10 financial experts found them divided with five preferring gold as an investment and five preferring bitcoin.
Sources: Jade Scipioni, “Bitcoin vs. Gold: Here’s What Billionaire Ray Dalio Thinks,” cnbc.com, August 4, 2021; and Isabelle Lee and Will Daniel, “Bitcoin vs. Gold: 10 Experts Told Us Which Asset They’d Rather Hold for the Next 10 Years, and Why,” businessinsider.com, February 20, 2021.
Authors Glenn Hubbard and Tony O’Brien discuss the economic impact of the recent infrastructure bill and what role fiscal policy plays in determining shovel-ready projects. Also, they explore the vast impact of the economy-wide supply-chain issues and the challenges companies face. Until the pandemic, we had a very efficient supply chain but now we’re seeing companies employ the “just-in-case” inventory method vs. “just-in-time”!