
The term “sticker shock” was first used during the 1970s to describe the surprise car buyers experienced when seeing how much car prices had risen. Because inflation during that decade was so high, anyone who hadn’t bought a car for several years was unprepared for the jump in car prices. During 2020 and 2021, sticker shock returned, particularly to the used car market. Prices were increasing so rapidly that even people who had purchased a car a year or two before were surprised by the increases.
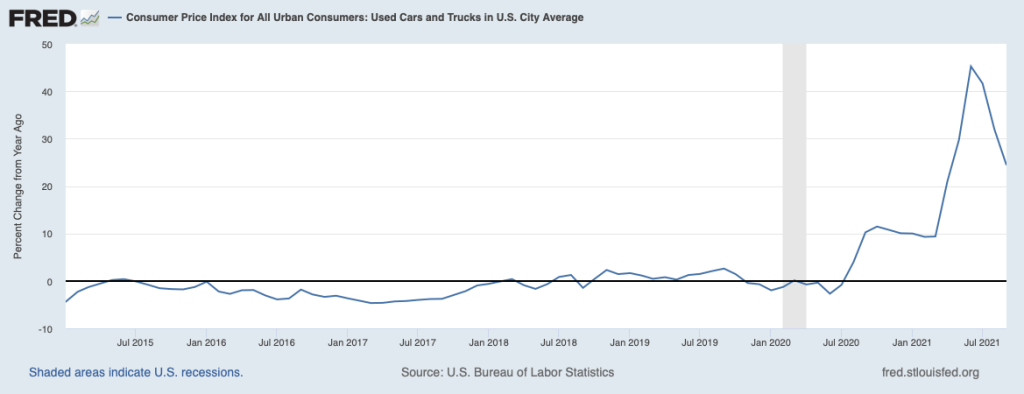
The following graph shows U.S. Bureau of Labor Statistics (BLS) data on inflation in the market for used cars in the months since January 2015. Inflation is measured as the percent change from the same month in the previous year in the used cars and trucks component of the Consumer Price Index (CPI). The CPI is the most widely used measure of inflation. Used car prices began rising in August 2020, peaking at a 45 percent increase in June 2021. Inflation at such rates over a period longer than a year is very unusual in any of components of the CPI.
What explains the extraordinary burst of inflation in used car prices during 2020 and 2021? Three factors seem to have been of greatest importance:
- A decline in the supply of new cars resulting from a shortage in semiconductors caused an increase in new car prices. Rising new car prices led some consumers who would otherwise have bought a new car to enter the used car market, increasing the demand for used cars.
- Because of the Covid-19 pandemic, some people became reluctant to ride buses and other mass transit, increasing the demand for both new and used cars.
- As the pandemic increased in severity in the spring of 2020, most rental car companies decided to purchase fewer new cars for their fleets. After keeping a car in its fleet for one year, rental car companies typically sell the car to used car dealers for resale. Because rental car companies were selling them fewer cars, used car dealers had fewer cars on their lots. So the supply of used cars declined.
We can use the demand and supply model to explain the jump in used car prices. As shown in the following figure, the demand curve for used cars shifted to the right from D1 to D2, as some consumers who would otherwise have bought new cars, bought used cars instead, and as some people swithced from public transportation to driving their cars to work. At the same time, the supply of used cars shifted to the left from S1 to S2 because used car dealers were able to buy fewer used cars from rental car companies. The result was that the price of used cars rose from P1 to P2 at the same time that the quantity of used cars sold fell from Q1 to Q2.

Sources: Yueqi Yang, “U.S. Used-Car Prices, Key Inflation Driver, Surge to Record,” bloomberg.com, October 7, 2021; Nora Naughton, “Looking to Buy a Used Car? Expect High Prices, Few Options,” wsj.com, May 10, 2021; Cox Automotive, “13-Month Rolling Used-Vehicle SAAR,” coxautoinc.com, October 15, 2021; and Federal Reserve Bank of St. Louis.
