Image created by ChatGPT
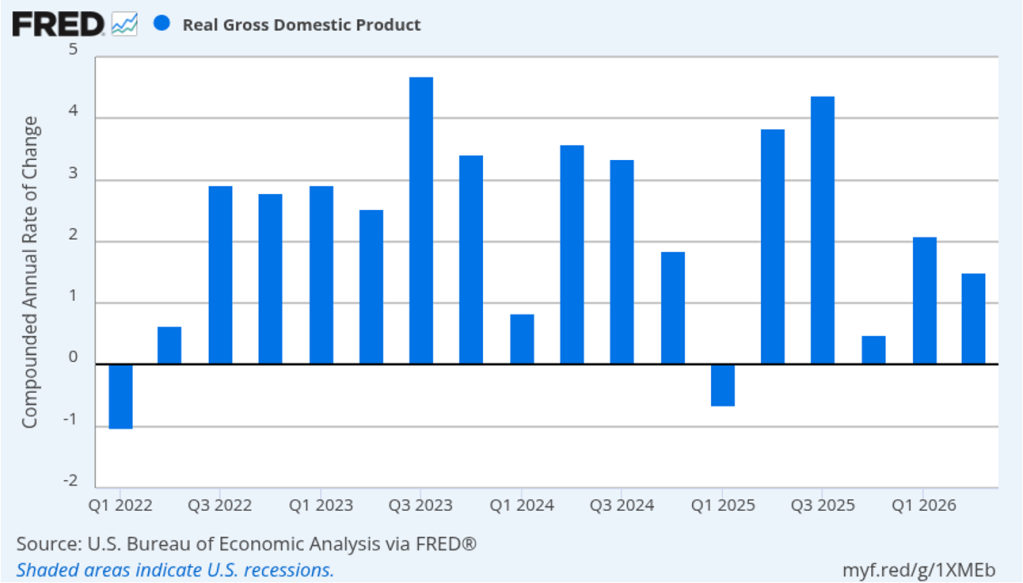
The Bureau of Economic Analysis (BEA) released two reports this morning (July 30): “GDP (Advance Estimate), 2nd Quarter 2026” and “Personal Income and Outlays, June 2026.” The BEA’s initial—or advance—estimate is that real GDP grew in the second quarter of 2026 at annual rate of 1.5 percent, down from an annual rate of 2.1 percent in the first quarter. Economists surveyed by the Wall Street Journal had forecast that real GDP would grow at a rate of 1.8 percent in the second quarter. The following figure shows the BEA’s estimated rates of real GDP growth in each quarter beginning with the first quarter of 2022.
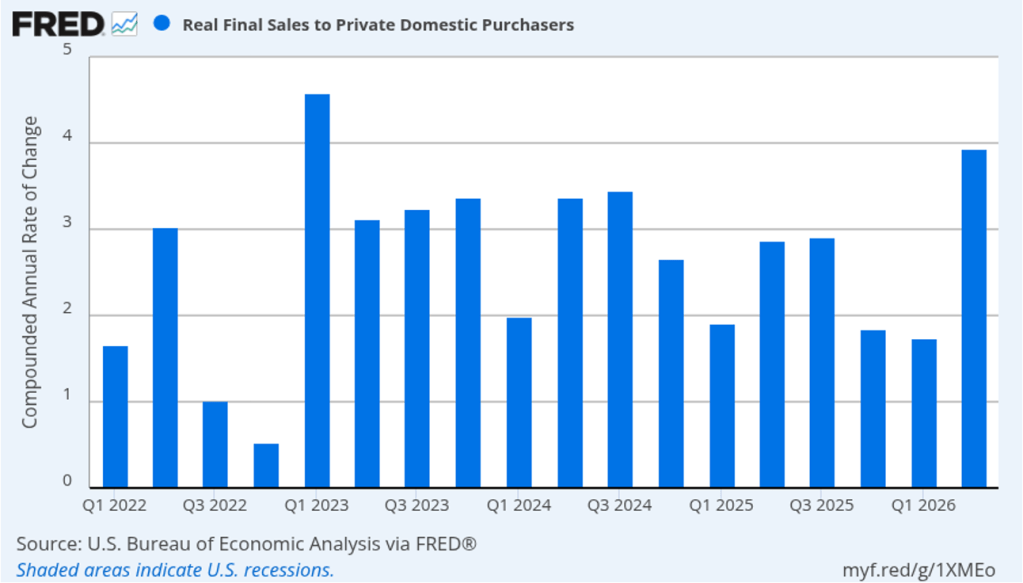
As we’ve discussed in previous blog posts, to better gauge the state of the economy, policymakers—including former Fed Chair Jerome Powell—often prefer to strip out the effects of imports, inventory investment, and government expenditures—which can be volatile—by looking at real final sales to private domestic purchasers, which includes only spending by U.S. households and firms on domestic production. As the following figure shows, real final sales to domestic purchasers increased at an annual rate of 3.9 percent in the second quarter, more than twice the rate of growth of real GDP, as well as far above the U.S. economy’s expected long-run annual real growth rate of 1.8 percent. So growth in real final sales to domestic purchasers indicates that the U.S. economy is expanding rapidly, as opposed to the much weaker growth shown by real GDP data. Typically, growth in real final sales to domestic purchasers is steadier than growth in real GDP and is likely a better indicator of the underlying growth rate in the economy.
There has been much discussion in the media of the surge in spending on new data centers to power artificial intelligence programs. This surge is reflected in following figure, which shows real domestic investment in information processing equipment. This category of investment spending has increased more than 40 percent since the fourth quarter of 2024.

The BEA’s “Personal Income and Outlays” report this morning included monthly data on the personal consumption expenditures (PCE) price index. The Fed relies on annual changes in the PCE price index to evaluate whether it’s meeting its 2 percent annual inflation target. As we noted in a blog post yesterday, Fed Chair Kevin Warsh indicated in his press conference following the meeting of the Federal Open Market Committee (FOMC) that the committee intended to continue using the PCE price index as its gauge of inflation, although that decision would be revisited early next year. Warsh may have intended this statement to reassure financial markets that there would be continuity in the Fed’s measure of inflation. However, some investors appear to have interpreted Warsh’s statement that the decision would be revisited next year as an indication that he favored moving to a measure that would show lower rates of inflation than those shown by the PCE.
In other words, some investors believe that in the future the FOMC might be willing to accept higher levels of PCE inflation. Perhaps in response to this interpretation, the yield on the 30-year U.S. Treasury bond rose to its highest level since 2007. Higher expected inflation can lead to lower bond prices and higher bond yields. (We discuss this point in Money, Banking, and the Financial System, Chapter 5, which is now available in a new edition.)
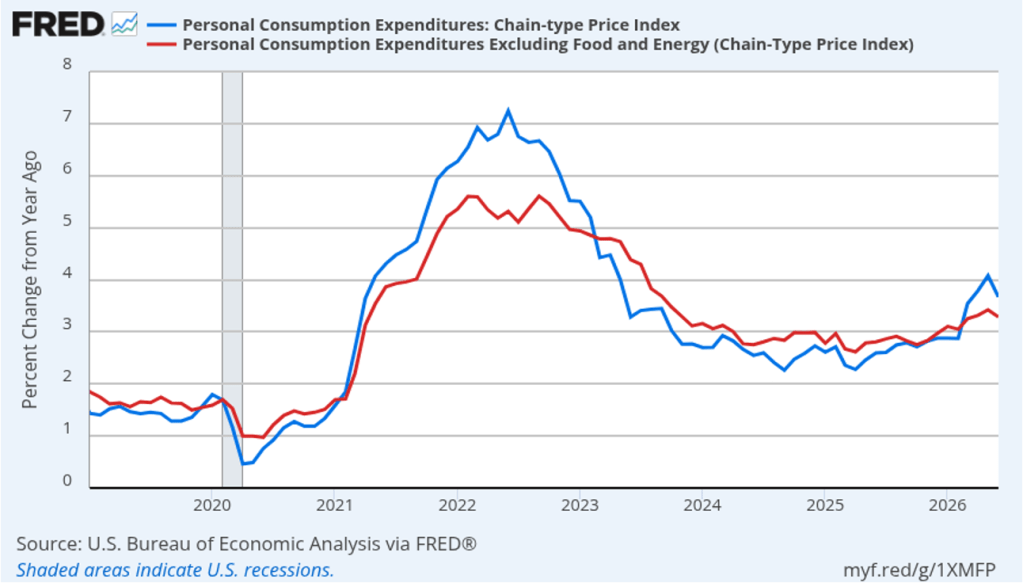
The following figure shows headline PCE inflation (the blue line) and core PCE inflation (the red line)—which excludes energy and food prices—for the period since January 2019, with inflation measured as the percentage change in the PCE from the same month in the previous year. In June, headline PCE inflation was 3.7 percent, down from 4.1 percent in May. Core PCE inflation in June was 3.3 percent, down slightly from 3.4 percent in May. Headline and core PCE inflation were both equal to the forecasts of economists surveyed by the Wall Street Journal. Both headline PCE inflation and core PCE inflation remain well above the Fed’s 2 percent annual inflation target.
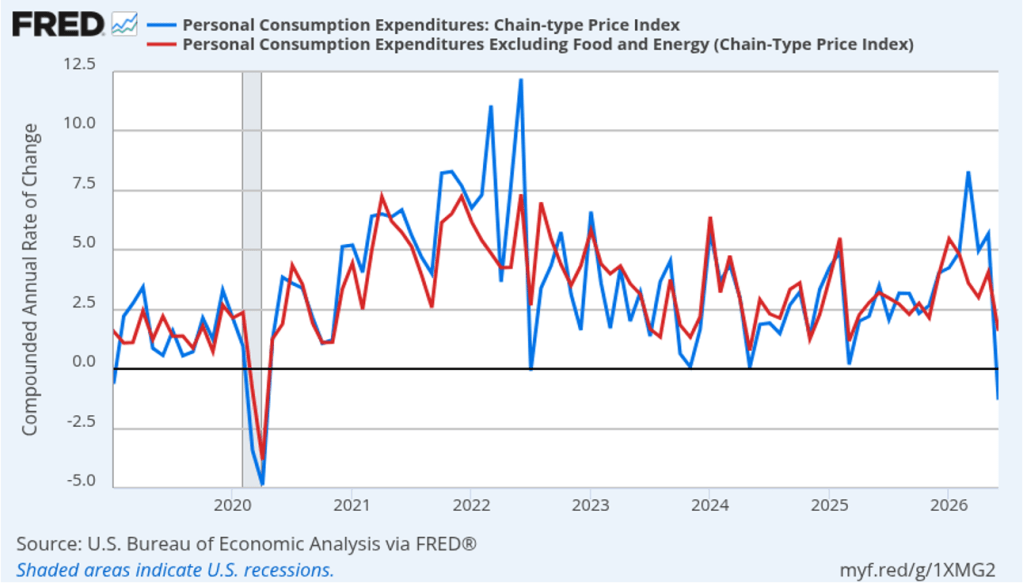
The following figure shows monthly PCE inflation and monthly core PCE inflation calculated by compounding the current month’s rate over an entire year. (Often referred to as 1-month inflation.) Measured this way, headline PCE inflation declined from 5.7 percent in May to –1.3 percent in June; in other words, consumer prices fell in June. Core PCE inflation fell from 4.1 in May to 1.6 percent in June. Even leaving aside the effect of falling gasoline prices on headline PCE, these data show that in June there was a noticeable deceleration in inflation. Of course, it’s important not to overinterpret the data from a single month.
Former Fed Chair Jerome Powell frequently mentioned that inflation in non-market services can skew PCE inflation. Non-market services are services whose prices the BEA imputes rather than measures directly. For instance, the BEA assumes that prices of financial services—such as brokerage fees—vary with the prices of financial assets. So that if stock prices rise, the prices of financial services included in the PCE price index also rise. Powell has argued that these imputed prices “don’t really tell us much about … tightness in the economy. They don’t really reflect that.” The following figure shows 12-month headline inflation (the blue line) and 12-month core inflation (the red line) for market-based PCE. (The BEA explains the market-based PCE measure here.)
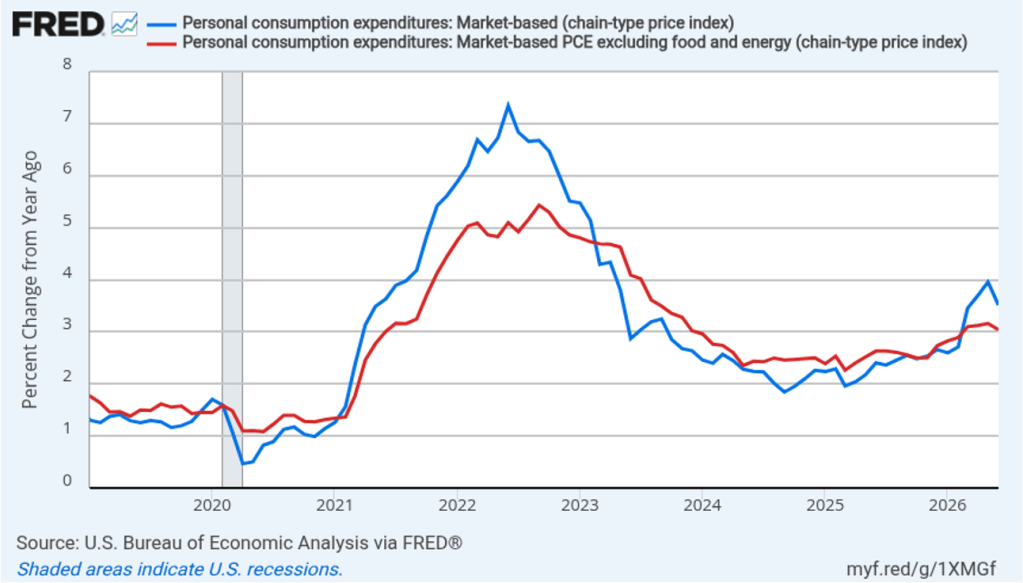
Headline market-based PCE inflation was 3.5 percent in May, down from 4.0 percent in May. Core market-based PCE inflation was 3.0 percent in June, down from 3.2 percent in May. So, both market-based measures, although lower than the full PCE measures, show inflation in June remaining well above the Fed’s 2 percent target.
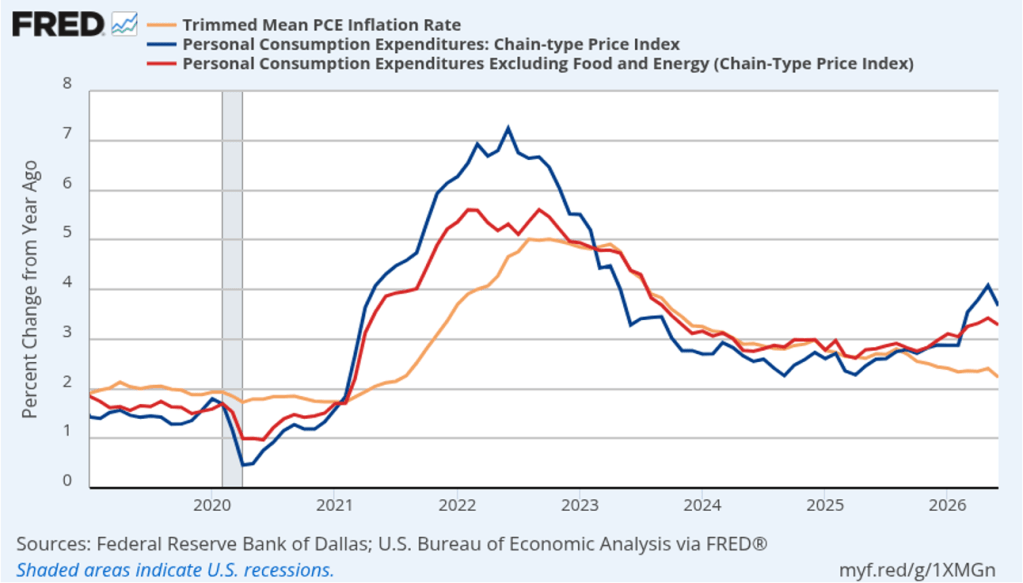
Fed Chair Kevin Warsh argued in testimony at his confirmation hearing before the Senate that the Fed should stop relying on headline PCE inflation: “The measures [of inflation] I prefer are looking at things that are called trimmed averages. We take out all of the tail-risks, all of the one-off items, and we ask ourselves whether the generalized change in prices is having second-order effects on the economy.”
Trimmed-mean PCE inflation drops the 31 percent of goods and services with the highest inflation rates and the 24 percent of goods and services with the lowest inflation rates. A closely related measure, median PCE inflation, is calculated by listing the inflation rate in each individual good or service included in the PCE and identifying the inflation rate of the good or service that is in the middle of the list—that is, the inflation rate in the price of the good or service that has an equal number of higher and lower inflation rates.
The following figure shows headline PCE inflation the (blue line), core PCE inflation (the red line) and trimmed-mean PCE inflation (the brown line). Trimmed-mean PCE inflation in June was 2.2 percent, well below both headline and core PCE inflation.
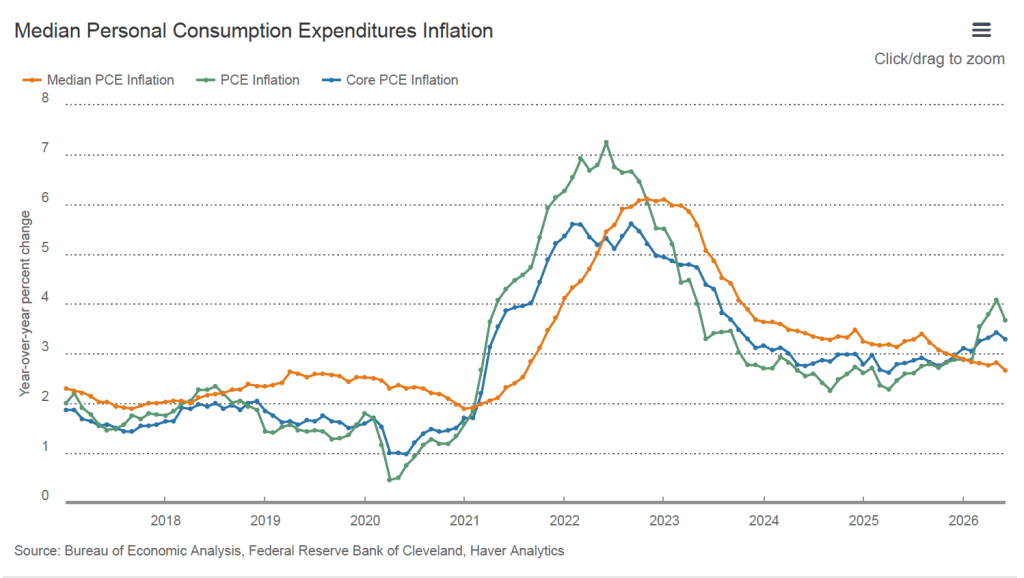
The following figure from the web site of the Federal Reserve Bank of Cleveland shows headline PCE inflation (the green line), core PCE inflation (the blue line), and median PCE inflation (the brown line). In June, median PCE inflation was 2.7 percent, also below both headline and core inflation. So Warsh has a point that these two measures of inflation, which are less affected by particularly high or low rates of inflation in some goods and services, indicate that inflation has been running below the Fed’s currently preferred measure. But these measures also show inflation still running well above the Fed’s 2 percent annual inflation target.
Today’s macro data releases appear to have reinforced the view of investors who buy and sell federal funds futures contracts that the FOMC will raise its target for the federal funds rate by o.25 at its meeting on September 15–16. That probability increased from 58.3 percent yesterday to 65.4 percent this afternoon.