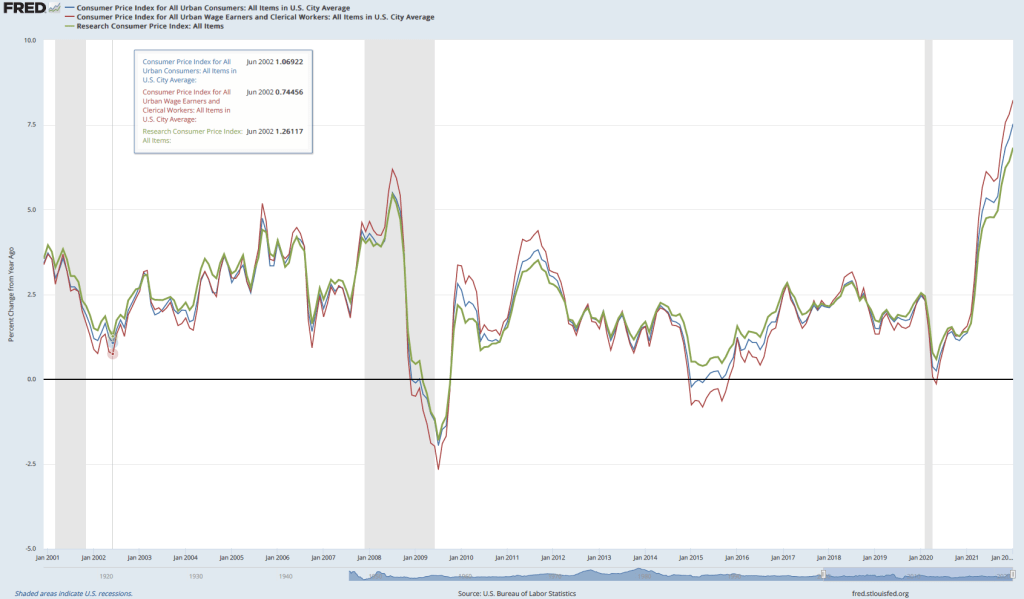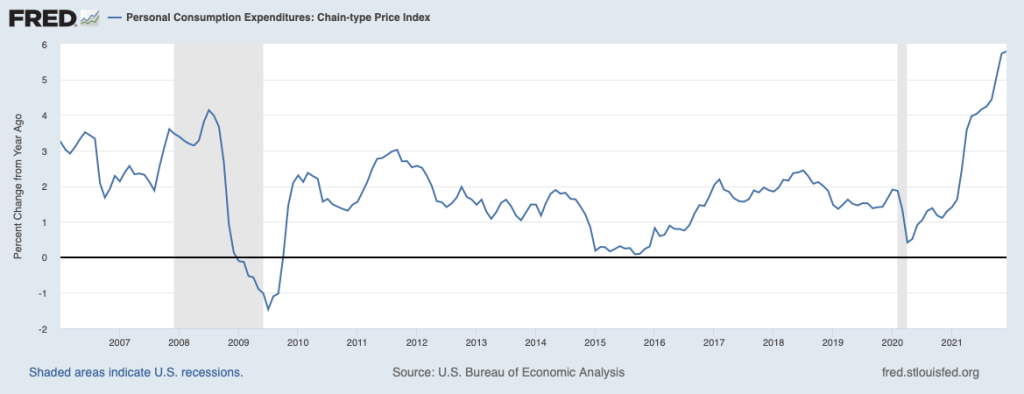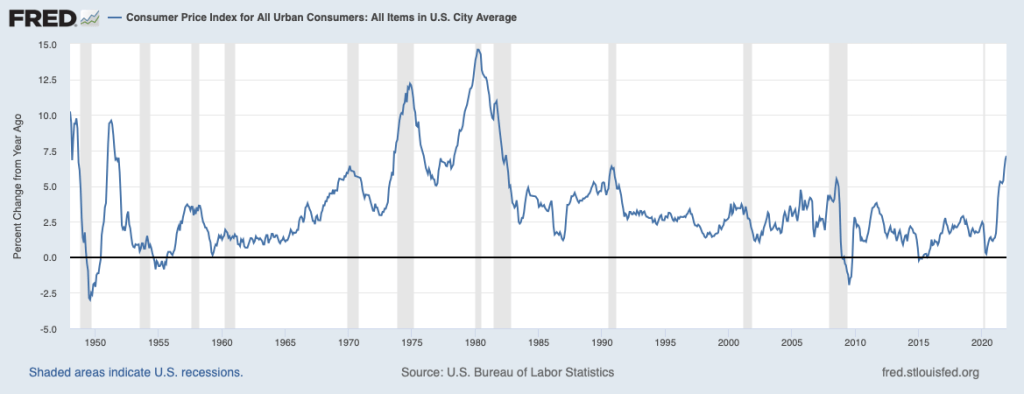
Inflation as measured by the percentage change in the consumer price index (CPI) from the same month in the previous year was 7.9 percent in February 2022, the highest rate since January 1982—near the end of the Great Inflation that began in the late 1960s. The following figure shows inflation in the new motor vehicle component of the CPI. The 12.4 percent increase in new car prices was the largest since April 1975.

The increase in new car prices was being driven partly by increases in aggregate demand resulting from the highly expansionary monetary and fiscal policies enacted in response to the economic disruptions caused by the Covid-19 pandemic, and partly from shortages of semiconductors and some other car components, which reduced the supply of new cars.
As the following figure shows, inflation in used car prices was even greater. With the exception of June and July of 2021, the 41.2 percent increase in used car prices in February 2022 was the largest since the Bureau of Labor Statistics began publishing these data in 1954.

Because used cars are a substitute of new cars, rising prices of new cars caused an increase in demand for used cars. In addition, the supply of used cars was reduced because car rental firms, such as Enterprise and Hertz, had purchased fewer new cars during the worst of the pandemic and so had fewer used cars to sell to used car dealers. Increased demand and reduced supply resulted in the sharp increase in the price of used cars.
Another factor increasing the prices consumers were paying for cars was a reduction in bargaining—or haggling—over car prices. Traditionally, most goods and services are sold at a fixed price. For example, some buying a refrigerator usually pays the posted price charged by Best Buy, Lowes, or another retailer. But houses and cars have been an exception, with buyers often negotiating prices that are lower than the seller was asking.
In the case of automobiles, by federal law, the price of a new car has to be posted on the car’s window. The posted price is called the Manufacturer’s Suggested Retail Price (MSRP), often referred to as the sticker price. Typically, the sticker price represents a ceiling on what a consumer is likely to pay, with many—but not all—buyers negotiating for a lower price. Some people dislike the idea of bargaining over the price of a car, particularly if they get drawn into long negotiations at a car dealership. These buyers are likely to pay the sticker price or something very close to it.
As a result, car dealers have an opportunity to practice price discrimination: They charge buyers whose demand for cars is more price elastic lower prices and buyers whose demand is less price elastic higher prices. The car dealers are able to separate the two groups on the basis of the buyers willingness to haggle over the price of a car. (We discuss price discrimination in Microeconomics and Economics, Chapter 15, Section 15.5.) Prior to the Covid-19 pandemic, the ability of car dealers to practice this form of price discrimination had been eroded by the availability of online car buying services, such as Consumer Reports’ “Build & Buy Service,” which allow buyers to compare competing price offers from local car dealers. There aren’t sufficient data to determine whether using an online buying service results in prices as low as those obtained by buyers willing to haggle over price face-to-face with salespeople in dealerships.
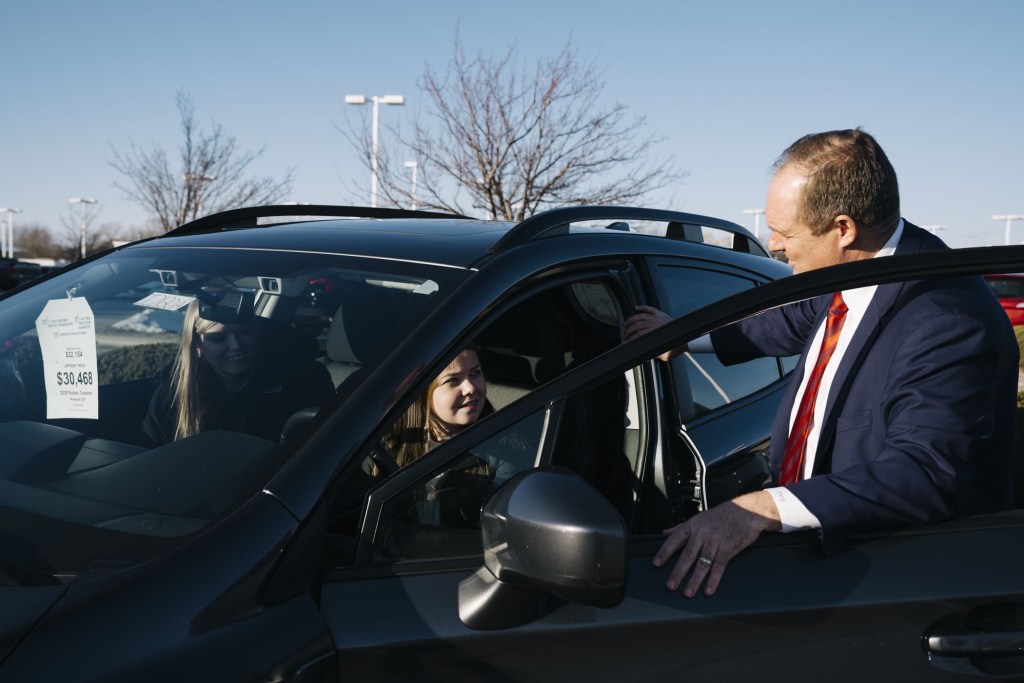
In any event, in 2022 most car buyers were faced with a different situation: Rather than serving as a ceiling on the price, the MSRP, had become a floor. That is, many buyers found that given the reduced supply of new cars, they had to pay more than the MSRP. As one buyer quoted in a Wall Street Journal article put it: “The rules have changed so dramatically…. [T]he dealer’s position is ‘This is kind of a take-it-or-leave-it proposition.’” According to the website Edmunds.com, in January 2021, only about 3 percent of cars were sold in the United States for prices above MSRP, but in January 2022, 82 percent were.
Car manufacturers are opposed to dealers charging prices higher than the MSRP, fearing that doing so will damage the car’s brand. But car manufacturers don’t own the dealerships that sell their cars. The dealerships are independently owned businesses, a situation that dates back to the beginning of the car industry in the early 1900s. Early automobile manufacturers, such as Henry Ford, couldn’t raise sufficient funds to buy and operate a nationwide network of car dealerships. The manufacturers often even had trouble financing the working capital—or the funds used to finance the daily operations of the firm—to buy components from suppliers, pay workers, and cover the other costs of manufacturing automobiles.
The manufacturers solved both problems by relying on a network of independent dealerships that would be given franchises to be the exclusive sellers of a manufacturer’s brand of cars in a given area. The local businesspeople who owned the dealerships raised funds locally, often from commercial banks. Manufacturers generally paid their suppliers 30 to 90 days after receiving shipments of components, while requiring their dealers to pay a deposit on the cars they ordered and to pay the balance due at the time the cars were delivered to the dealers. One historian of the automobile industry described the process:
The great demand for automobiles and the large profits available for [dealers], in the early days of the industry … enabled the producers to exact substantial advance deposits of cash for all orders and to require cash payment upon delivery of the vehicles …. The suppliers of parts and materials, on the other hand, extended book-account credit of thirty to ninety days. Thus the automobile producer had a month or more in which to assemble and sell his vehicles before the bills from suppliers became due; and much of his labor costs could be paid from dealers’ deposits.
The franchise system had some drawbacks for car manufacturers, however. A car dealership benefits from the reputation of the manufacturer whose cars it sells, but it has an incentive to free ride on that reputation. That is, if a local dealer can take an action—such as selling cars above the MSRP—that raises its profit, it has an incentive to do so even if the action damages the reputation of Ford, General Motors, or whichever firm’s cars the dealer is selling. Car manufacturers have long been aware of the problem of car dealers free riding on the manufacturer’s reputation. For instance, in the 1920s, Ford sent so-called road men to inspect Ford dealers to check that they had clean, well-lighted showrooms and competent repair shops in order to make sure the dealerships weren’t damaging Ford’s brand.
As we discuss in Microeconomics and Economics, Chapter 10, Section 10.3, consumers often believe it’s unfair of a firm to raise prices—such as a hardware store raising the prices of shovels after a snowstorm—when the increases aren’t the result of increases in the firm’s costs. Knowing that many consumers have this view, car manufacturers in 2022 wanted their dealers not to sell cars for prices above the MSRP. As an article in the Wall Street Journal put it: “Historically, car companies have said they disapprove of their dealers charging above MSRP, saying it can reflect poorly on the brand and alienate customers.”
But the car manufacturers ran into another consequence of the franchise system. Using a franchise system rather than selling cars through manufacturer owned dealerships means that there are thousands of independent car dealers in the United States. The number of dealers makes them an effective lobbying force with state governments. As a result, most states have passed state franchise laws that limit the ability of car manufacturers to control the actions of their dealers and sometimes prohibit car manufacturers from selling cars directly to consumers. Although Tesla has attained the right in some states to sell directly to consumers without using franchised dealers, Ford, General Motors, and other manufacturers still rely exclusively on dealers. The result is that car manufacturers can’t legally set the prices that their dealerships charge.
Will the situation of most people paying the sticker price—or more—for cars persist after the current supply chain problems are resolved? AutoNation is the largest chain of car dealerships in the United States. Recently, Mike Manley, the firm’s CEO, argued that the substantial discounts from the sticker price that were common before the pandemic are a thing of the past. He argued that car manufacturers were likely to keep production of new cars more closely in balance with consumer demand, reducing the number of cars dealers keep in inventory on their lots: “We will not return to excessively high inventory levels that depress new-vehicle margins.”
Only time will tell whether the situation facing car buyers in 2022 of having to pay prices above the MSRP will persist.
Sources: Mike Colias and Nora Eckert, “A New Brand of Sticker Shock Hits the Car Market,” Wall Street Journal, February 26, 2022; Nora Eckert and Mike Colias, “Ford and GM Warn Dealers to Stop Charging So Much for New Cars,” Wall Street Journal, February 9, 2022; Gabrielle Coppola, “Car Discounts Aren’t Coming Back After Pandemic, AutoNation Says,” bloomberg.com, February 9, 2022; cr.org/buildandbuy; Lawrence H. Seltzer, A Financial History of the American Automobile Industry, Boston: Houghton-Mifflin, 1928; and Federal Reserve Bank of St. Louis.