In today’s episode, Glenn Hubbard and Tony O’Brien take on three timely topics that are shaping economic conversations across the country. They begin with a discussion on tariffs, exploring how recent trade policies are influencing prices, production decisions, and global relationships. From there, they turn to the independence of the Federal Reserve Bank, explaining why central bank autonomy is essential for sound monetary policy and what risks arise when political pressures creep in. Finally, they shed light on the Bureau of Labor Statistics (BLS), unpacking how its data collection and reporting play a vital role in guiding both public understanding and policymaking.
It’s a lively and informative conversation that brings clarity to complex issues—and it’s perfect for students, instructors, and anyone interested in how economics connects to the real world.
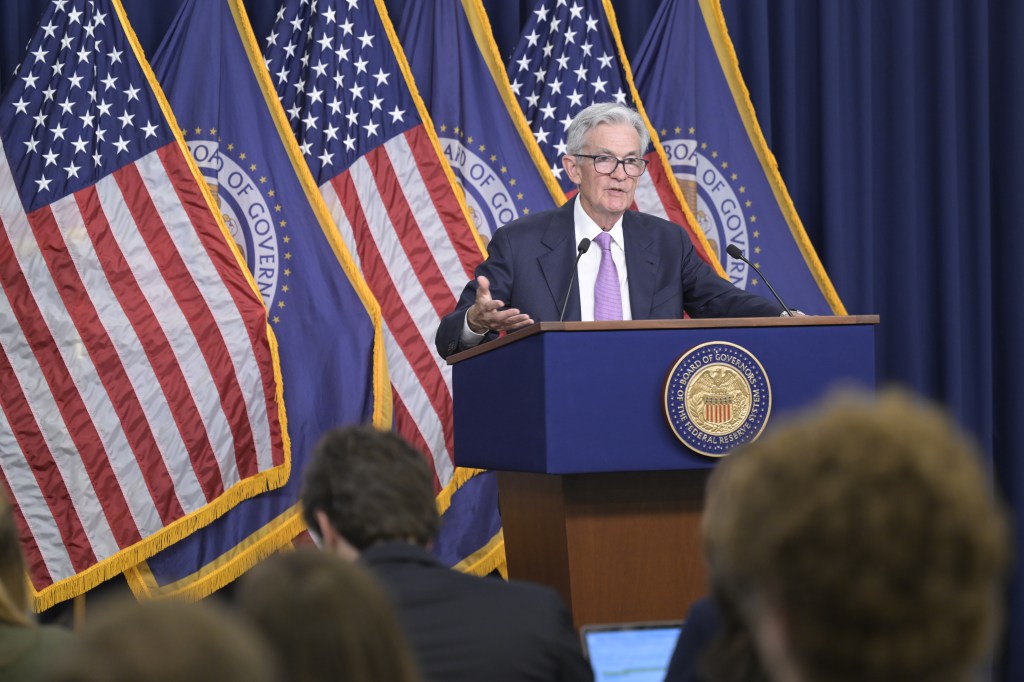
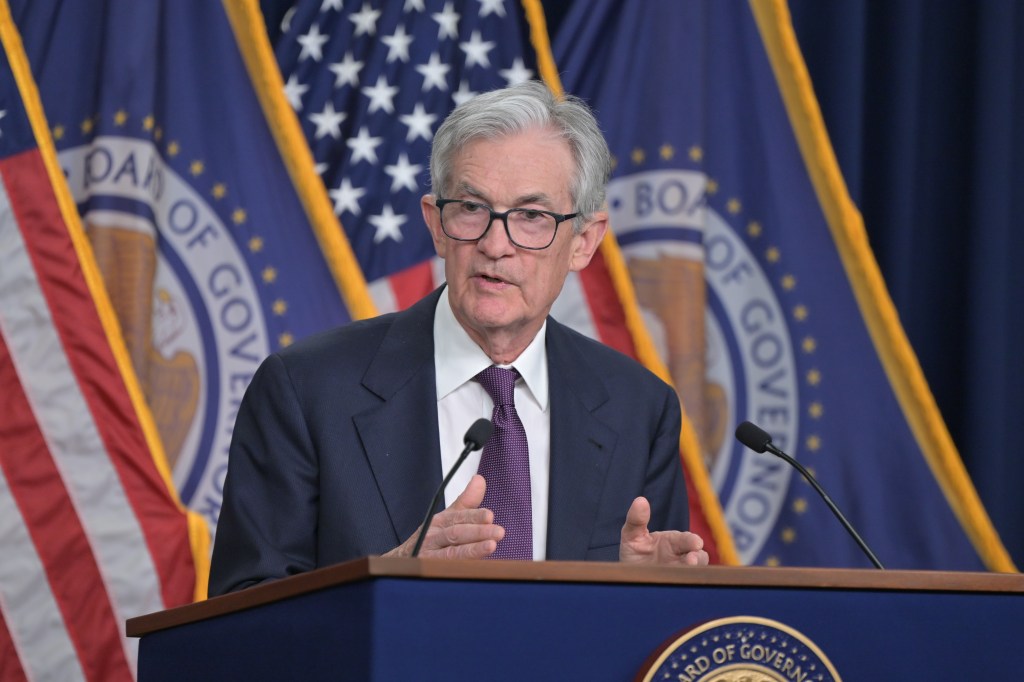
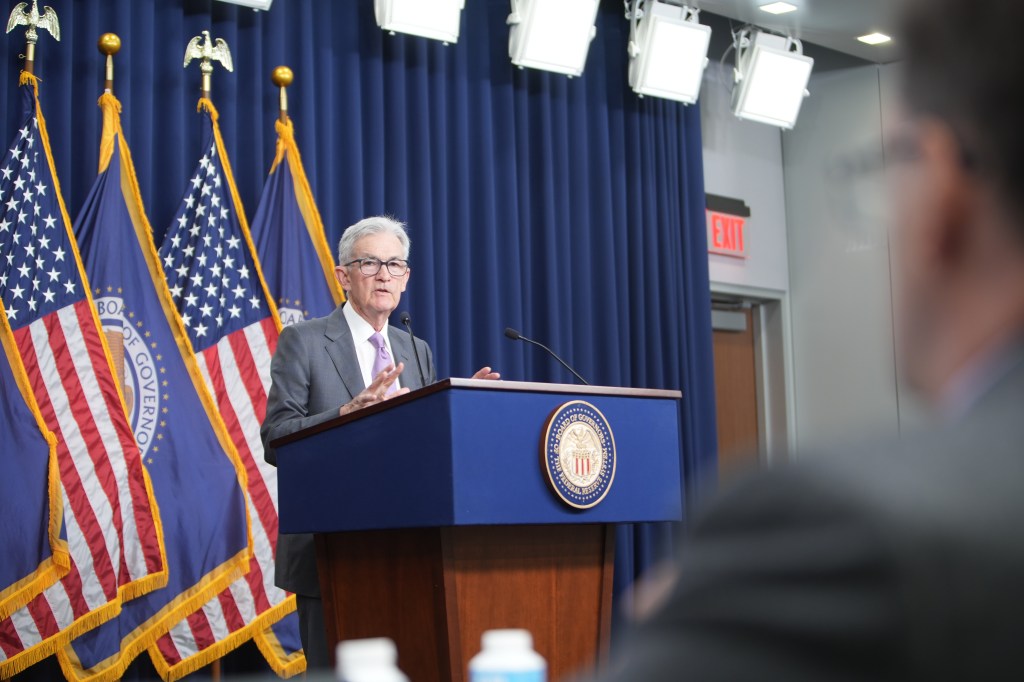
Fed Chair Jerome Powell speaking at a press conference following a meeting of the FOMC (photo from federalreserve.gov)
Members of the Fed’s policymaking Federal Open Market Committee (FOMC) had signaled clearly before today’s (June 18) meeting that the committee would leave its target range for the federal funds rate unchanged at 4.25 percent to 4.50 percent. In the statement released after its meeting, the committee noted that a key reason for keeping its target range unchanged was that: “Uncertainty about the economic outlook has diminished but remains elevated.” Committee members were unanimous in voting to keep its target range unchanged.
In his press conference following the meeting, Fed Chair Jerome Powell indicated that a key source of economic uncertainty was the effect of tariffs on the inflation rate. Powell indicated that the likeliest outcome was that tariffs would lead to the inflation rate temporarily increasing. He noted that: “Beyond the next year or so, however, most measures of longer-term expectations [of inflation] remain consistent with our 2 percent inflation goal.”
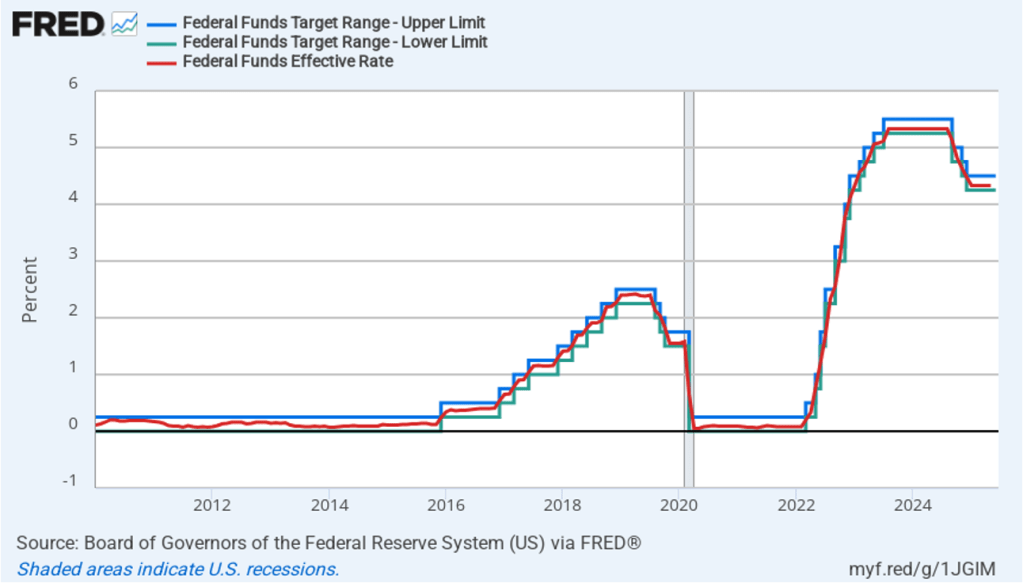
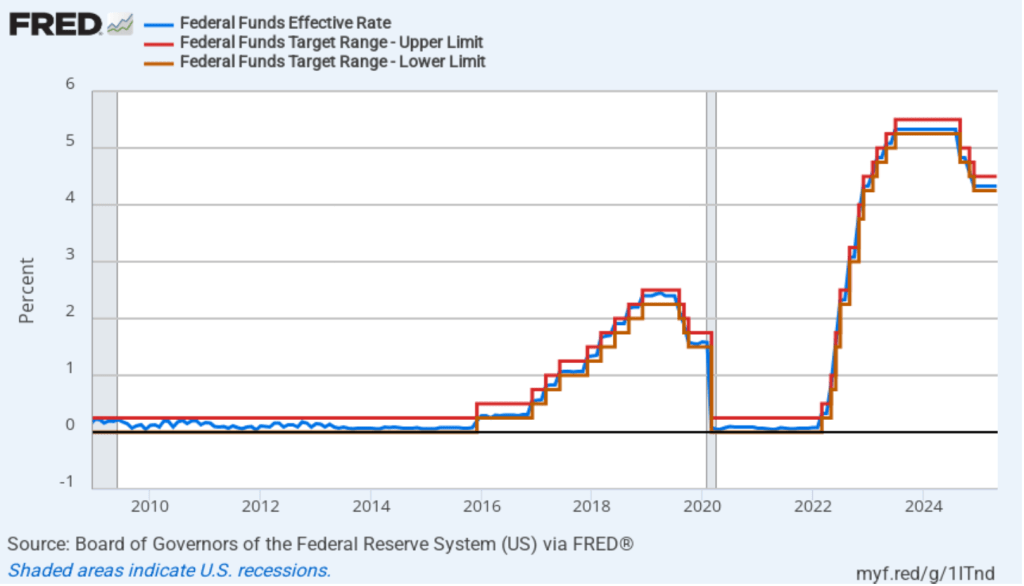
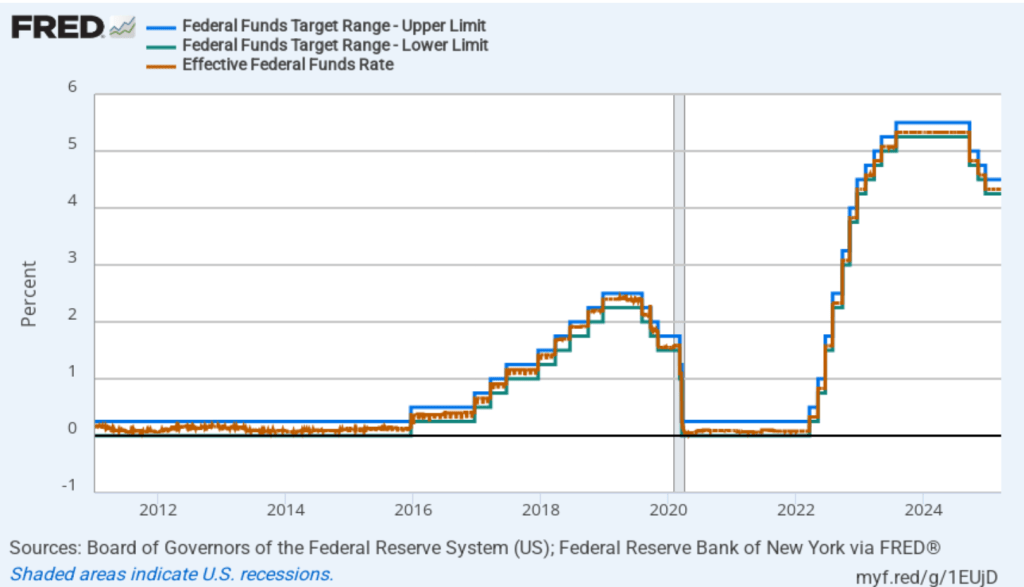
The following figure shows, for the period since January 2010, the upper bound (the blue line) and lower bound (the green line) for the FOMC’s target range for the federal funds rate and the actual values of the federal funds rate (the red line) during that time. Note that the Fed has been successful in keeping the value of the federal funds rate in its target range. (We discuss the monetary policy tools the FOMC uses to maintain the federal funds rate in its target range in Macroeconomics, Chapter 15, Section 15.2 (Economics, Chapter 25, Section 25.2).)
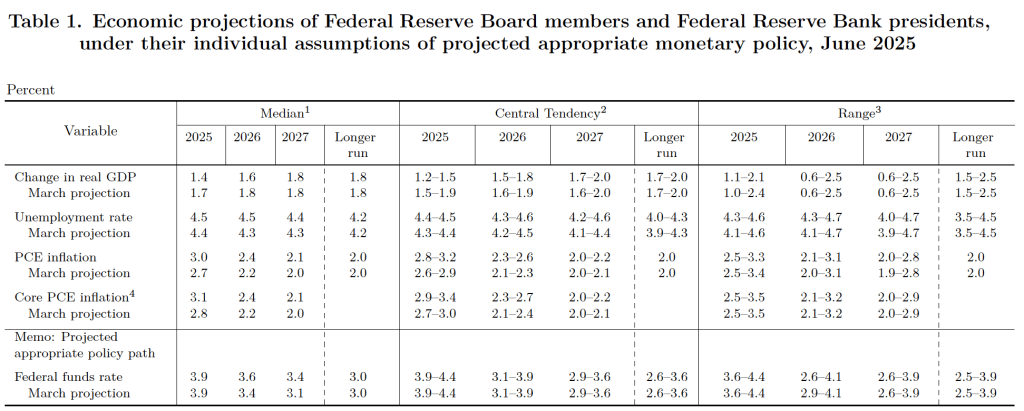
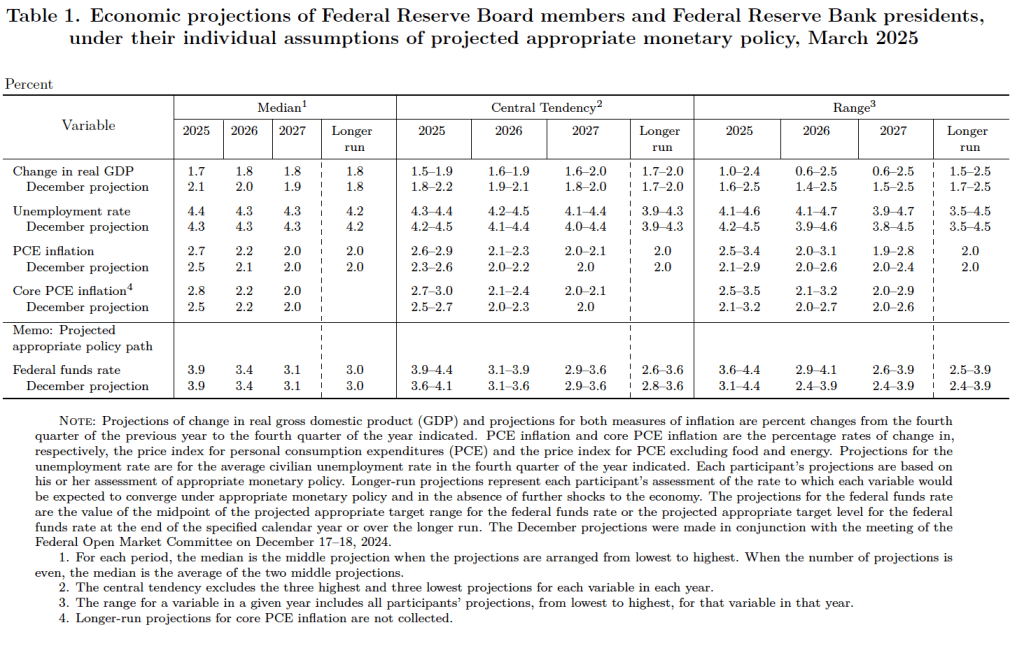
After the meeting, the committee also released a “Summary of Economic Projections” (SEP)—as it typically does after its March, June, September, and December meetings. The SEP presents median values of the 18 committee members’ forecasts of key economic variables. The values are summarized in the following table, reproduced from the release.
There are several aspects of these forecasts worth noting:
Committee members reduced their forecast of real GDP growth for 2025 from 1.7 percent in March to 1.4 percent today. (It had been 2.1 percent in their December forecast.) Committee members also slightly increased their forecast of the unemployment rate at the end of 2025 from 4.4 percent to 4.5 percent. (The unemployment rate in May was 4.2 percent.)
Committee members now forecast that personal consumption expenditures (PCE) price inflation will be 3.0 percent at the end of 2025. In March they had forecast that it would be 2.7 percent at the end of 2025, and in December, they had forecast that it would 2.5 percent. Similarly, their forecast of core PCE inflation increased from 2.8 percent to 3.1 percent. It had been 2.5 percent in December. The committee does not expect that PCE inflation will decline to the Fed’s 2 percent annual target until sometime after 2027.
The committee’s forecast of the federal funds rate at the end of 2025 was unchanged at 3.9 percent. The federal funds rate today is 4.33 percent, which indicates that the median forecast of committee members is for two 0.25 percentage point (25 basis points) cuts in their target for the federal funds rate this year. Investors are similarly forecasting two 25 basis point cuts.
During his press conference, Powell indicated that because the tariff increases the Trump administration implemented beginning in April were larger than any in recent times, their effects on the economy are difficult to gauge. He noted that: “There’s the manufacturer, the exporter, the importer and the retailer and the consumer. And each one of those is going to be trying not to be the one to pay for the tariff, but together they will all pay together, or maybe one party will pay it all.” The more of the tariff that is passed on to consumers, the higher the inflation rate will be.
Earlier today, President Trump reiterated his view that the FOMC should be cutting its target for the federal funds rate, labeling Powell as “stupid” for not doing so. Trump has indicated that the Fed should cut its target rate by 1 percentage point to 2.5 percentage points in order to reduce the U.S. Treasury’s borrowing costs. During World War II and the beginning of the Korean War, the Fed pegged the interest rates on Treasury securities at low levels: 0.375 percent on Treasury bills and 2.5 percent on Treasury bonds. Following the Treasury-Federal Reserve Accord, reached in March 1951, the Federal Reserve was freed from the obligation to fix the interest rates on Treasury securities. (We discuss the Accord in Chapter 13 of Money, Banking, and the Financial System.) Since that time, the Fed has focused on its dual mandate of maximum employment and price stability and it has not been directly concerned with affecting the Treasury’s borrowing cost.
Barring a sharp slowdown in the growth of real GDP, a significant rise in the unemployment rate, or a significant rise in the inflation rate, the FOMC seems unlikely to change its target for the federal funds rate before its meeting on September 16–17 at the earliest.
Fed Chair Jerome Powell speaking at a press conference following a meeting of the FOMC (photo from federalreserve.gov)
Members of the Fed’s policymaking Federal Open Market Committee (FOMC) had signaled clearly before today’s (May 7) meeting that the committee would leave its target range for the federal funds rate unchanged at 4.25 percent to 4.50 percent. In the statement released after its meeting, the committee made one significant change to the wording in its statement following its last meeting on March 19. The committee added the words in bold to the following sentence:
“The Committee is attentive to the risks to both sides of its dual mandate and judges that the risks of higher unemployment and higher inflation have risen.”
The key event since the last FOMC meeting was President Trump’s announcement on April 2 that he would implement tariff increases that were much higher than had previously been expected.
As we noted in an earlier blog post, an unexpected increase in tariff rates will result in an aggregate supply shock to the economy. As we discuss in Macroeconomics, Chapter 13,Section 13.3 (Economics, Chapter 23, Section 23.3), an aggregate supply shock puts upward pressure on the price level at the same time as it causes a decline in real GDP and employment. The result, as the FOMC statement indicates, can be both rising inflation and rising unemployment. If higher inflation and higher unemployment persist, the U.S. economy would be experiencing stagflation. The United States last experienced stagflation during the 1970s when large increases in oil prices caused an aggregate supply shock.
During his press conference following the meeting, Fed Chair Jerome Powell indicated that the increase in tariffs might the Fed’s dual mandate goals of price stability and maximum employment “in tension” if both inflation and unemployment increase. If the FOMC were to increase its target for the federal funds rate in order to slow the growth of demand and bring down the inflation rate, the result might be to further increase unemployment. But if the FOMC were to cut its target for the federal funds rate to increase the growth of demand and reduce the unemployment rate, the result might be to further increase the inflation rate.
Powell emphasized during his press conference that tariffs had not yet had an effect on either inflation or unemployment that was large enough to be reflected in macroeconomic data—as we’ve noted in blog posts discussing recent macroeconomic data releases. As a result, the consensus among committee members is that it would be better to wait to future meetings before deciding what changes in the federal funds rate might be needed: “We’re in a good position to wait and see. We don’t have to be in a hurry.”
The following figure shows, for the period since January 2010, the upper bound (the blue line) and lower bound (the green line) for the FOMC’s target range for the federal funds rate and the actual values of the federal funds rate (the red line) during that time. Note that the Fed is successful in keeping the value of the federal funds rate in its target range. (We discuss the monetary policy tools the FOMC uses to maintain the federal funds rate in its target range in Macroeconomics, Chapter 15, Section 15.2 (Economics, Chapter 25, Section 25.2).)
In his press conference, Powell indicated that when the committee would change its target for the federal funds rate was dependent on the trends in macroeconomic data on inflation, unemployment, and output during the coming months. He noted that if both unemployment and inflation significantly increased, the committee would focus on which variable had moved furthest from the Fed’s target. He also noted that it was possible that neither inflation nor unemployment might end up significantly increasing either because tariff negotiations lead to lower tariff rates or because the economy proves to be better able to deal with the effects of tariff increases than many economist now expect.
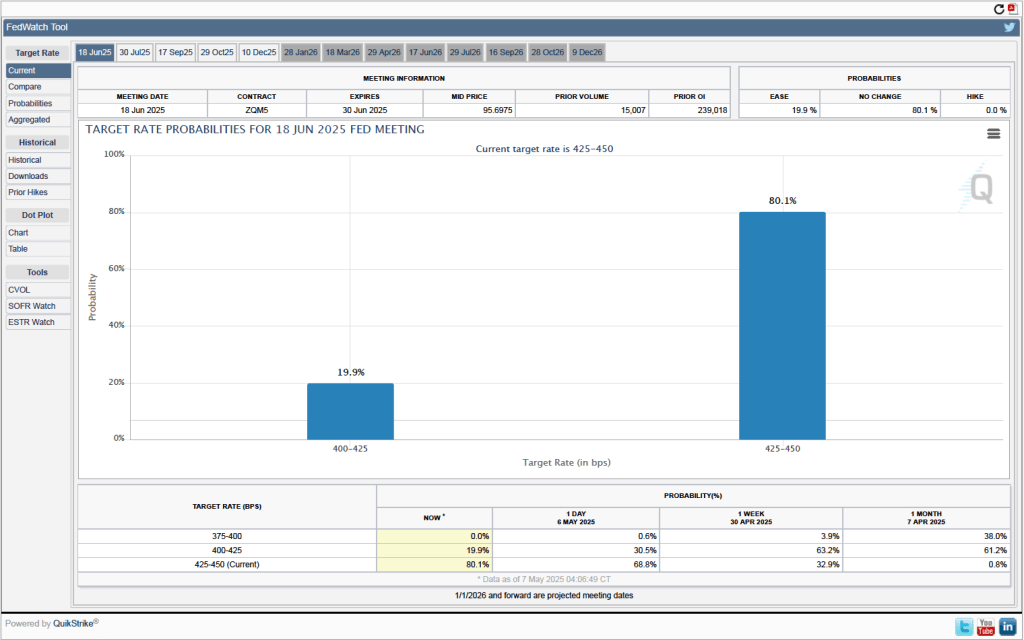
One indication of expectations of future changes in the target for the federal funds rate comes from investors who buy and sell federal funds futures contracts. (We discuss the futures market for federal funds in this blog post.) The data from the futures market indicate that investors don’t expect that the FOMC will cut its target for the federal funds rate at its May 17–18 meeting. As shown in the following figure, investors assign a 80.1 percent probability to the committee keeping its target unchanged at 4.25 percent to 4.50 percent at that meeting.
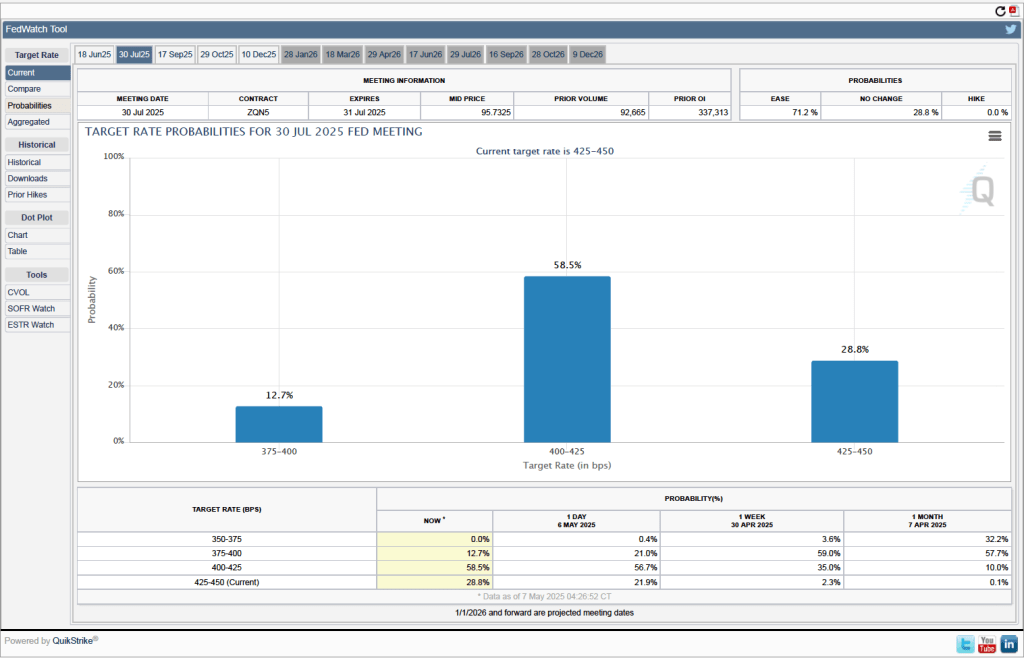
When will the Fed likely cut its target for the federal funds rate? As the following figure shows, investors expect it to happen at the FOMC’s July 29–30 meeting. Investors assign a probably of 58.5 percent to the committee cutting its target by 0.25 percentage point (25 basis points) at that meeting and a probability of 12.7 percent to the committee cutting its target by 50 basis points. Investors assign a probability of only 28.8 percent to the committee leaving its target unchanged.
Please listen to a podcast discussion recorded just this past Friday between Glenn Hubbard and Tony O’Brien as they discuss tariffs and it’s impact on monetary policy. Also, check out the regular blog posts while on the site! So much has been happening and these posts helps both instructors and students integrate this discussion into their classroom.
Join authors Glenn Hubbard and Tony O’Brien as they discuss the impact of new tariff policies on trade but also on the larger economy. They delve into the Fed, monetary policy, and the impact on inflation. They also discuss some of the history back to when tariffs used to be a high proportion of government revenue and analyze the mix of products that are imported & exported by the US. Should the Fed change its current behavior due to the tariff environment?
Fed Chair Jerome Powell speaking at a press conference following a meeting of the FOMC (photo from federalreserve.gov)
As they had before their previous meeting, members of the Fed’s Federal Open Market Committee (FOMC) had signaled that the committee was likely to leave its target range for the federal funds rate unchanged at 4.25 percent to 4.50 percent at its meeting today (March 19). In a press conference following the meeting, Fed Chair Jerome Powell noted that the FOMC was facing significant policy uncertainty:
“Looking ahead, the new Administration is in the process of implementing significant policy changes in four distinct areas: trade, immigration, fiscal policy, and regulation…. While there have been recent developments in some of these areas, especially trade policy, uncertainty around the changes and their effects on the economic outlook is high…. We do not need to be in a hurry to adjust our policy stance, and we are well positioned to wait for greater clarity.”
The next scheduled meeting of the FOMC is May 6–7. It seems likely that the committee will also keep its target rate constant at that meeting. Although at his press conference, Powell noted that “Policy is not on a preset course. As the economy evolves, we will adjust our policy stance in a manner that best promotes our maximum employment and price stability goals.” The statement the committee released after the meeting showed that the decision to leave the target rate unchanged was unanimous.
The following figure shows, for the period since January 2010, the upper bound (the blue line) and lower bound (the green line) for the FOMC’s target range for the federal funds rate and the actual values of the federal funds rate (the red line) during that time. Note that the Fed is successful in keeping the value of the federal funds rate in its target range. (We discuss the monetary policy tools the FOMC uses to maintain the federal funds rate in its target range in Macroeconomics, Chapter 15, Section 15.2 (Economics, Chapter 25, Section 25.2).)
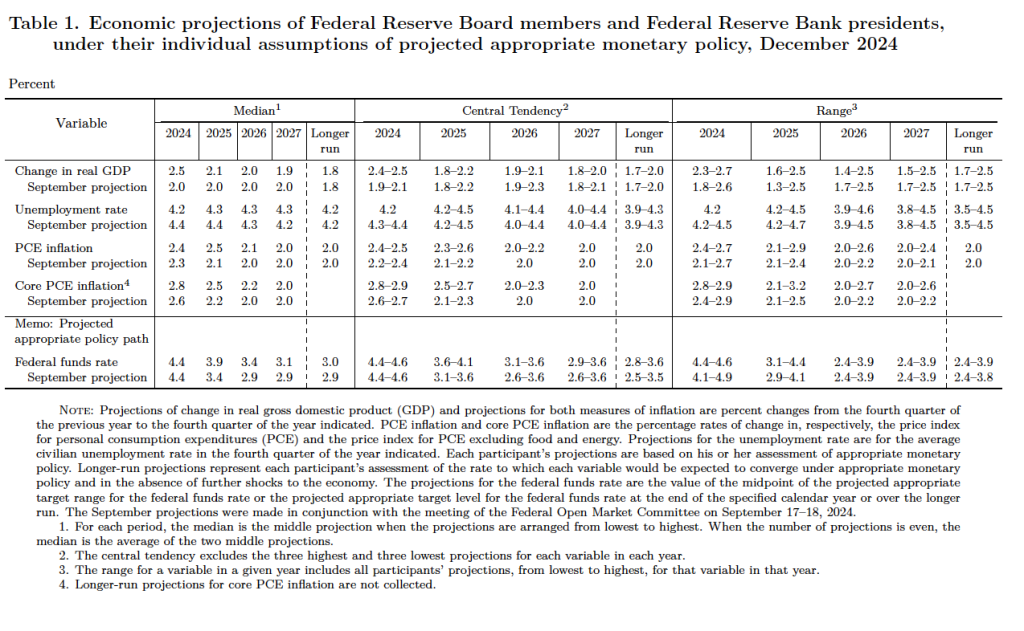
After the meeting, the committee also released a “Summary of Economic Projections” (SEP)—as it typically does after its March, June, September, and December meetings. The SEP presents median values of the 18 committee members’ forecasts of key economic variables. The values are summarized in the following table, reproduced from the release.
There are several aspects of these forecasts worth noting:
Committee members reduced their forecast of real GDP growth for 2025 from 2.1 percent in December to 1.7 percent today. Committee members also slightly increased their forecast of the unemployment rate at the end of 2025 from 4.3 percent to 4.4 percent. (The unemployment rate in February was 4.1 percent.)
Committee members now forecast that personal consumption expenditures (PCE) price inflation will be 2.7 percent at the end of 2025. In December, they had forecast that it would 2.5 percent. Similarly, their forecast of core PCE inflation increased from 2.5 percent to 2.8 percent. The committee does not expect that PCE inflation will decline to the Fed’s 2 percent annual target until 2027.
The committee’s forecast of the federal funds rate at the end of 2025 was unchanged at 3.9 percent. The federal funds rate today is 4.33 percent, which indicates that committee members expect to make two 0.25 percentage point (25 basis points) cuts in their target for the federal funds rate this year. Investors are similarly forecasting two 25 basis point cuts.
During his press conference, Powell indicated that a significant part of the increase in goods inflation during the first two months of the year was likely due to tariffs, although the Fed’s staff was unable to make a precise estimate of how much. Economists generally believe that tariffs cause one-time increases in the price level, rather than persistent inflation. Powell was asked during the press conference whether the FOMC was likely to “look through”—that is, not respond—to the tariffs. Powell replied that it was too early to make that decision, but that: “If there’s an inflation that’s going to go away on its own, it’s not the correct response to tighten policy.”
Powell noted that although surveys show that businesses and consumers expect an increase in inflation, over the long run, expectations are that the inflation rate will return to the Fed’s 2 percent annual target. In that sense, Powell said that expectations of inflation remain “well anchored.”
Barring a sharp slowdown in the growth of real GDP, a significant rise in the unemployment rate, or a significant rise in the inflation rate, the FOMC seems likely to leave its target for the federal funds rate unchanged over the next few months.
Welcome to the first podcast for the Spring 2025 semester from the Hubbard/O’Brien Economics author team. Check back for Blog updates & future podcasts which will happen every few weeks throughout the semester.
Join authors Glenn Hubbard & Tony O’Brien as they offer thoughts on tariffs in advance of the beginning of the new administration. They discuss the positive and negative impacts of tariffs -and some of the intended consequences. They also look at the AI landscape and how its reshaping the US economy. Is AI responsible for recent increased productivity – or maybe just the impact of other factors. It should be looked at closely as AI becomes more ingrained in our economy.
Federal Reserve Chair Jerome Powell speaks at a press conference following a meeting of the Federal Open Market Committee. (Photo from federalreserve.gov)
Members of the Fed’s Federal Open Market Committee (FOMC) had signaled that the committee was likely to cut its target range for the federal funds rate by 0.25 percentage point (25 basis points) at its meeting today (December 18). As we noted in this recent post, investors had overwhelming expected a cut of this size. Although the committee followed through with a 25 basis point cut, Fed Chair Jerome Powell noted in a press conference following the meeting that it was a “closer call” than were the two earlier cuts this year. The statement the committee released after the meeting showed that only one member—Beth M. Hammack, president of the Federal Reserve Bank of Cleveland—ended up voting against the decision to cut the target rate.
In his press conference, Powell noted that although there were some indications that the labor market has weakened, the committee believed that unemployment was likely to remain near the natural rate. The committee also saw real GDP increasing at a steady rate. Powell stated that he was optimistic about the economy and that “I expect another good year next year.” The main obstacle to the committee fulfilling its dual mandate for full employment and price stability is that inflation remains persistently above the Fed’s target of a 2 percent annual inflation rate.
After the meeting, the committee also released a “Summary of Economic Projections” (SEP)—as it typically does at its March, June, September, and December meetings. The SEP presents median values of the committee members’ forecasts of key economic variables. The values are summarized in the following table, reproduced from the release.
The forecasts mirror the points that Powell made in his news conference:
Committee members now forecast that GDP will be higher in 2024, and that the unemployment rate will be lower, than they had forecast in September.
Committee members now forecast that both personal consumption expenditures (PCE) price inflation and core PCE inflation will be slightly higher in 2024 than they had forecast in September.
Most notably, whereas in September committee members had forecast that PCE inflation would be 2.1 percent in 2025, they now forecast it will be 2.5 percent—notably higher. And committee members now forecast that inflation will not fall to the Fed’s 2 percent target until 2027, rather than 2026.
Finally, committee members now project that the federal funds rate will end 2025 50 basis points lower than it is now, rather than 100 basis points lower. In other words, committee members ares now forecasting only two 25 basis point cuts in the target next year rather than the four cuts they had forecast in September.
In his press conference, Powell noted that the main reason that PCE inflation remains high is that inflation in the prices of housing services has been running high, as have the prices of some other services. Noting that monetary policy affects the economy “with long and variable lags,” Powell stated that he believes that inflation is still on track to fall to the 2 percent target.
Given that inflation has been running closer to 2.5 percent and that the committee expects the inflation rate will still be 2.5 percent next year, a reporter asked Powell if the committee had considered the possibility of accepting a 2.5 percent inflation rate in the long run. Powell replied that: “No. We’re not going to settle for [2.5 percent inflation].” He stated that a 2 percent inflation rate is what the Fed “owes the public.”
Finally, Powell indicated that the committee would have to take into account the effects of the incoming Trump Administration’s fiscal policy actions—particularly tariff increases—when they occur. President Trump has stated that he would like to see interest rates decline more quickly, so the committee may face criticism for keeping the target for the federal funds rate higher next year than they had originally intended.
Welcome to the first podcast for the Fall 2024 semester from the Hubbard/O’Brien Economics author team. Check back for Blog updates & future podcasts which will happen every few weeks throughout the semester.
Join authors Glenn Hubbard & Tony O’Brien as they provide an update on the Macroeconomy. They offer thoughts on the likelihood of a soft landing and whether the actions of the Federal Reserve helped or hindered that process. The monetary and fiscal challenges facing the new administration are real and the Fed will begin its process of rate-cutting this week in the upcoming FOMC meeting. Gain insight into this evolving situation by listening to this podcast. Click HERE to access the podcast.
Join authors Glenn Hubbard & Tony O’Brien as they react to the jobs report of over 300K jobs created which was way over expectations of about 200K. They consider the impact of this report as the Fed considers the next steps for the economy. Are we on a glide path for a soft landing at 2% inflation or will the Fed reconsider its long-standing target by adopting a higher 3% target? Glenn and Tony offer interesting viewpoints on where this is headed.
Federal Reserve Chair Jerome Powell (Photo from Bloomberg News via the Wall Street Journal.)
Economists, policymakers, and Wall Street analysts have been waiting for macroeconomic data to confirm that the Federal Reserve has brought the U.S. economy in for a soft landing, with inflation arrving back at the Fed’s target of 2 percent without the economy slipping into a recession. Fed officials have been cautious about declaring that they have yet seen sufficient data to be sure that a soft landing has actually been achieved. Accordingly, they are not yet willing to begin cutting their target for the federal funds rate.
For instance, on March 6, in testifying before the Commitee on Financial Services of the U.S. House of Representatives, Fed Chair Jerome Powell stated that the Fed’s Federal Open Market Committee (FOMC) “does not expect that it will be appropriate to reduce the target range until it has gained greater confidence that inflation is moving sustainably toward 2 percent.” (Powell’s statement before his testimony can be found here.)
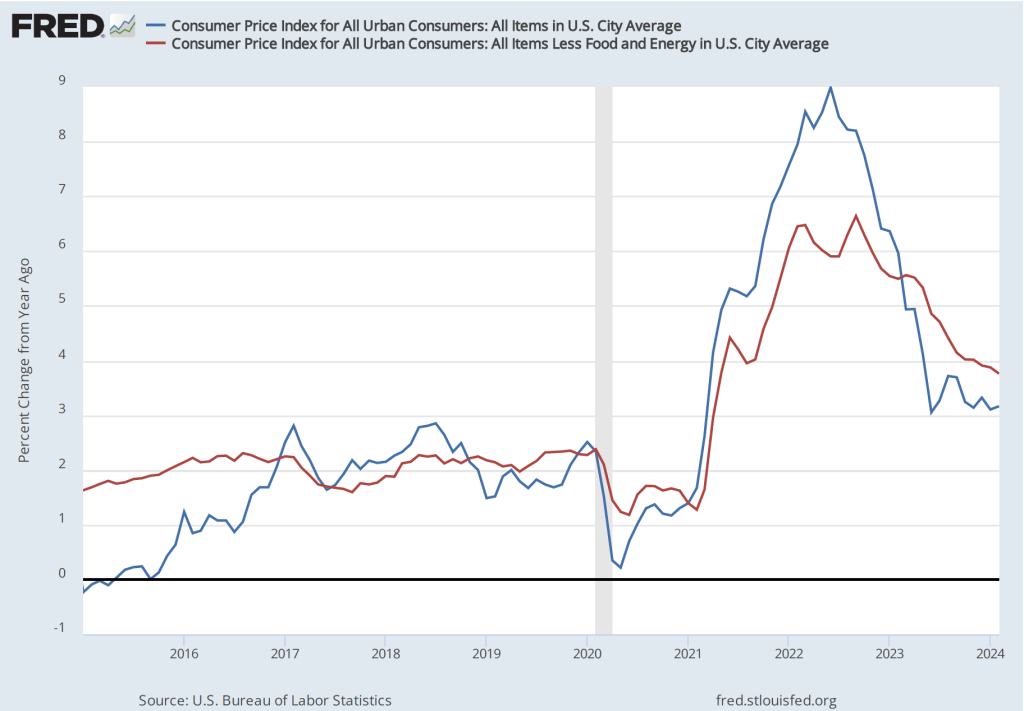
The BLS’s release today (March 12) of its report on the consumer price index (CPI) (found here) for February indicated that inflation was still running higher than the Fed’s target, reinforcing the cautious approach that Powell and other members of the FOMC have been taking. The increase in the CPI that includes the prices of all goods and services in the market basket—often called headline inflation—was 3.2 percent from the same month in 2023, up slightly from 3.1 In January. (We discuss how the BLS constructs the CPI in Macroeconomics, Chapter 9, Section 19.4, Economics, Chapter 19, Section 19.4, and Essentials of Economics, Chapter 3, Section 13.4.) As the following figure shows, core inflation—which excludes the prices of food and energy—was 3.8 percent, down slightly from 3.9 percent in January.
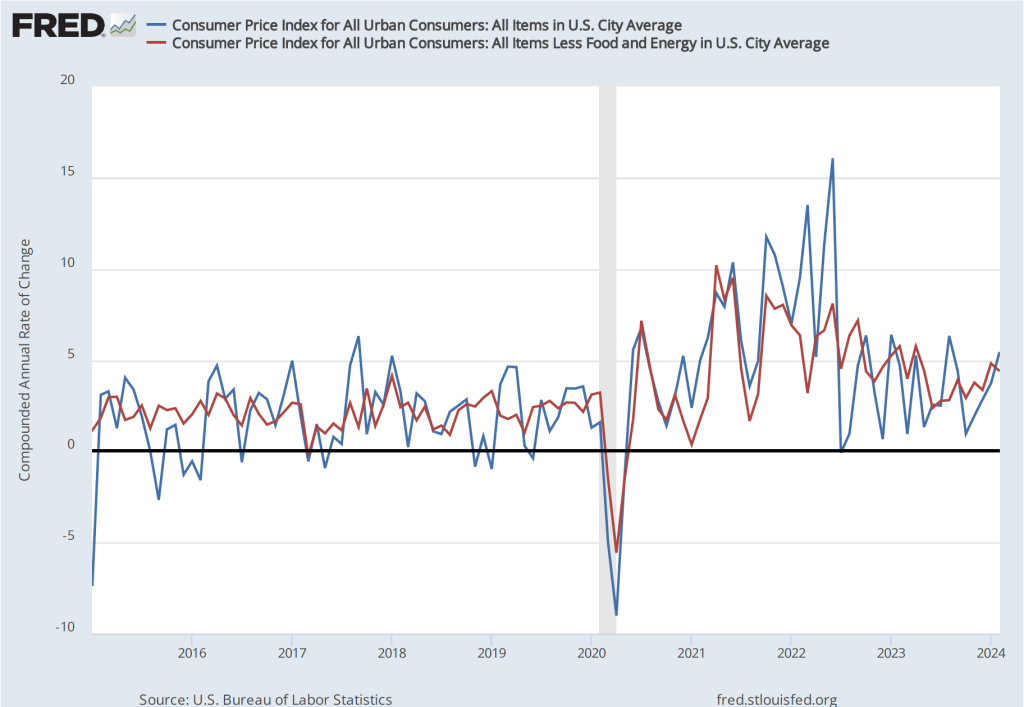
If we look at the 1-month inflation rate for headline and core inflation—that is the annual inflation rate calculated by compounding the current month’s rate over an entire year—the values are more concerning, as indicated in the following figure. Headline CPI inflation is 5.4 percent (up from 3.7 percent in January) and core CPI inflation is 4.4 percent (although that is down from 4.8 percent in January). The Fed’s inflation target is measured using the personal consumption expenditures (PCE) price index, not the CPI. But CPI inflation at these levels is not consistent with PCE inflation of only 2 percent.
Even more concerning is the path of inflation in the prices of services. As we’ve noted in earlier posts, Chair Powell has emphasized that as supply chain problems have gradually been resolved, inflation in the prices of goods has been rapidly declining. But inflaion in services hasn’t declined nearly as much. Last summer he stated the point this way:
“Part of the reason for the modest decline of nonhousing services inflation so far is that many of these services were less affected by global supply chain bottlenecks and are generally thought to be less interest sensitive than other sectors such as housing or durable goods. Production of these services is also relatively labor intensive, and the labor market remains tight. Given the size of this sector, some further progress here will be essential to restoring price stability.”
The following figure shows the 1-month inflation rate in services prices and in services prices not included including housing rent. Some economists believe that the rent component of the CPI isn’t well measured and can be volatile, so it’s worthwhile to look at inflation in service prices not including rent. The figure shows that inflation in all service prices has been above 4 percent in every month since July 2023. Although inflation in service prices declined from January, it was still a very high 5.8 percent in February. Inflation in service prices not including housing rent was even higher at 7.5 percent. Such large increases in the prices of services, if they were to continue, wouldn’t be consistent with the Fed meeting its 2 percent inflation target.
Finally, some economists and policymakers look at median inflation to gain insight into the underlying trend in the inflation rate. If we listed the inflation rate in each individual good or service in the CPI, median inflation is the inflation rate of the good or service that is in the middle of the list—that is, the inflation rate in the price of the good or service that has an equal number of higher and lower inflation rates. As the following figure shows, although median inflation declined in February, it was still high at 4.6 percent and, although median inflation is volatile, the trend has been generally upward since July 2023.
The data in this month’s BLS report on the CPI reinforces the view that the FOMC will not move to cut its target for the federal funds rate in the meeting next week and makes it somewhat less likely that the committee will cut its target at the following meeting on April 30-May 1.