Should the Fed Be Looking at the Median CPI?

For years, all the products for sale in Dollar Tree stores had a price of $1.00 or less. But as inflation increased, the company had to raise its maxium prices to $1.25. (Thanks to Lena Buonanno for sending us the photo.)

There are multiple ways to measure inflation. Economists and policymakers use different measures of inflation depending on the use they intend to put the measure of inflation to. For example, as we discuss in Macroeconomics, Chapter 9, Section 9.4 (Economics, Chapter 19, Section 19.4), the Bureau of Labor Statistics (BLS) constructs the consumer price index (CPI) as measure of the cost of living of a typical urban household. So the BLS intends the percentage change in the CPI to measure inflation in the cost of living as experienced by the roughly 93 percent of the population that lives in an urban household. (We are referring here to what the BLS labels CPI–U. As we discuss in this blog post, the BLS also compiles a CPI for urban wage earners and clerical workers (or CPI–W).)

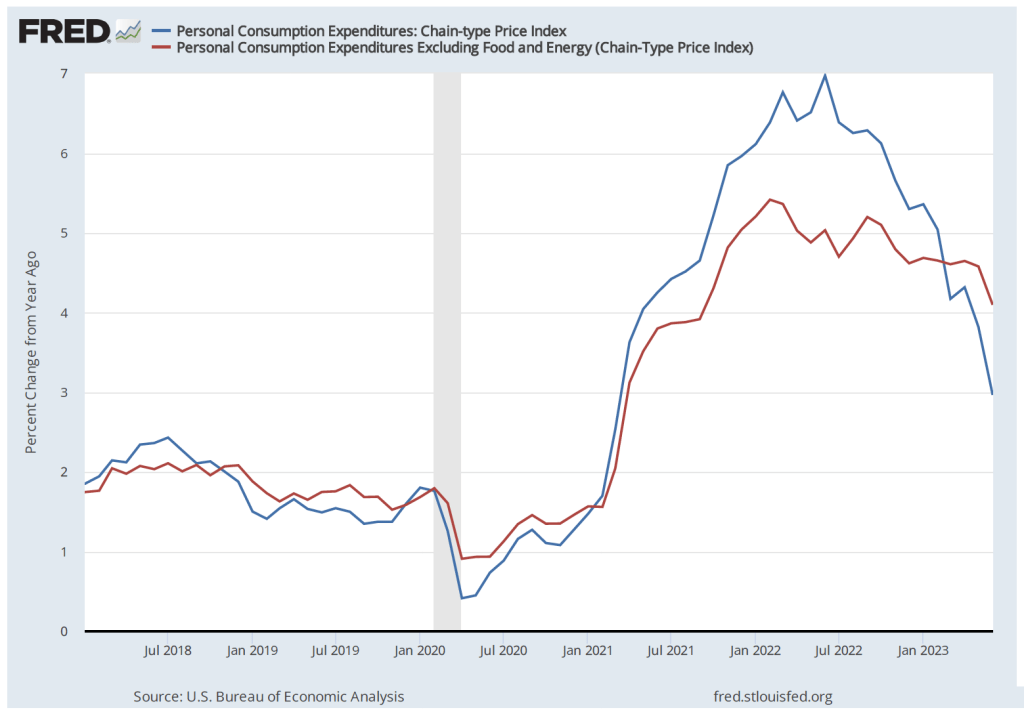
As we discuss in an Apply the Concept in Chapter 15, Section 15.5, because the Fed is charged by Congress with ensuring stability in the general price level, the Fed is interested in a broader measure of inflation than the CPI. So its preferred measure of inflation is the personal consumption expenditures (PCE) price index, which the Bureau of Economic Analysis (BEA) issues monthly. The PCE price index is a measure of the price level similar to the GDP deflator, except it includes only the prices of goods and services from the consumption category of GDP. Because the PCE price index includes more goods and services than the CPI, it is suits the Fed’s need for a broader measure of inflation. The Fed uses changes in the PCE to evaluate whether it’s meeting its target of a 2 percent annual inflation rate.

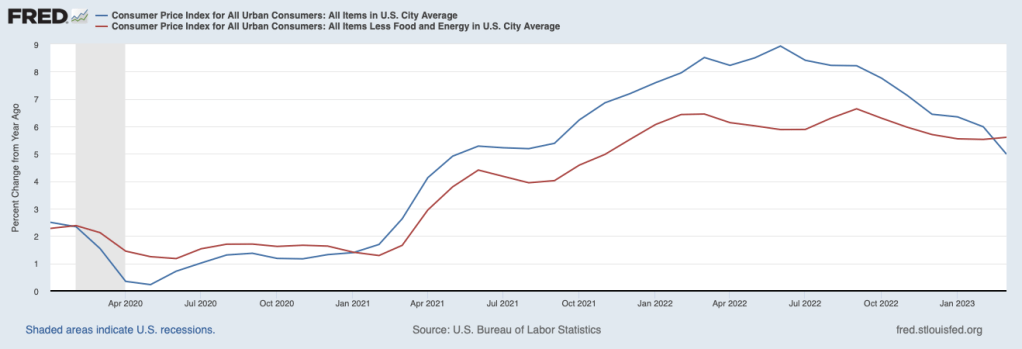
In using either the percentage change in the CPI or the percentage change in the PCE, we are looking at what inflation has been over the previous year. But economists and policymakers are also looking for indications of what inflation may be in the future. Prices of food and energy are particularly volatile, so the BLS issues data on the CPI excluding food and energy prices and the BEA does the same with respect to the PCE. These two measures help avoid the problem that, for example, a period of high gasoline prices might lead the inflation rate to temporarily increase. Note that inflation caclulated by excluding the prices of food and energy is called core inflation.

During the surge in inflation that began in the spring of 2021 and continued into the fall of 2022, some economists noted that supply chain problems and other effects of the pandemic on labor and product markets caused the prices of some goods and services to spike. For example, a shortage of computer chips led to a reduction in the supply of new cars and sharp increases in car prices. As with temporary spikes in prices of energy and food, spikes resulting from supply chain problems and other effects of the pandemic might lead the CPI and PCE—even excluding food and energy prices—to give a misleading measure of the underlying rate of inflation in the economy. 

To correct for this problem, some economists have been more attention to the measure of inflation calculated using the median CPI, which is compiled monthly by economists at the Federal Reserve Bank of Cleveland. The median CPI is calculated by ranking the price changes of every good or service in the index from the largest price change to the smallest price change, and then choosing the price change in the middle. The idea is to eliminate the effect on measured inflation of any short-lived events that cause the prices of some goods and services to be particularly high or particularly low. Economists at the Cleveland Fed have conducted research that shows that, in their words, “the median CPI provides a better signal of the underlying inflation trend than either the all-items CPI or the CPI excluding food and energy. The median CPI is even better at forecasting PCE inflation in the near and longer term than the core PCE price index.”

The following figure shows the three measures of inflation using the CPI for each month since January 2019. The red line shows the unadjusted CPI, the green line shows the CPI excluding food and energy prices, and the blue line shows median CPI. To focus on the inflation rate in a particular month, in this figure we calculate inflation as the percentage change in the index at an annual rate. That is, we calculate the annual inflation rate assuming that the inflation rate in that month continued for a year.

Note that for most of the period since early 2021, during which the inflation rate accelerated, median inflation was well below inflation measured by changes in the unadjusted CPI. That difference reflects some of the distortions in measuring inflation arising from the effects of the pandemic.

But the last two values—for July and August 2022—tell a different story. In those months, inflation measured by changes in the CPI excluding food and energy prices or by changes in median CPI were well above inflation measured by changes in the unadjusted CPI.  In August 2022, the unadjusted CPI shows a low rate of inflation—1.4 percent—whereas the CPI excluding food and energy prices shows an inflation rate of 7.0 percent and the median CPI shows an inflation rate of 9.2 percent. 

We should always be cautious when interpreting any economic data for a period as short as two months. But data for inflation measured by the change in median CPI may be sending a signal that the slowdown in inflation that many economists and policymakers had been predicting would occur in the summer of 2022 isn’t actually occurring. We’ll have to await the release of future data to draw a firmer conclusion.

Sources: Michael S. Derby, “Inflation Data Scrambles Fed Rate Outlook Again,” Wall Street Journal, September 14, 2022; Federal Reserve Bank of Cleveland, “Median CPI,” clevelandfed.org; and Federal Reserve Bank of St. Louis.

Podcasts Back for Fall 2022! – 9/9/22 Podcast – Authors Glenn Hubbard & Tony O’Brien discuss inflation, the Fed’s Response, cryptocurrency, and also briefly touch on labor markets.

How Should We Measure Inflation?

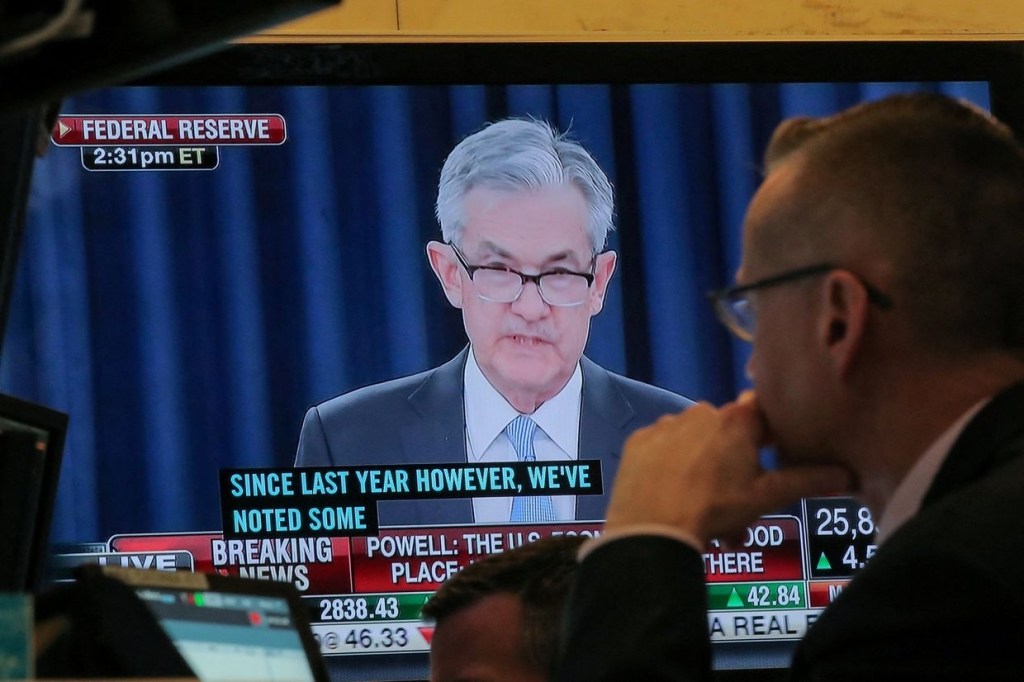
Image from the Wall Street Journal.

In the textbook, we discuss several measures of inflation. In Macroeconomics, Chapter 8, Section 8.4 (Economics, Chapter 18, Section 18.4) we discuss the GDP deflator as a measure of the price level and the percentage change in the GDP deflator as a measure of inflation. In Chapter 9, Section 9.4, we discuss the consumer price index (CPI) as a measure of the price level and the percentage change in the CPI as the most widely used measure of inflation. 

            In Chapter 15, Section 15.5 we examine the reasons that the Federal Reserve often looks at the core inflation rate—the inflation rate excluding the prices of food and energy—as a better measure of the underlying rate of inflation. Finally, in that section we note that the Fed uses the percentage change in the personal consumption expenditures (PCEprice index to assess  of whether it’s achieving its goal of a 2 percent inflation rate.

            In this blog post, we’ll discuss two other aspects of measuring inflation that we don’t cover in the textbook. First, the Bureau of Labor Statistics (BLS) publishes two versions of the CPI:  (1) The familiar CPI for all urban consumers (or CPI–U), which includes prices of goods and services purchased by households in urban areas, and (2) the less familiar CPI for urban wage earners and clerical workers (or CPI–W), which includes the same prices included in the CPI–U. The two versions of the CPI give slightly different measures of the inflation rate—despite including the same prices—because each version applies different weights to the prices when constructing the index.

            As we explain in Chapter 9, Section 9.4, the weights in the CPI–U (the only version of the CPI we discuss in the chapter) are determined by a survey of 36,000 households nationwide on their spending habits. The more the households surveyed spend on a good or service, the larger the weight the price of the good or service receives in the CPI–U. To calculate the weights in the CPI–W the BLS uses only expenditures by households in which at least half of the household’s income comes from a clerical or wage occupation and in which at least one member of the household has worked 37 or more weeks during the previous year.  The BLS estimates that the sample of households used in calculating the CPI–U includes about 93 percent of the population of the United States, while the households included in the CPI–W include only about 29 percent of the population. 

            Because the percentage of the population covered by the CPI–U is so much larger than the percentage of the population covered by the CPI–W, it’s not surprising that most media coverage of inflation focuses on the CPI–U. As the following figure shows, the measures of inflation from the two versions of the CPI aren’t greatly different, although inflation as measured by the CPI–W—the red line—tends to be higher during economic expansions and lower during economic recessions than inflation measured by the CPI–U—the blue line. 

One important use of the CPI–W is in calculating cost-of-living adjustments (COLAs) applied to Social Security payments retired and disabled people receive. Each year, the federal government’s Social Security Administration (SSA) calculates the average for the CPI–W during June, July, and August in the current year and in the previous year and then measures the inflation rate as the percentage increase between the two averages. The SSA then increases Social Security payments by that inflation rate. Because the increase in CPI–W is often—although not always—larger than the increase in CPI–U, using CPI–W to calculate Social Security COLAs increases the payments recipients of Social Security receive. 

            A second aspect of measuring inflation that we don’t mention in the textbook was the subject of discussion following the release of the July 2022 CPI data. In June 2022, the value for the CPI–U was 295.3. In July 2022, the value for the CPI–U was also 295.3. So, was there no inflation during July—an inflation rate of 0 percent? You can certainly make that argument, but typically, as we note in the textbook (for instance, see our display of the inflation rate in Chapter 10, Figure 10.7) we measure the inflation rate in a particular month as the percentage change in the CPI from the same month in the previous year. Using that approach to measuring inflation, the inflation rate in July 2022 was the percentage change in the CPI from its value in July 2021, or 8.5 percent.  Note that you could calculate an annual inflation rate using the increase in the CPI from one month to the next by compounding that rate over 12 months. In this case, because the CPI was unchanged from June to July 2022, the inflation rate calculated as a compound annual rate would be 0 percent.  

            During periods of moderate inflation rates—which includes most of the decades prior to 2021—the difference between inflation calculated in these two ways was typically much smaller. Focusing on just the change in the CPI for one month has the advantage that you are using only the most recent data. But if the CPI in that month turns out to be untypical of what is happening to inflation over a longer period, then focusing on that month can be misleading. Note also that inflation rate calculated as the compound annual change in the CPI each month results in very large fluctuations in the inflation rate, as shown in the following figure.

Sources: Anne Tergesen, “Social Security Benefits Are Heading for the Biggest Increase in 40 Years,” Wall Street Journal, August 10, 2022; Neil Irwin, “Inflation Drops to Zero in July Due to Falling Gas Prices,” axios.com, August 10, 2022; “Consumer Price Index Frequently Asked Questions,” bls.gov, March 23, 2022; Stephen B. Reed and Kenneth J. Stewart, “Why Does BLS Provide Both the CPI–W and CPI–U?” U.S. Bureau of Labor Statistics, Beyond the Numbers, Vol. 3, No. 5, February 2014; “Latest Cost of Living Adjustment,” ssa.gov; and Federal Reserve Bank of St. Louis.

Are the Fed’s Forecasts of Inflation and Unemployment Inconsistent?

The Federal Reserve building in Washington, DC. Photo from the Wall Street Journal.

Four times per year, the members of the Federal Reserve’s Federal Open Market Committee (FOMC) publish their projections, or forecasts, of the values of the inflation rate, the unemployment, and changes in real gross domestic product (GDP) for the current year, each of the following two years, and for the “longer run.”  The following table, released following the FOMC meeting held on March 15 and 16, 2022, shows the forecasts the members made at that time.

  Median Forecast Meidan Forecast Median Forecast 
 202220232024Longer runActual values, March 2022
Change in real GDP2.8%2.2%2.2%1.8%3.5%
Unemployment rate3.5%3.5%3.6%4.0%3.6%
PCE inflation4.3%2.7%2.3%2.0%6.6%
Core PCE inflation4.1%2.6%2.3%No forecast5.2%

Recall that PCE refers to the consumption expenditures price index, which includes the prices of goods and services that are in the consumption category of GDP. Fed policymakers prefer using the PCE to measure inflation rather than the consumer price index (CPI) because the PCE includes the prices of more goods and services. The Fed uses the PCE to measure whether it is hitting its target inflation rate of 2 percent. The core PCE index leaves out the prices of food and energy products, including gasoline. The prices of food and energy products tend to fluctuate for reasons that do not affect the overall long-run inflation rate. So Fed policymakers believe that core PCE gives a better measure of the underlying inflation rate. (We discuss the PCE and the CPI in the Apply the Concept “Should the Fed Worry about the Prices of Food and Gasoline?” in Macroeconomics, Chapter 15, Section 15.5 (Economics, Chapter 25, Section 25.5)).

The values in the table are the median forecasts of the FOMC members, meaning that the forecasts of half the members were higher and half were lower.  The members do not make a longer run forecast for core PCE.  The final column shows the actual values of each variable in March 2022. The values in that column represent the percentage in each variable from the corresponding month (or quarter in the case of real GDP) in the previous year.  Links to the FOMC’s economic projections can be found on this page of the Federal Reserve’s web site.

At its March 2022 meeting, the FOMC began increasing its target for the federal funds rate with the expectation that a less expansionary monetary policy would slow the high rates of inflation the U.S. economy was experiencing. Note that in that month, inflation measured by the PCE was running far above the Fed’s target inflation rate of 2 percent. 

In raising its target for the federal funds rate and by also allowing its holdings of U.S. Treasury securities and mortgage-backed securities to decline, Fed Chair Jerome Powell and the other members of the FOMC were attempting to achieve a soft landing for the economy. A soft landing occurs when the FOMC is able to reduce the inflation rate without causing the economy to experience a recession. The forecast values in the table are consistent with a soft landing because they show inflation declining towards the Fed’s target rate of 2 percent while the unemployment rate remains below 4 percent—historically, a very low unemployment rate—and the growth rate of real GDP remains positive. By forecasting that real GDP would continue growing while the unemployment rate would remain below 4 percent, the FOMC was forecasting that no recession would occur.

Some economists see an inconsistency in the FOMC’s forecasts of unemployment and inflation as shown in the table. They argued that to bring down the inflation rate as rapidly as the forecasts indicated, the FOMC would have to cause a significant decline in aggregate demand. But if aggregate demand declined significantly, real GDP would either decline or grow very slowly, resulting in the unemployment rising above 4 percent, possibly well above that rate.  For instance, writing in the Economist magazine, Jón Steinsson of the University of California, Berkeley, noted that the FOMC’s “combination of forecasts [of inflation and unemployment] has been dubbed the ‘immaculate disinflation’ because inflation is seen as falling rapidly despite a very tight labor market and a [federal funds] rate that is for the most part negative in real terms (i.e., adjusted for inflation).”

Similarly, writing in the Washington Post, Harvard economist and former Treasury secretary Lawrence Summers noted that “over the past 75 years, every time inflation has exceeded 4 percent and unemployment has been below 5 percent, the U.S. economy has gone into recession within two years.”

In an interview in the Financial Times, Olivier Blanchard, senior fellow at the Peterson Institute for International Economics and former chief economist at the International Monetary Fund, agreed. In their forecasts, the FOMC “had unemployment staying at 3.5 percent throughout the next two years, and they also had inflation coming down nicely to two point something. That just will not happen. …. [E]ither we’ll have a lot more inflation if unemployment remains at 3.5 per cent, or we will have higher unemployment for a while if we are actually to inflation down to two point something.”

While all three of these economists believed that unemployment would have to increase if inflation was to be brought down close to the Fed’s 2 percent target, none were certain that a recession would occur.

What might explain the apparent inconsistency in the FOMC’s forecasts of inflation and unemployment? Here are three possibilities:

  1. Fed policymakers are relatively optimistic that the factors causing the surge in inflation—including the economic dislocations due to the Covid-19 pandemic and the Russian invasion of Ukraine and the surge in federal spending in early 2021—are likely to resolve themselves without the unemployment rate having to increase significantly. As Steinsson puts it in discussing this possibility (which he believes to be unlikely) “it is entirely possible that inflation will simply return to target as the disturbances associated with Covid-19 and the war in Ukraine dissipate.”
  2. Fed Chair Powell and other members of the FOMC were convinced that business managers, workers, and investors still expected that the inflation rate would return to 2 percent in the long run. As a result, none of these groups were taking actions that might lead to a wage-price spiral. (We discussed the possibility of a wage-price spiral in earlier blog post.) For instance, at a press conference following the FOMC meeting held on May 3 and 4, 2022, Powell argued that, “And, in fact, inflation expectations [at longer time horizons] come down fairly sharply. Longer-term inflation expectations have been reasonably stable but have moved up to—but only to levels where they were in 2014, by some measures.” If Powell’s assessment was correct that expectations of future inflation remained at about 2 percent, the probability of a soft landing was increased.
  3. We should mention the possibility that at least some members of the FOMC may have expected that the unemployment rate would increase above 4 percent—possibly well above 4 percent—and that the U.S. economy was likely to enter a recession during the coming months. They may, however, have been unwilling to include this expectation in their published forecasts. If members of the FOMC state that a recession is likely, businesses and households may reduce their spending, which by itself could cause a recession to begin. 

Sources: Martin Wolf, “Olivier Blanchard: There’s a for Markets to Focus on the Present and Extrapolate It Forever,” ft.com, May 26, 2022; Lawrence Summers, “My Inflation Warnings Have Spurred Questions. Here Are My Answers,” Washington Post, April 5, 2022; Jón Steinsson, “Jón Steinsson Believes That a Painless Disinflation Is No Longer Plausible,” economist.com, May 13, 2022; Federal Open Market Committee, “Summary of Economic Projections,” federalreserve.gov, March 16, 2022; and Federal Open Market Committee, “Transcript of Chair Powell’s Press Conference May 4, 2022,” federalreserve.gov, May 4, 2022. 

Interest Rates, the Yen, the Dollar, and the International Financial System 

Photo from the Wall Street Journal.

From early March to early May 2022, the Japanese yen persistently lost value versus the U.S. dollar. Between March 1 and May 9, the yen declined by 14% against the dollar, which is a substantial loss in value during such a short time period.  What explains the decline in the exchange rate between the yen and the dollar during that time? In Macroeconomics, Chapter 18, Section 18.2 (Economics, Chapter 28, Section 28.2), we saw that the exchange rate between most pairs of currencies fluctuates in response to these factors:

  • The foreign demand for U.S. goods
  • U.S. interest rates relative to foreign interest rates
  • Foreign demand for making direct investments or portfolio investments in the United States
  • The U.S. demand for foreign goods
  • Foreign interest rates relative to U.S interest rates
  • U.S. demand for making direct investments or portfolio investments in other countries

The following figure shows movements in the exchange rate between the yen and the U.S. dollar since 2010.  During different periods, the factor that is most important in explaining fluctuations in an exchange rate varies.  (Important note: The figure follows the convention of expressing the exchange between the yen and dollar in terms of yen per dollar. Therefore, in the figure, an increase in the exchange rate corresponds to a decrease in the value of the yen versus the dollar because it takes more yen to buy one dollar.)

From early March to early May 2022, the decline in value of the yen versus the dollar was mainly the result of U.S. interest rates increasing relative to Japanese interest rates. As the inflation rate increased rapidly in the spring of 2022, both short-term and long-term interest rates in the United States increased, partly in response to policy actions taken by the Federal Reserve. The Federal Reserve was attempting to increase interest rates in order to raise borrowing costs for households and firms, thereby slowing spending and inflation.  Japan was experiencing much lower rates of inflation—well below the Bank of Japan’s 2% annual inflation target—so the BOJ was reluctant to increase interest rates. As a consequence, the gap between the interest rate on 10-year U.S. Treasury notes and the interest rate on 10-year Japanese government bonds had risen to 2.9 percentage points.

Higher U.S. interest rates caused a shift to the right in the demand for dollars in exchange for yen as foreign investors exchanged their yen for dollars in order to buy U.S. Treasury securities and other U.S. financial assets.  As we show in Chapter 18, Figure 18.13, an increase in the demand for dollars (holding all other factors constant) increases the equilibrium exchange rate between the yen and the dollar.  

What effect does a stronger dollar and a weaker yen have on the two countries’ economies?  A weaker yen means that the yen price of imports from the United States will be higher. The higher prices will increase the Japanese inflation rate, but with inflation being low in in the spring of 2022, Japanese policymakers weren’t concerned by this effect. And because the value of U.S. imports is small relative to the size of the Japanese economy, the effect on the inflation rate wouldn’t be large in any case. The dollar price of Japanese exports to the United States will be lower, which should help Japanese firms exporting to the United States.

The effect on the U.S. economy will be the mirror image of the effect on the Japanese economy. The dollar price of Japanese imports being lower will help reduce the U.S. inflation rate, but not to a great extent because the value of Japanese imports is small relative to the size of the U.S. economy. The yen price of U.S. exports to Japan will be higher, which will be bad news for U.S. firms exporting to Japan.

Finally, many banks, other financial firms, and non-financial firms borrow money in dollars. They do so because over time the advantages of borrowing dollars has increased, even for foreign firms that receive most of their revenue in their domestic currency rather than dollars. In particular, the value of the dollar is relatively stable compared with the value of many other currencies. In addition, the Federal Reserve has made available short-term dollar loans to foreign central banks that allow those banks to provide short-term loans to local firms that are having temporary difficulty making dollar payments on their loans. By late 2021, the total amount of dollar loans made outside of the United States had risen to more than $13 trillion. In the spring of 2022, the value of the dollar was rising not just against the Japanese yen but also against many other currencies. The increase was bad news for foreign firms borrowing in U.S. dollars because it would take more of their domestic currency to buy the dollars necessary to make their loans payments. A large and prolonged increase in the value of the U.S. dollar could possibly upset the stability of the international financial system. 

Sources:  Yuko Takeo and Komaki Ito, “Japan’s Stepped-Up Warnings Fail to Stem Yen’s Slide Past 128,” bloomberg.com, April 19, 2022; Jacky Wong, “Japan Gets a Taste of the Wrong Type of Inflation,” Wall Street Journal, April 1, 2022; Megumi Fujikawa, “Yen Hits Lowest Level Since 2015, and Japan, U.S. Are OK With That,” Wall Street Journal, March 28, 2022; Bank for International Settlements, “BIS International Banking Statistics and Global Liquidity Indicators at End-September 2021,” January 28, 2022; and Federal Reserve Bank of St. Louis.

You’ve Decided to Buy Twitter, So Who Are You Going to Call?  Investment Banks, of Course

Elon Musk. (Photo from the Associated Press.)

That’s what Elon Musk did in April 2022.  In early April, Musk purchased about 9% of Twitter’s shares.  On April 25, he became the owner of Twitter by buying the roughly 90% remaining shares for $54.20 per share. The total he paid for these remaining shares came to $44 billion. Following his often unorthodox style, Musk announced his plans in a tweet on Twitter. Where did he get the money to fund such a large purchase? 

According to Forbes magazine, in March 2022, Musk was by far the richest person in the world with total wealth of about $270 billion—nearly $100 billion more than Amazon founder Jeff Bezos, who is the second-richest person.  While it appears that Musk could afford to buy Twitter without having to borrow any money,  Bloomberg estimated that in April 2022 Musk had only $3 billion in cash. Much of his wealth was in Tesla stock or his ownership shares in SpaceX and the Boring Company, both of which are private companies that, therefore, don’t have publicly traded stock. Musk was reluctant to fund all of his offer for Twitter by selling Tesla stock or finding investors willing to buy into SpaceX and Boring.

Musk turned to investment banks to help him raise the necessary funds. Investment banks, such as Goldman Sachs, differ from commercial banks in that they don’t accept deposits, and they rarely lend directly to households. Instead, investment banks have traditionally concentrated on providing advice to firms issuing stocks and bonds or to firms (and billionaires!) who are looking for ways to finance mergers or acquisitions.  A syndicate of investment banks, including Morgan Stanley (which served as Musk’s lead adviser), Bank of America, Barclays, and what an article in the Wall Street Journal described as “nearly every global blue-chip investment bank aside from the two [Goldman Sachs and JP Morgan Chase] advising Twitter,” put together the following financing package. Initially, Musk wanted to raise $46.5 billion in financing—more than in the end he needed. Of that amount, Musk would provide $21 billion and the investment banks would provide loans for the remaining $25.5 billion. As collateral for the loans, Musk pledged $60 billion of his Tesla stock. 

Musk’s financing was a combination of equity—the $21 billion in cash—and debt—the $25.5 billion in loans from investment banks. To fund his equity investment, he was considering selling some of his stock in Tesla but hoped to attract other equity investors who would put up cash in exchange for part ownership of Twitter. According to press reports, Apollo Global Management, a private equity firm was considering becoming an equity investor. (As we saw in Chapter 9, Section 9.2, private equity firms raise equity capital to invest in other firms.)  Musk’s purchase is called a leveraged buyout (LBO) because (1) he relied  on borrowing for a substantial part of his purchase of Twitter and  (2) he intended to take the company private—the company would no longer have publicly traded stock.

Why would Musk want to buy Twitter? He shared the view of some industry analysts that Twitter’s management had failed to take advantage of opportunities to increase the firm’s profit. The actions of Musk and the investment banks were part of the market for corporate control. As we discuss in Microeconomics, Chapter 8, Section 8.1 (Macroeconomics, Chapter 6, Section 6.1), in large corporations there is often a separation of ownership from control. Although the shareholders legally own the firm, the firm’s top management controls the firm’s day-to-day operations. The result can be a principal-agent problem with the management of a large firm failing to act in the best interests of the firm’s shareholders. The existence of a market for corporate control in which outsiders buy stakes in firms that appear to be poorly managed can make firms more efficient by overcoming these moral hazard problems.

             But Musk had another reason for buying Twitter. As he stated in an interview, “Having a public platform that is maximally trusted and broadly inclusive is extremely important to the future of civilization.”  It was unclear whether this and similar statements meant that  after gaining control of Twitter he might take actions that won’t necessarily increase the firm’s profitability. 

            Elon Musk’s purchase of Twitter is a high profile example of the role that investment banks can play in determining control of large corporations. 

Sources: Kurt Wagner, “Elon Musk Lands Deal to Take Twitter Private for $44 Billion,” bloomberg.com, April 25, 2022; Cara Lombardo and Liz Hoffman, “How Elon Musk Won Twitter,” Wall Street Journal, April 25, 2022; Michele F. Davis, “Elon Musk Vets Potential Equity Partners for Twitter Bid,” bloomberg.com, April 21, 2022; Sabrina Escobar, “Elon Musk Isn’t Twitter’s Only Problem. It Faces a Number of Short-Term Headwinds,” barrons.com, April 21, 2022; Cara Lombardo and Liz Hoffman, “Elon Musk Says He Has $46.5 Billion in Funding for Twitter Bid,” Wall Street Journal, April 21, 2022; Andrew Ross Sorkin, Jason Karaian, Vivian Giang, Stephen Gandel, Lauren Hirsch, Ephrat Livni, and Anna Schaverien, “Elon Musk Wants All of Twitter,” New York Times, April 14, 2022; Rob Copeland, Rebecca Elliott, and Cara Lombardo, “Elon Musk Makes $43 Billion Bid for Twitter, Says ‘Civilization’ At Stake,” Wall Street Journal, April 14, 2022; “The World’s Real-Time Billionaires,” forbes.com, April 24, 2022; Musk’s tweet announcing his offer to buy Twitter can be found here.
Hoover Institution Podcast with Lawrence Summers and John Cochrane

Lawrence Summers (Photo from harvardmagazine.com.)
John Cochrane (Photo from hoover.org.)

In several of our blog posts and podcasts, we’ve discussed Lawrence Summers’s forecasts of inflation. Beginning in February 2021, Summers, an economist at Harvard who served as Treasury secretary in the Clinton administration, argued that the United States was likely to experience rates of inflation that would be higher and persist longer than Federal Reserve policymakers were forecasting. In March 2021, the members of the Fed’s Federal Open Market Committee had an average forecast of inflation of 2.4 percent in 2021, falling to 2.0 percent in 2022. (The FOMC projections can be found here.)

In fact, inflation measured by the CPI has been above 5 percent every month since June 2021; the Fed’s preferred measure of inflation—the percentage change in the price index for personal consumption expenditures—has been above 5 percent every month since October 2021. Summers’s forecasts of inflation have turned out to be more accurate than those of the members of the Federal Open Committee. 

In this podcast, Summers discusses his analysis of inflation with four scholars from the Hoover Institution, including economist John Cochrane. Summers explains why he came to believe in early 2021 that inflation was likely to be much higher than generally expected, how long he believes high rates of inflation will persist, and whether the Fed is likely to be able to achieve a soft landing by bringing inflation back to its 2 percent target without causing a recession. The first half of the podcast, in particular, should be understandable to students who have completed the monetary and fiscal policy chapters (Macroeconomics, Chapters 15 and 16; Economics, Chapters 25 and 26).  Background useful for understanding the podcast discussion of monetary policy during the 1970s can be found in Chapter 17, Sections 17.2 and 17.3.

Is the Fed Becoming Too Political to Remain Independent?

Neel Kashkari, president of the Federal Reserve Bank of Minneapolis. Photo from the Wall Street Journal.
Pat Toomey, U.S. Senator from Pennsylvania. Photo from http://www.toomey.senate.gov.

As we discuss in Macroeconomics, Chapter 17, Section 17.4 (Economics, Chapter 27, Section 27.4), the Federal Reserve is unusual among federal government agencies in being able to operate largely independently of Congress and the president.  Congress passed the Federal Reserve Act, which established the Federal Reserve System, in 1913, and has amended it several times in the years since. (Note that, as we discuss in the Apply the Concept, “End the Fed?” in this chapter, the U.S. Constitution does not explicitly authorized the federal government to establish a central bank.) Section 2A of the act gives the Federal Reserve System the following charge:

“The Board of Governors of the Federal Reserve System and the Federal Open Market Committee shall maintain long run growth of the monetary and credit aggregates commensurate with the economy’s long run potential to increase production, so as to promote effectively the goals of maximum employment, stable prices, and moderate long-term interest rates.”

Elsewhere in the act, the Fed was given other specified responsibilities, such as supervising commercial banks that are members of the Federal Reserve System and serving on the Financial Stability Oversight Council (FSOC), which is charged with assessing risks to the financial system. 

Because Congress can change the structure and operations of the Fed at any time and because Congress has given the Fed only certain specific responsibilities, traditionally the Fed has avoided becoming involved in policy debates that are not directly concerned with its responsibilities. Over the years, most members of the Board of Governors have believed that if the Fed were to become involved in issues beyond monetary policy and the working of the financial system, Congress might decide to revise the Federal Reserve Act to reduce, or even eliminate, Fed independence.

In the spring of 2022, though, there were two instances where some members of Congress argued that the Fed had become involved in policy issues that went beyond the Fed’s responsibilities under the Federal Reserve Act. The first instance involved President Joe Biden’s nomination in January 2022 of Sarah Bloom Raskin to serve on the Fed’s Board of Governors. In 2010, Raskin was nominated to the Board of Governors by President Barack Obama and confirmed by the Senate in a voice vote without significant opposition. (In 2014, she resigned from the Board to accept a position in the Treasury Department.)

Her nomination by President Biden encountered significant opposition, however, largely because in July 2020 she had suggested that when the Fed expanded its lending programs during the Covid-19 pandemic it should have excluded firms in the oil, natural gas, and coal industries: “The Fed is ignoring clear warning signs about the economic repercussions of the impending climate crisis by taking action that will lead to increases in greenhouse gas emissions at a time when even in the short term, fossil fuels are a terrible investment.” Although her supporters argued that in formulating policy the Fed should take into account the threats to financial stability caused by climate change, when it became clear that a majority of the Senate disagreed, Raskin withdrew her nomination. 

In April 2022, some members of Congress, including Senator Pat Toomey of Pennsylvania, questioned whether it was appropriate for President Neel Kashkari of the Federal Reserve Bank of Minneapolis to formally support the campaign to amend the Minnesota state constitution to include a provision stating that, “All children have a fundamental right to a quality public education …. It is a paramount duty of the state to ensure quality public schools that fulfill this fundamental right.”

The Bank defended its support for the amendment in a statement on its website: “The Federal Reserve Bank of Minneapolis’ support of the Page amendment is closely linked to the mission of the Federal Reserve. Congress assigned the Federal Reserve the dual goals of achieving (1) stable prices and (2) maximum employment, and one of the greatest determinants of success in the job market is education.”

Senator Toomey strongly disagreed, arguing in a letter of Bank President Kashkari that: “This amendment is highly political, as it wades into an ongoing debate about whether government-run school systems are preferable to parental choice in education.” Toomey asserted that: “These political lobbying efforts by you and other Minneapolis Fed officials … are well beyond the Federal Reserve’s mandate, violate Federal Reserve Bank policies, constitute a misuse of Minneapolis Fed resources, and ultimately undermine the Federal Reserve’s independence and credibility.”

It remains to be seen whether Congress will ultimately accept the arguments of Federal Reserve policymakers such as Kashkari and Raskin that the Fed needs to interpret its mandate from Congress more broadly, or whether Congress will decide to amend the Federal Reserve Act to more explicitly limit the boundaries of Fed action—or to reduce Fed independence in some other ways. 

Sources: Sarah Bloom Raskin, “Why Is the Fed Spending So Much Money on a Dying Industry?” New York Times, May 28, 2020; Andrew Ackerman and Ken Thomas, “Sarah Bloom Raskin Withdraws as Biden’s Pick for Top Fed Banking Regulator,” Wall Street Journal, March 15, 2022; Michael S. Derby, “GOP Senator Criticizes Minneapolis Fed Over Education Issue,” Wall Street Journal, April 12, 2022; Federal Reserve Bank of Minneapolis, “Page Amendment: Every Child Deserves a Quality Public Education,” minneapolisfed.org; and Pat Toomey, “Letter to Neel Kashkari,” banking.senate. gov, April 11, 2022.

4/07/22 Podcast – Authors Glenn Hubbard & Tony O’Brien revisit the role of inflation in today’s economy & likely Fed responses in trying to manage it.

Authors Glenn Hubbard and Tony O’Brien reconsider the role of inflation in today’s economy. They discuss the Fed’s possible responses by considering responses to similar inflation threats in previous generations – notably the Fed’s response led by Paul Volcker that directly led to the early 1980’s recession. The markets are reflecting stark differences in our collective expectations about what will happen next. Listen to find out more about the Fed’s likely next steps.

Did the Fed Make a Mistake by Not Preempting Inflation?

Warning: Long post!

It now seems clear that the new monetary policy strategy the Fed announced in August 2020 was a decisive break with the past in one respect: With the new strategy, the Fed abandoned the approach dating to the 1980s of preempting inflation. That is, the Fed would no longer begin raising its target for the federal funds rate when data on unemployment and real GDP growth indicated that inflation was likely to rise. Instead, the Fed would wait until inflation had already risen above its target inflation rate. 

Since 2012, the Fed has had an explicit inflation target of 2 percent. As we discussed in a previous blog post, with the new monetary policy the Fed announced in August 2020, the Fed modified how it interpreted its inflation target: “[T]he Committee seeks to achieve inflation that averages 2 percent over time, and therefore judges that, following periods when inflation has been running persistently below 2 percent, appropriate monetary policy will likely aim to achieve inflation moderately above 2 percent for some time.”

The Fed’s new approach is sometimes referred to as average inflation targeting (AIT) because the Fed attempts to achieve its 2 percent target on average over a period of time. But as former Fed Vice Chair Richard Clarida discussed in a speech in November 2020, the Fed’s monetary policy strategy might be better called a flexible average inflation target (FAIT) approach rather than a strictly AIT approach. Clarida noted that the framework was asymmetric, meaning that inflation rates higher than 2 percent need not be offset with inflation rates lower than 2 percent: “The new framework is asymmetric. …[T]he  goal of monetary policy … is to return inflation to its 2 percent longer-run goal, but not to push inflation below 2 percent.” And: “Our framework aims … for inflation to average 2 percent over time, but it does not make a … commitment to achieve … inflation outcomes that average 2 percent under any and all circumstances ….”

Inflation began to increase rapidly in mid-2021. The following figure shows three measure of inflation, each calculated as the percentage change in the series from the same month in the previous year: the consumer price index (CPI), the personal consumption expenditure (PCE) price index, and the core PCE—which excludes the prices of food and energy. Inflation as measured by the CPI is sometimes called headline inflation because it’s the measure of inflation that most often appears in media stories about the economy. The PCE is a broader measure of the price level in that it includes the prices of more consumer goods and services than does the CPI. The Fed’s target for the inflation rate is stated in terms of the PCE. Because prices of food and inflation fluctuate more than do the prices of other goods and services, members of the Fed’s Federal Open Market Committee (FOMC) generally consider changes in the core PCE to be the best measure of the underlying rate of inflation. 

The figure shows that for most of the period from 2002 through early 2021, inflation as measured by the PCE was below the Fed’s 2 percent target. Since that time, inflation has been running well above the Fed’s target. In February 2022, PCE inflation was 6.4 percent. (Core PCE inflation was 5.4 percent and CPI inflation was 7.9 percent.) At its March 2022 meeting the FOMC begin raising its target for the federal funds rate—well after the increase in inflation had begun. The Fed increased its target for the federal funds rate by 0.25 percent, which raised the target from 0 to 0.25 percent to 0.25 to 0.50 percent.

Should the Fed have taken action to reduce inflation earlier? To answer that question, it’s first worth briefly reviewing Fed policy during the Great Inflation of 1968 to 1982. In the late 1960s, total federal spending grew rapidly as a result of the Great Society social programs and the war in Vietnam. At the same time,  the Fed increased the rate of growth of the money supply. The result was an end to the price stability of the 1952-1967 period during which the annual inflation rate had averaged only 1.6 percent. 

The 1973 and 1979 oil price shocks also contributed to accelerating inflation. Between January 1974 and June 1982, the annual inflation rate averaged 9.3 percent. This was the first episode of sustained inflation outside of wartime in U.S. history—until now. Although the oil price shocks and expansionary fiscal policy contributed to the Great Inflation, most economists, inside and outside of the Fed, eventually concluded that Fed policy failures were primarily responsible for inflation becoming so severe.

The key errors are usually attributed to Arthur Burns, who was Fed Chair from January 1970 to March 1978. Burns, who was 66 at the time of his appointment, had made his reputation for his work on business cycles, mostly conducted prior to World War II at the National Bureau of Economic Research. Burns was skeptical that monetary policy could have much effect on inflation. He was convinced that inflation was mainly the result of structural factors such as the power of unions to push up wages or the pricing power of large firms in concentrated industries.

Accordingly, Burns was reluctant to raise interest rates, believing that doing so hurt the housing industry without reducing inflation. Burns testified to Congress that inflation “poses a problem that traditional monetary and fiscal remedies cannot solve as quickly as the national interest demands.” Instead of fighting inflation with monetary policy he recommended “effective controls over many, but by no means all, wage bargains and prices.” (A collection Burns’s speeches can be found here.)

Few economists shared Burns’s enthusiasm for wage and price controls, believing that controls can’t end inflation, they can only temporarily reduce it while causing distortions in the economy. (A recent overview of the economics of price controls can be found here.) In analyzing this period, economists inside and outside the Fed concluded that to bring the inflation rate down, Burns should have increased the Fed’s target for the federal funds rate until it was higher than the inflation rate. In other words, the real interest rate, which equals the nominal—or stated—interest rate minus the inflation rate, needed to be positive. When the real interest rate is negative, a business may, for example, pay 6% on a bond when the inflation rate is 10%, so they’re borrowing funds at a real rate of −4%. In that situation, we would expect  borrowing to increase, which can lead to a boom in spending. The higher spending worsens inflation.

Because Burns and the FOMC responded only slowly to rising inflation, workers, firms, and investors gradually increased their expectations of inflation. Once higher expectation inflation became embedded, or entrenched, in the U.S. economy it was difficult to reduce the actual inflation rate without increasing the target for the federal funds rate enough to cause a significant slowdown in the growth of real GDP and a rise in the unemployment rate. As we discuss in Macroeconomics, Chapter 17, Sections 17.2 and 17.3 (Economics, Chapter 27, Sections 27.2 and 27.3), the process of the expected inflation rate rising over time to equal the actual inflation rate was first described in research conducted separately by Nobel Laureates Milton Friedman and Edmund Phelps during the 1960s. 

An implication of Friedman and Phelps’s work is that because a change in monetary policy takes more than a year to have its full effect on the economy, if the Fed waits until inflation has already increased, it will be too late to keep the higher inflation rate from becoming embedded in interest rates and long-term labor and raw material contracts.  

Paul Volcker, appointed Fed chair by Jimmy Carter in 1979, showed that, contrary to Burns’s contention, monetary policy could, in fact, deal with inflation. By the time Volcker became chair, inflation was above 11%. By raising the target for the federal funds rate to 22%—it was 7% when Burns left office—Volcker brought the inflation rate down to below 4%, but only at the cost of a severe recession during 1981–1982, during which the unemployment rate rose above 10 percent for the first time since the Great Depression of the 1930s. Note that whereas Burns had largely failed to increase the target for the federal funds as rapidly as inflation had increased—resulting in a negative real federal funds rate—Volcker had raised the target for the federal funds rate above the inflation rate—resulting in a positive real federal funds rate. 

Because the 1981–1982 recession was so severe, the inflation rate declined from above 11 percent to below 4 percent. In Chapter 17, Figure 17.10 (reproduced below), we plot the course of the inflation and unemployment rates from 1979 to 1989.

Caption: Under Chair Paul Volcker, the Fed began fighting inflation in 1979 by reducing the growth of the money supply, thereby raising interest rates. By 1982, the unemployment rate had risen to 10 percent, and the inflation rate had fallen to 6 percent. As workers and firms lowered their expectations of future inflation, the short-run Phillips curve shifted down. The adjustment in expectations allowed the Fed to switch to an expansionary monetary policy, which by 1987 brought unemployment back to the natural rate of unemployment, with an inflation rate of about 4 percent. The orange line shows the actual combinations of unemployment and inflation for each year from 1979 to 1989.

The Fed chairs who followed Volcker accepted the lesson of the 1970s that it was important to head off potential increases in inflation before the increases became embedded in the economy. For instance, in 2015, then Fed Chair Janet Yellen in explaining why the FOMC was likely to raise to soon its target for the federal funds rate noted that: “A substantial body of theory, informed by considerable historical evidence, suggests that inflation will eventually begin to rise as resource utilization continues to tighten. It is largely for this reason that a significant pickup in incoming readings on core inflation will not be a precondition for me to judge that an initial increase in the federal funds rate would be warranted.”

Between 2015 and 2018, the FOMC increased its target for the federal funds rate nine times, raising the target from a range of 0 to 0.25 percent to a range of 2.25 to 2.50 percent. In 2018, Raphael Bostic, president of the Federal Reserve Bank of Atlanta justified these rate increases by noting that “… we shouldn’t forget that [the Fed’s] credibility [with respect to keeping inflation low] was hard won. Inflation expectations are reasonably stable for now, but we know little about how far the scales can tip before it is no longer so.”

He used the following figure to illustrate his point.

Bostic interpreted the figure as follows:

“[The red areas in the figure are] periods of time when the actual unemployment rate fell below what the U.S. Congressional Budget Office now estimates as the so-called natural rate of unemployment. I refer to these episodes as “high-pressure” periods. Here is the punchline. Dating back to 1960, every high-pressure period ended in a recession. And all but one recession was preceded by a high-pressure period….

I think a risk management approach requires that we at least consider the possibility that unemployment rates that are lower than normal for an extended period are symptoms of an overheated economy. One potential consequence of overheating is that inflationary pressures inevitably build up, leading the central bank to take a much more “muscular” stance of policy at the end of these high-pressure periods to combat rising nominal pressures. Economic weakness follows [resulting typically, as indicated in the figure by the gray band, in a recession].”

By July 2019, a majority of the members of the FOMC, including Chair Powell, had come to believe that with no sign of inflation accelerating, they could safely cut the federal funds rate. But they had not yet explicitly abandoned the view that the FOMC should act to preempt increases in inflation. The formal change came in August 2020 when, as discussed earlier, the FOMC announced the new FAIT. 

At the time the FOMC adopted its new monetary policy strategy, most members expected that any increase in inflation owing to problems caused by the Covid-19 pandemic—particularly the disruptions in supply chains—would be transitory. Because inflation has proven to be more persistent than Fed policymakers and many economists expected, two aspects of the FAIT approach to monetary policy have been widely discussed: First, the FOMC did not explicitly state by how much inflation can exceed the 2 percent target or for how long it needs to stay there before the Fed will react. The failure to elaborate on this aspect of the policy has made it more difficult for workers, firms, and investors to gauge the Fed’s likely reaction to the acceleration in inflation that began in the spring of 2021. Second, the FOMC’s decision to abandon the decades-long policy of preempting inflation may have made it more difficult to bring inflation down to the 2 percent target without causing a recession. 

Federal Reserve Governor Lael Brainard recently remarked that “it is of paramount importance to get inflation down” and some Fed policymakers believe that the FOMC will have to begin increasing its target for the federal funds rate more aggressively. (The speech in which Governor Brainard discusses her current thinking on monetary policy can be found here.) For instance James Bullard, president of the Federal Reserve Bank of St. Louis, has argued in favor of raising the target to above 3 percent this year. With the Fed’s preferred measure of inflation running above 5 percent, it would take substantial increases int the target to achieve a positive real federal funds rate.

It is an open question whether Jerome Powell finds himself in a position similar to that of Paul Volcker in 1979:  Rapid increases in interest rates may be necessary to keep inflation from accelerating, but doing so risks causing a recession. In a recent speech (found here), Powell pledged that: “We will take the necessary steps to ensure a return to price stability. In particular, if we conclude that it is appropriate to move more aggressively by raising the federal funds rate by more than 25 basis points at a meeting or meetings, we will do so.”

But Powell argued that the FOMC could achieve “a soft landing, with inflation coming down and unemployment holding steady” even if it is forced to rapidly increase its target for the federal funds rate:

“Some have argued that history stacks the odds against achieving a soft landing, and point to the 1994 episode as the only successful soft landing in the postwar period. I believe that the historical record provides some grounds for optimism: Soft, or at least softish, landings have been relatively common in U.S. monetary history. In three episodes—in 1965, 1984, and 1994—the Fed raised the federal funds rate significantly in response to perceived overheating without precipitating a recession.”

Some economists have been skeptical that a soft landing is likely. Harvard economist and former Treasury Secretary Lawrence Summers has been particularly critical of Fed policy, as in this Twitter thread. Summers concludes that: “I am apprehensive that we will be disappointed in the years ahead by unemployment levels, inflation levels, or both.” (Summers and Harvard economist Alex Domash provide an extended discussion in a National Bureau of Economic Research Working Paper found here.)

Clearly, we are in a period of great macroeconomic uncertainty.