A Review of Recent Macro Data

Some interesting macro data were released during the past two weeks. On the key issues, the data indicate that inflation continues to run in the range of 3.0 percent to 3.5 percent, although depending on which series you focus on, you could conclude that inflation has dropped to a bit below 3 percent or that it is still in vicinity of 4 percent.  On balance, output and employment data seem to be indicating that the economy may be cooling in response to the contractionary monetary policy that the Federal Open Market Committee began implementing in March 2022.

We can summarize the key data releases.

Employment, Unemployment, and Wages

On Friday morning, the Bureau of Labor Statistics (BLS) released its Employment Situation report. (The full report can be found here.) Economists and policymakers—notably including the members of the Federal Reserve’s Federal Open Market Committee (FOMC)—typically focus on the change in total nonfarm payroll employment as recorded in the establishment, or payroll, survey. That number gives what is generally considered to be the best indicator of the current state of the labor market.

The previous month’s report included a surprisingly strong net increase of 336,000 jobs during September. Economists surveyed by the Wall Street Journal last week forecast that the net increase in jobs in October would decline to 170,000. The number came in at 150,000, slightly below that estimate. In addition, the BLS revised down the initial estimates of employment growth in August and September by a 101,000 jobs. The figure below shows the net gain in jobs for each  month of 2023.

Although there are substantial fluctuations, employment increases have slowed in the second half of the year. The average increase in employment from January to June was 256,667. From July to October the average increase declined to 212,000. In the household survey, the unemployment rate ticked up from 3.8 percent in September to 3.9 percent in October. The unemployment rate has now increased by 0.5 percentage points from its low of 3.4 percent in April of this year. 

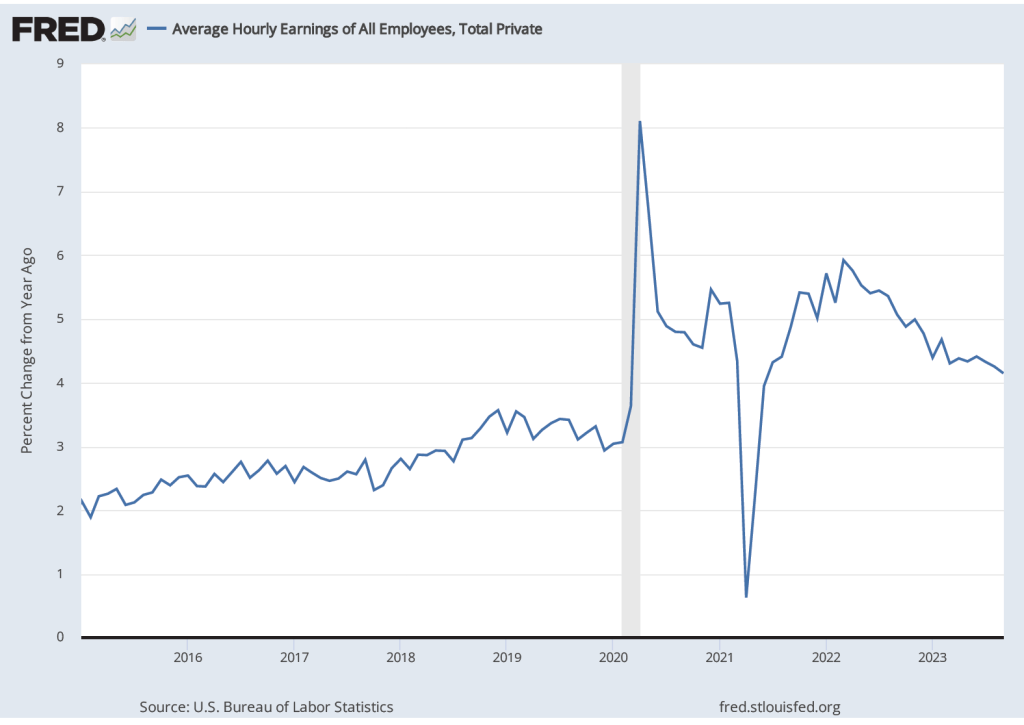
Finally, data in the employment report provides some evidence of a slowing in wage growth. The following figure shows wage inflation as measured by the percentage increase in average hourly earnings (AHE) from the same month in the previous year. The increase in October was 4.1 percent, continuing a generally downward trend since March 2022, although still somewhat above wage inflation during the pre-2020 period.

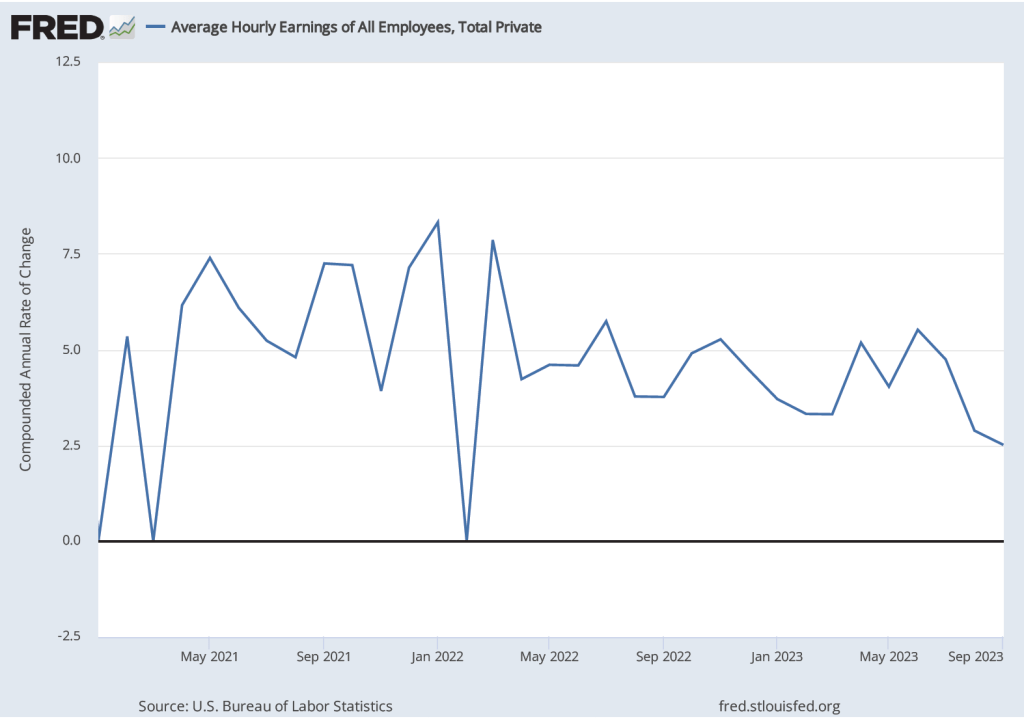
As the following figure shows, September growth in average hourly earnings measured as a compound annual growth rate was 2.5 percent, which—if sustained—would be consistent with a rate of price inflation in the range of the Fed’s 2 percent target.  (The figure shows only the months since January 2021 to avoid obscuring the values for recent months by including the very large monthly increases and decreases during 2020.)

Job Openings and Labor Turnover Survey (JOLTS) 

On November 1, the BLS released its Job Openings and Labor Turnover Survey (JOLTS) report for September 2023. (The full report can be found here.) The report indicated that the number of unfilled job openings was 9.5 million, well below the peak of 11.8 million job openings in December 2021 but—as shown in the following figure—well above prepandemic levels.

The following figure shows the ratio of the number of job opening to the number of unemployed people. The figure shows that, after peaking at 2.0 job openings per unemployed person in in March 2022, the ratio has decline to 1.5 job opening per unemployed person in September 2022. While high, that ratio was much closer to the ratio of 1.2 that prevailed during the year before the pandemic. In other words, while the labor market still appears to be strong, it has weakened somewhat in recent months.

Employment Cost Index

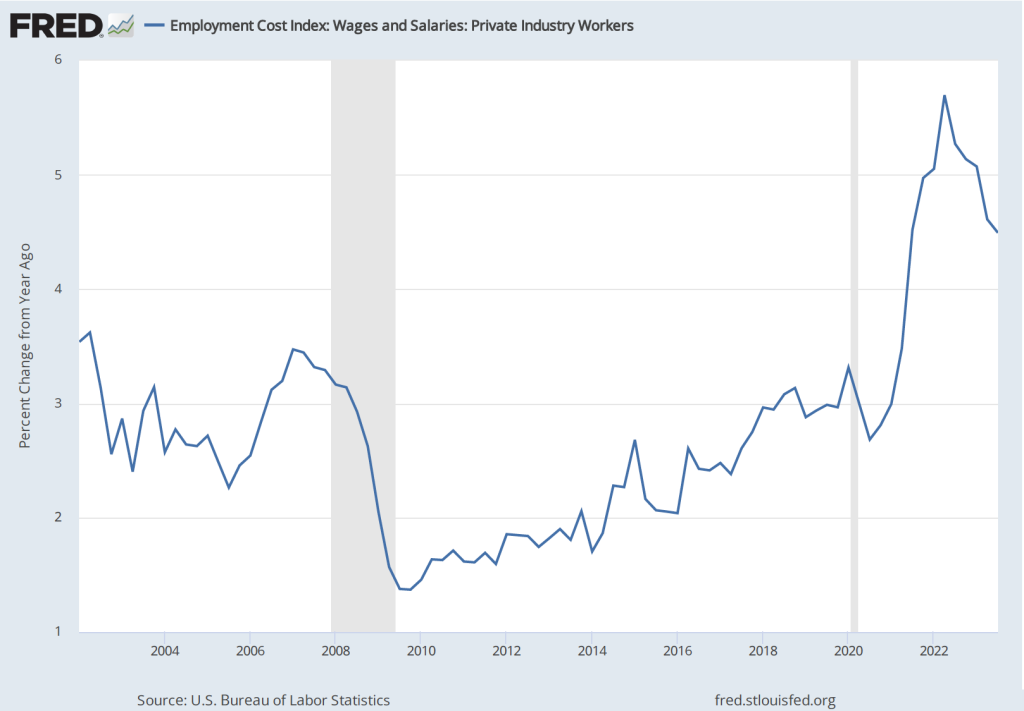
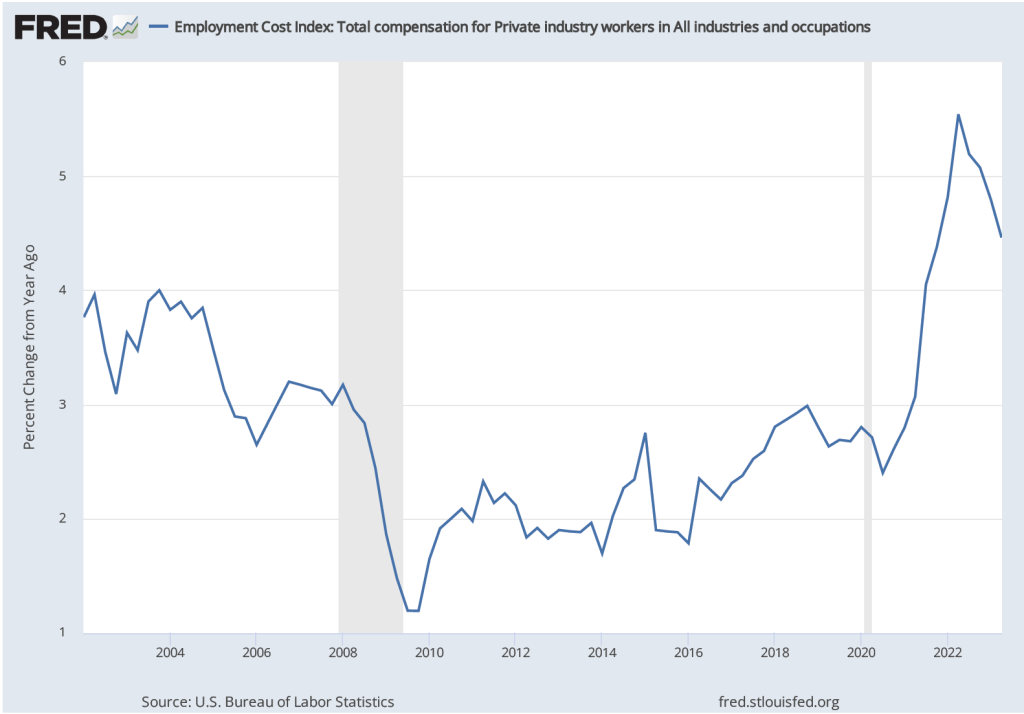
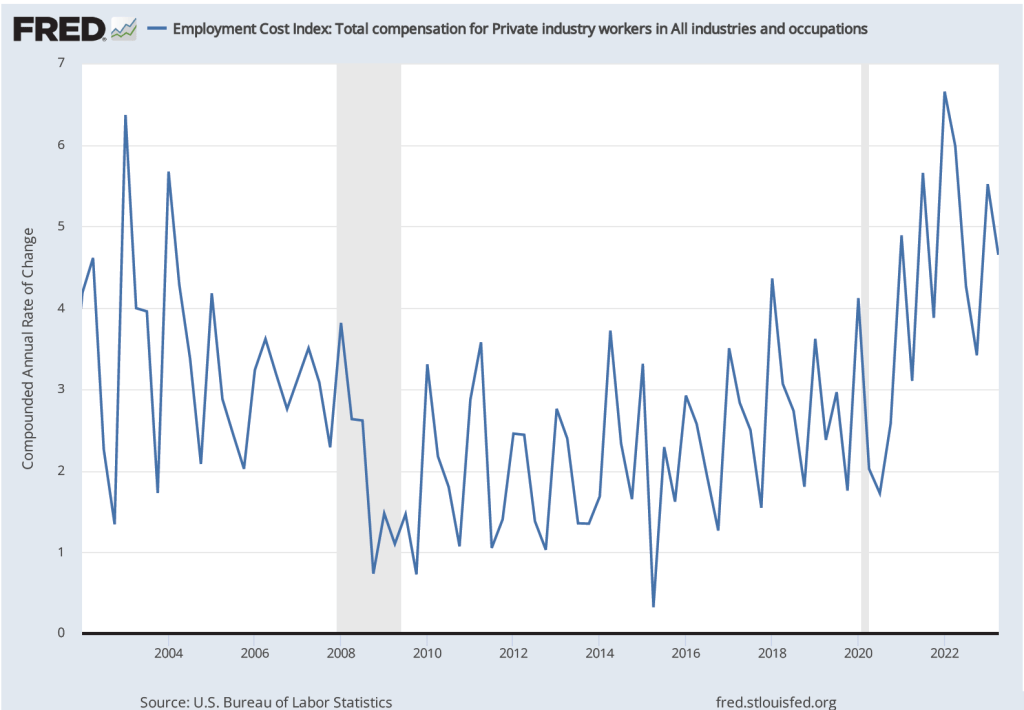
As we note in this blog post, the employment cost index (ECI), published quarterly by the BLS, measures the cost to employers per employee hour worked and can be a better measure than AHE of the labor costs employers face. The BLS released its most recent report on October 31. (The report can be found here.) The first figure shows the percentage change in ECI from the same quarter in the previous year. The second figure shows the compound annual growth rate of the ECI. Both measures show a general downward trend in the growth of labor costs, although compound annual rate of change shows an uptick in the third quarter of 2023. (We look at wages and salaries rather than total compensation because non-wage and salary compensation can be subject to fluctuations unrelated to underlying trends in labor costs.)

The Federal Open Market Committee’s October 31-November 1 Meeting

As was widely expected from indications in recent statements by committee members, the Federal Open Market Committee voted at its most recent meeting to hold constant its targe range for the federal funds rate at 5.25 percent to 5.50 percent. (The FOMC’s statement can be found here.)

At a press conference following the meeting, Fed Chair Jerome Powell remarks made it seem unlikely that the FOMC would raise its target for the federal funds rate at its December 14-15 meeting—the last meeting of 2023. But Powell also noted that the committee was unlikely to reduce its target for the federal funds rate in the near future (as some economists and financial jounalists had speculated): “The fact is the Committee is not thinking about rate cuts right now at all. We’re not talking about rate cuts, we’re still very focused on the first question, which is: have we achieved a stance of monetary policy that’s sufficiently restrictive to bring inflation down to 2 percent over time, sustainably?” (The transcript of Powell’s press conference can be found here.)

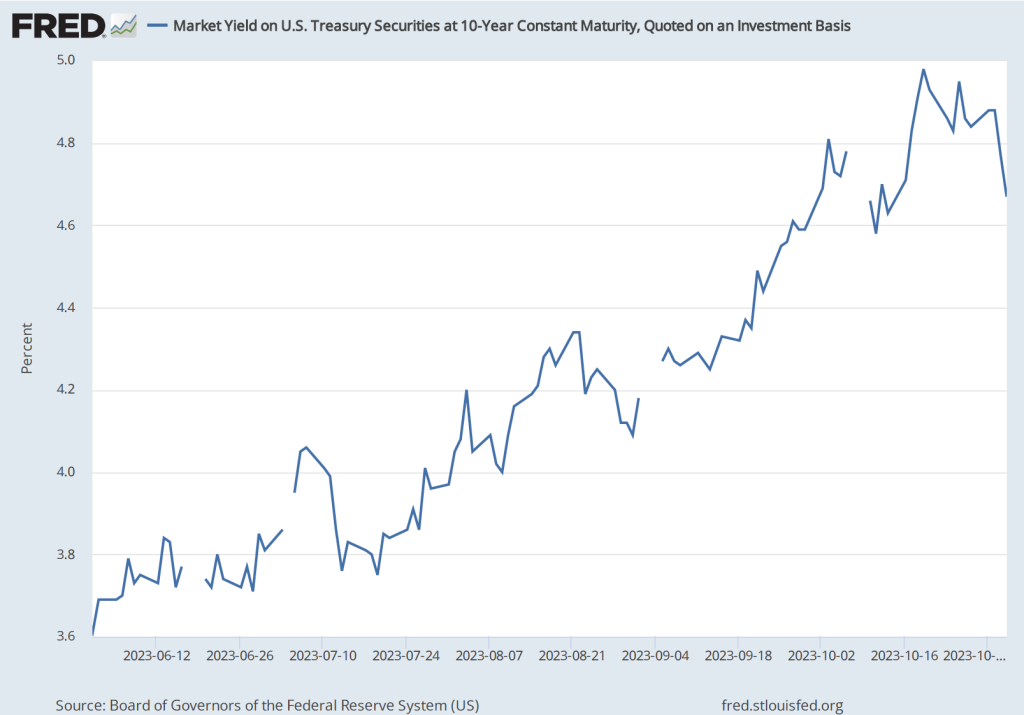
Investors in the bond market reacted to Powell’s press conference by pushing down the interest rate on the 10-year Treasury note, as shown in the following figure. (Note that the figure gives daily values with the gaps representing days on which the bond market was closed) The interest rate on the Treasury note reflects investors expectations of future short-term interest rates (as well as other factors). Investors interpreted Powell’s remarks as indicating that short-term rates may be somewhat lower than they had previously expected.

Real GDP and the Atlanta Fed’s Real GDPNow Estimate for the Fourth Quarter

On October 26, the Bureau of Economic Analysis (BEA) released its advance estimate of real GDP for the third quarter of 2023. (The full report can be found here.) We discussed the report in this recent blog post. Although, as we note in that post, the estimated increase in real GDP of 4.9 percent is quite strong, there are indications that real GDP may be growing significantly more slowly during the current (fourth) quarter.

The Federal Reserve Bank of Atlanta compiles a forecast of real GDP called GDPNow. The GDPNow forecast uses data that are released monthly on 13 components of GDP. This method allows economists at the Atlanta Fed to issue forecasts of real GDP well in advance of the BEA’s estimates. On November 1, the GDPNow forecast was that real GDP in the fourth quarter of 2023 would increase at a slow rate of 1.2 percent. If this preliminary estimate proves to be accurate, the growth rate of the U.S. economy will have sharply declined from the third to the fourth quarter.

Fed Chair Powell has indicated that economic growth will likely need to slow if the inflation rate is to fall back to the target rate of 2 percent. The hope, of course, is that contractionary monetary policy doesn’t cause aggregate demand growth to slow to the point that the economy slips into a recession.

Very Strong GDP Report

Photo from Lena Buonanno

This morning the Bureau of Economic Analysis (BEA) released its advance estimate of GDP for the third quarter of 2023. (The report can be found here.) The BEA estimates that real GDP increased by 4.9 percent at an annual rate in the third quarter—July through September. That was more than double the 2.1 percent increase in real GDP in the second quarter, and slightly higher than the 4.7 percent that economists surveyed by the Wall Street Journal last week had expected. The following figure shows the rates of GDP growth each quarter beginning in 2021.

Note that the BEA’s most recent estimates of real GDP during the first two quarters of 2022 still show a decline. The Federal Reserve’s Federal Open Market Committee only switched from a strongly expansionary monetary policy, with a target for the federal funds of effectively zero, to a contractionary monetary policy following its March 16, 2022 meeting. That real GDP was declining even before the Fed had pivoted to a contractionary monetary policy helps explain why, despite strong increases employment during this period, most economists were expecting that the U.S. economy would experience a recession at some point during 2022 or 2023. This expectation was reinforced when inflation soared during the summer of 2022 and it became clear that the FOMC would have to substantially raise its target for the federal funds rate.

Clearly, today’s data on real GDP growth, along with the strong September employment report (which we discuss in this blog post), indicates that the chances of the U.S. economy avoiding a recession in the future have increased and are much better than they seemed at this time last year.

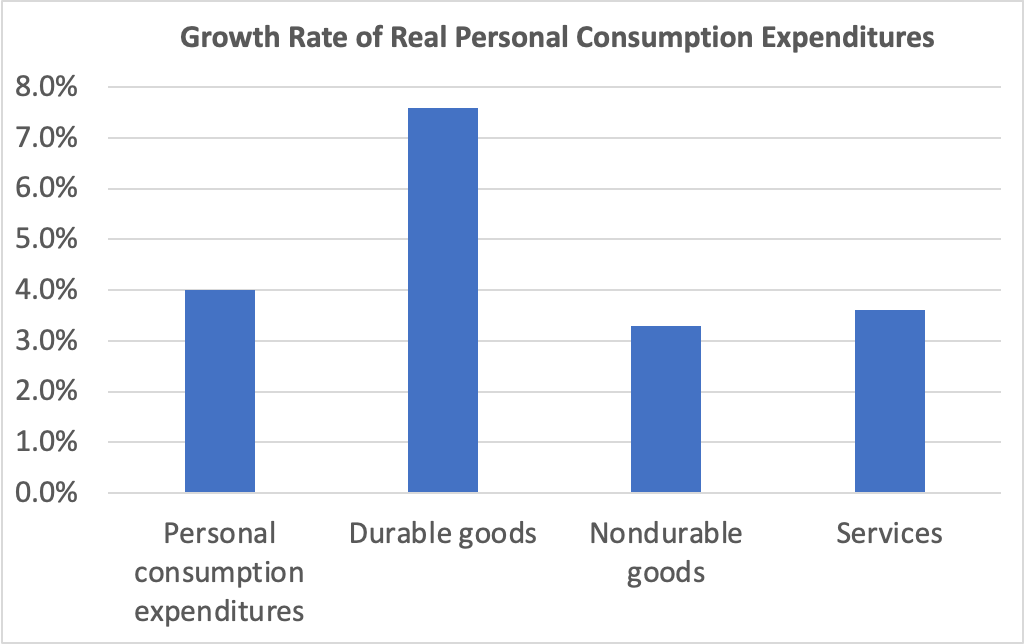
Consumer spending was the largest contributor to third quarter GDP growth. The following figure shows growth rates of real personal consumption expenditures and the subcategories of expenditures on durable goods, nondurable goods, and services. There was strong growth in each component of consumption spending. The 7.6 percent increase in expenditures on durables was particularly strong, particularly given that spending on durables had fallen by 0.3 percent in the second quarter.

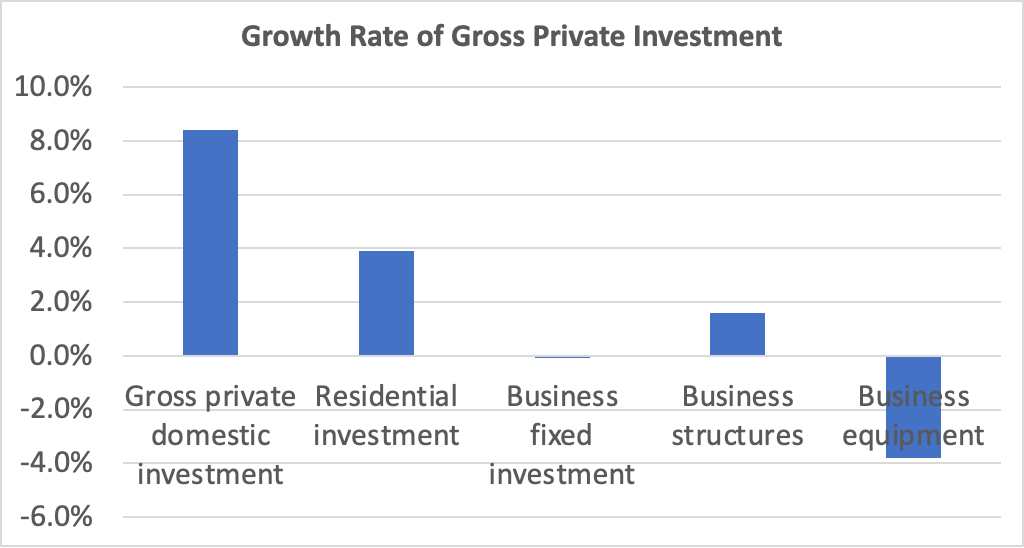
Investment spending and its components were a more mixed bag, as shown in the following figure. Overall, gross private domestic investment increased at a very strong rate of 8.4 percent—the highest rate since the fourth quarter of 2021. Residential investment increased 3.9 percent, which was particularly notable following nine consecutive quarters of decline and during a period of soaring mortgage interest rates. But business fixed investment was noticeably weak, falling by 0.1 percent. Spending on structures—such as factories and office buildings—increased by only 1.6 percent, while spending on equipment fell by 3.8 percent.

Today’s real GDP report also contained data on the private consumption expenditure (PCE) price index, which the FOMC uses tp determine whether it is achieving its goal of a 2 percent inflation rate. The following figure shows inflation as measured using the PCE and the core PCE—which excludes food and energy prices—since the beginning of 2015. (Note that these inflation rates are measured using quarterly data and as compound annual rates of change.) Despite the strong growth in real GDP and employment, inflation as measured by PCE increased only from 2.5 percent in the second quarter to 2.9 percent in the third quarter. Core PCE, which may be a better indicator of the likely course of inflation in the future, continued the long decline that began in first quarter of 2022 by failling from 3.7 percent to 2.9 percent.

The combination of strong growth in real GDP and declining inflation indicates that the Fed appears well on its way to a soft landing—achieving  a return to its 2 percent inflation target without pushing the economy into a recession. There are reasons to be cautious, however.

GDP, inflation, and employment data are all subject to—possibly substantial—revisions. So growth may have been significantly slower than today’s advance estimate of real GDP indicates. Even if the estimate of real GDP growth of 4.9 percent proves in the long run to have been accurate, there are reasons to doubt whether output growth can be maintained at near that level. Since 2000, annual growth in real GDP has average only 2.1 percent. For GDP to begin increasing at a rate substantially higher than that would require a significant expansion in the labor force and an increase in productivity. While either or both of those changes may occur, they don’t seem likely as of now.

In addition, the largest contributor to GDP growth in the third quarter was from consumption expenditures. As households continue to draw down the savings they built up as a result of the federal government’s response to the Covid recession of 2020, it seems unlikely that the current pace of consumer spending can be maintained. Finally, the lagged effects of monetary policy—particularly the effects of the interest rate on the 10-year Treasury note having risen to nearly 5 percent (which we discuss in our most recent podcast)—may substantially reduce growth in real GDP and employment in future quarters.

But those points shouldn’t distract from the fact that today’s GDP report was good news for the economy.

Surprisingly Strong Jobs Report

Photo from Lena Buonanno

When the Bureau of Labor Statistics’ Employment Situation report is released on the first Friday of each month economists and policymakers—notably including the members of the Federal Reserve’s Federal Open Market Committee (FOMC)—focus on the change in total nonfarm payroll employment as recorded in the establishment, or payroll, survey. That number gives what is generally considered to be the best indicator of the current state of the labor market. The most recent report showed a surprisingly strong net increase of 336,000 jobs during September. (The report can be found here.)

According to a survey by the Wall Street Journal, economists had been expecting an net increase in jobs of only 170,000. The larger than expected increase indicated that the economy might be expanding more rapidly than had been thought, raising the possibility that the FOMC might increase its target for the federal funds rate at least once more before the end of the year.

To meet increases in the growth of the U.S. working-age population, the economy needs to increase the total jobs available by approximately 80,000 jobs per month. A net increase of more than four times that amount may be an indication of an overheated job market. As always, one difficulty with drawing that conclusion is determing how many more people might be pulled into the labor market by a strong demand for workers. An increase in labor supply can potentially satisify an increase in labor demand without leading to an acceleration in wage growth and price inflation.

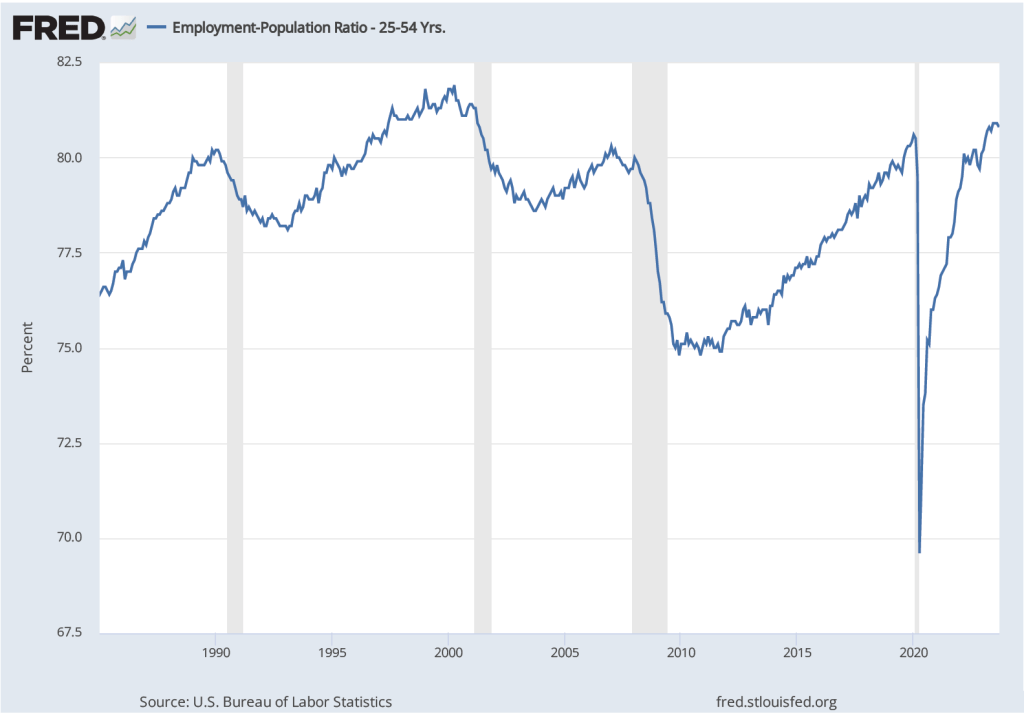
The following figure shows the employment-to-population ratio for workers ages 25 to 54—so-called prime-age workers—for the period since 1985. In September 2023, the ratio was 80.8 perccent, down slightly from 80.9 percent in August, but above the levels reached in early 2020 just before the effects of the Covid–19 pandemic were felt in the United States. The ratio was still below the record high of 81.9 percent reached in April 2000. The population of prime-age workers is about 128 million. So, if the employment-population ratio were to return to its 2000 peak, potentially another 1.3 million prime-age workers might enter the labor market. The likelihood of that happening, however, is difficult to gauge.

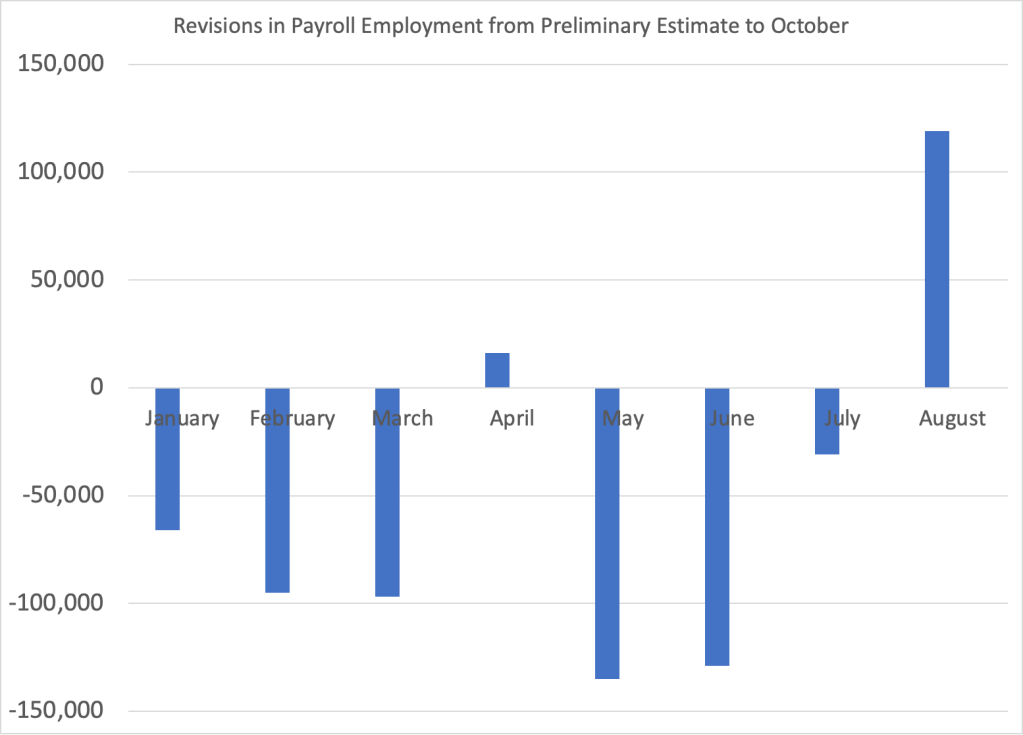
A couple of other points about the September employment report. First, it’s worth keeping in mind that the results from the establishment survey are subject to often substantial revisisons. The figure below shows the revisions the BLS has released as of October to their preliminary estimates for each month of 2023. In three of these eight months the revisions so far have been greater than 100,000 jobs. As we discuss in Macroeconomics, Chapter 9, Section 9.1 (Economics, Chapter 19, Section 19.1 and Essentials of Economics, Chapter 13, Section 13.1), the revisions that the BLS makes to its employment estimates are likely to be particularly large when the economy is about to enter a period of significantly lower or higher growth. So, the large revisions to the preliminary employment estimates in most months of 2023 may indicate that the surprisingly large preliminary estimate of a 336,000 increase in net employment will be revised lower in coming months.

Finally, data in the employment report provides some evidence of a slowing in wage growth, despite the sharp increase in employment. The following figure shows wage inflation as measured by the percentage increase in average hourly earnings (AHE) from the same month in the previous year. The increase in September was 4.2 percent, continuing a generally downward trend since March 2022, although still somewhat above wage inflation during the pre-2020 period.

As the following figure shows, September growth in average hourly earnings measured as a compound annual growth rate was 2.5 percent, which—if sustained—would be consistent with a rate of price inflation in the range of the Fed’s 2 percent target.  (The figure shows only the months since January 2021 to avoid obscuring the values for recent months by including the very large monthly increases and decrease during 2020.)

As we note in this blog post, the employment cost index (ECI), published quarterly by the BLS, measures the cost to employers per employee hour worked and can be a better measure than AHE of the labor costs employers face. The first figure shows the percentage change in ECI from the same quarter in the previous year. The second figure shows the compound annual growth rate of the ECI. Both measures show a general downward trend in the growth of labor costs, although the measures are somewhat dated because the most recent values are for the second quarter of 2023.

Ultimately, the key question is one we’ve considered in previous blog posts (most recently here) and podcasts (most recently here): Will the Fed be able to achieve a soft landing by bringing inflation down to its 2 percent target without triggering a recession? The September jobs report can be interpreted as increasing the probability of a soft landing if the slowing in wage growth is emphasized but decreasing the probability if the Fed decides that the strong employment growth is real—that is, the September increase is not likely to be revised sharply lower in coming months—and requires additional increases in the target for the federal funds rate. It’s worth mentioning, of course, that factors over which the Fed has no control, such as a federal government shutdown, rising oil prices, or uncertainty resulting from the attack on Israel by Hamas, will also affect the likelihood of a soft landing.

Inflation, Disinflation, Deflation, and Consumers’ Perceptions of Inflation

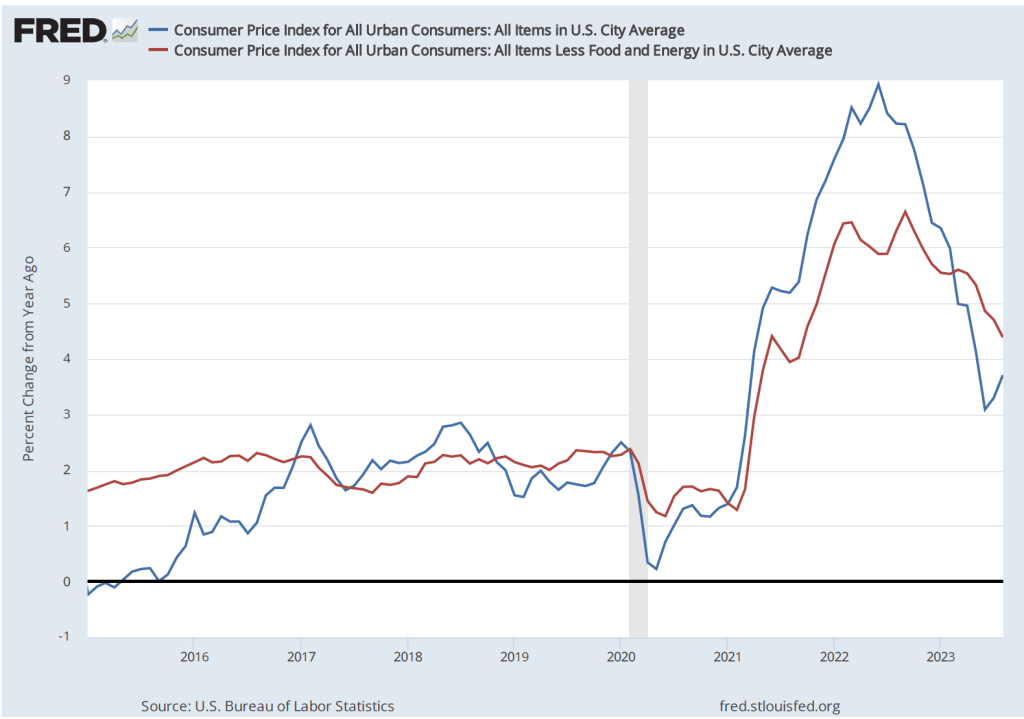
Inflation has declined, although many consumers are skeptical. What explains consumer skepticism? First we can look at what’s happened to inflation in the period since the beginning of 2015. The figure below shows inflation measured as the percentage change in the consumer price index (CPI) from the same month in the previous year. We show both so-called headline inflation, which includes the prices of all goods and services in the index, and core inflation, which excludes energy and food prices. Because energy and food prices can be volatile, most economists believe that the core inflation provides a better indication of underlying inflation. 

Both measures show inflation following a similar path. The inflation rate begins increasing rapidly in the spring of 2021, reaches a peak in the summer of 2022, and declines from there. Headline CPI peaks at 8.9 percent in June 2022 and declines to 3.7 percent in August 2023. Core inflation reaches a peak of 6.6 percent in September 2022 and declines to 4.4 percent in August 2022.

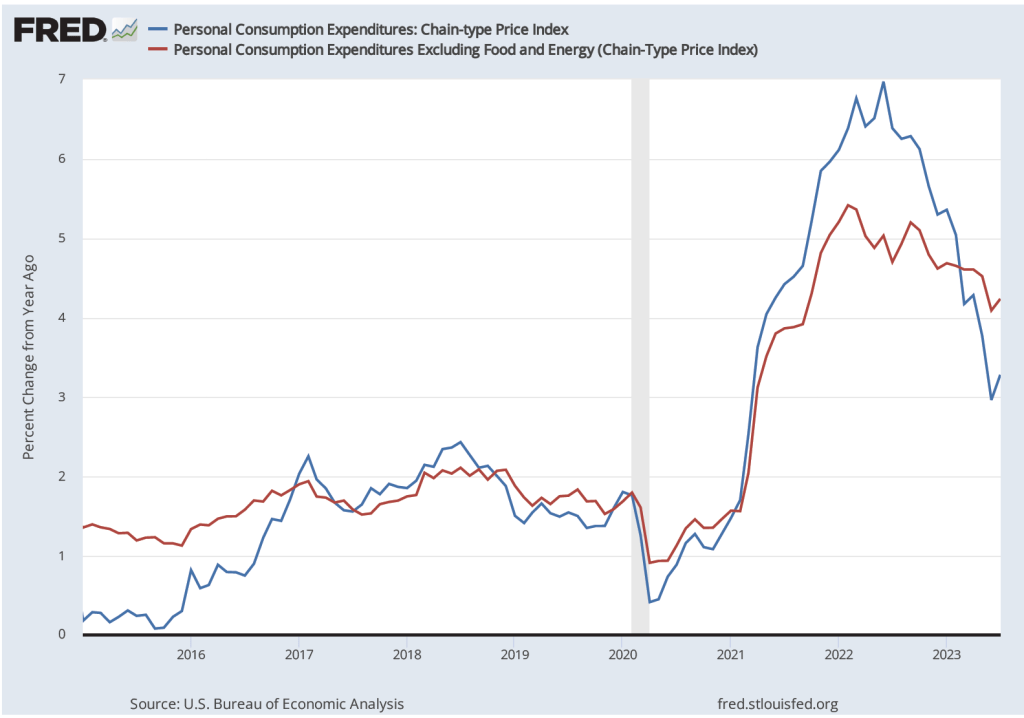
As we discuss in Macroeconomics, Chapter 15, Section 15.5 (Economics, Chapter 25, Section 25.5, and Essentials of Economics, Chapter 17, Section 17.5), the Fed’s inflation target is stated in terms of the personal consumption expenditure (PCE) price index, not the CPI. The PCE includes the prices of all the goods and services included in the consumption component of GDP. Because the PCE includes the prices of more goods and services than does the CPI, it’s a broader measure of inflation. The following figure shows inflation as measured by the PCE and by the core PCE, which excludes energy and food prices.

Inflation measured using the PCE or the core PCE shows the same pattern as inflation measured using the CPI: A sharp increase in inflation in the spring of 2021, a peak in the summer of 2022, and a decline thereafter.

Although it has yet to return to the Fed’s 2 percent target, the inflation rate has clearly fallen substantially during the past year. Yet surveys of consumers show that majorities are unconvinced that inflation has been declining. A Pew Research Center poll from June found that 65 percent of respondents believe that inflation is “a very big problem,” with another 27 percent believing that inflation is “a moderately big problem.” A Gallup poll from earlier in the year found that 67 percent of respondents thought that inflation would go up, while only 29 percent thought it would go down. Perhaps not too surprisingly, another Gallup poll found that only 4 percent of respondents had a “great deal” of confidence in Federal Reserve Chair Jerome Powell, with another 32 percent having a “fair amount” of confidence. Fifty-four percent had either “only a little” confidence in Powell or “almost none.”

There are a couple of reasons why most consumers might believe that the Fed is doing worse in its fight against inflation than the data indicate. First, few people follow the data releases as carefully as economists do. As a result, there can be a lag between developments in the economy—such as declining inflation—and when most people realize that the development has occurred.

Probably more important, though, is the fact that most people think of inflation as meaning “high prices” rather than “increasing prices.” Over the past year the U.S. economy has experienced disinflation—a decline in the inflation rate. But as long as the inflation rate is positive, the price level continues to increase. Only deflation—a declining price level—would lead to prices actually falling. And an inflation rate of 3 percent to 4 percent, although considerably lower than the rates in mid-2022, is still significantly higher than the inflation rates of 2 percent or below that prevailed during most of the time since 2008.

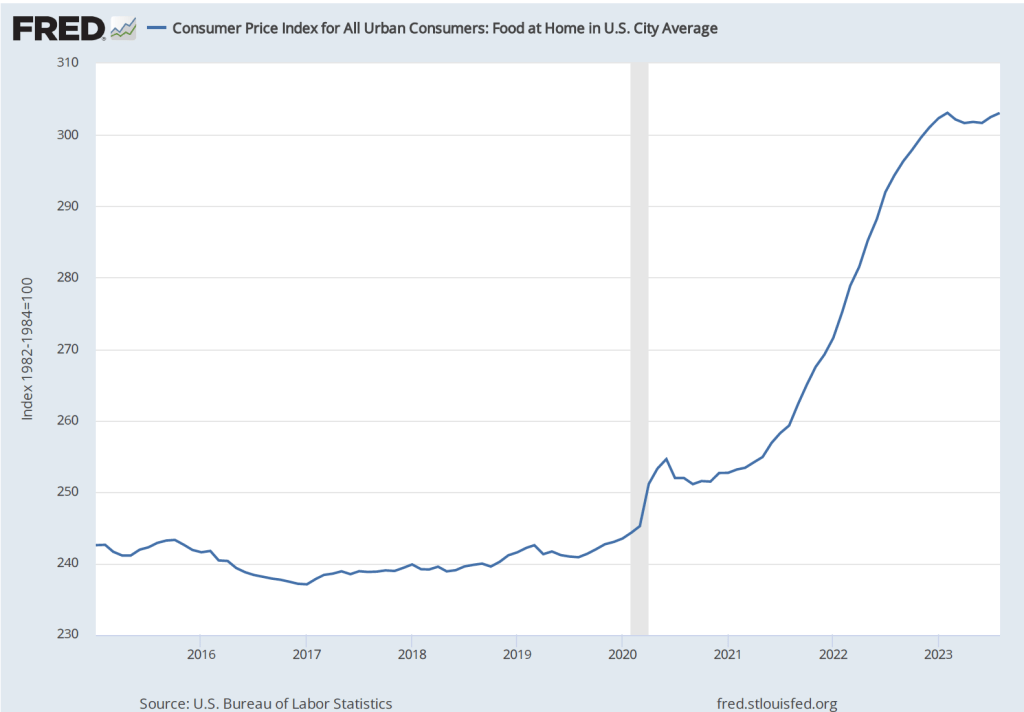
Although, core CPI and core PCE exclude energy and food prices, many consumers judge the state of inflation by what’s happening to gasoline prices and the price of food in supermarkets. These are products that consumers buy frequently, so they are particularly aware of their prices. The figure below shows the component of the CPI that represents the prices of food consumers buy in groceries or supermarkets and prepare at home. The price of food rose rapidly beginning in the spring of 2021. Althought increases in food prices leveled off beginning in early 2023, they were still about 24 percent higher than before the pandemic.

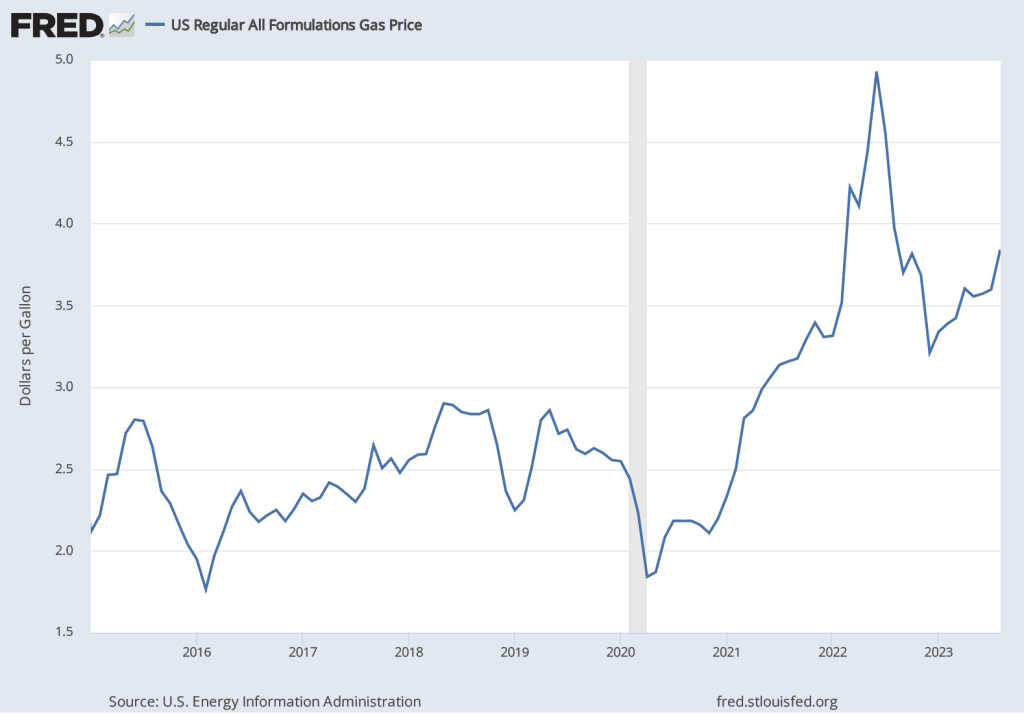
There is a similar story with respect to gasoline prices. Although the average price of gasoline in August 2023 at $3.84 per gallon is well below its peak of nearly $5.00 per gallon in June 2022, it is still well above average gasoline prices in the years leading up to the pandemic.

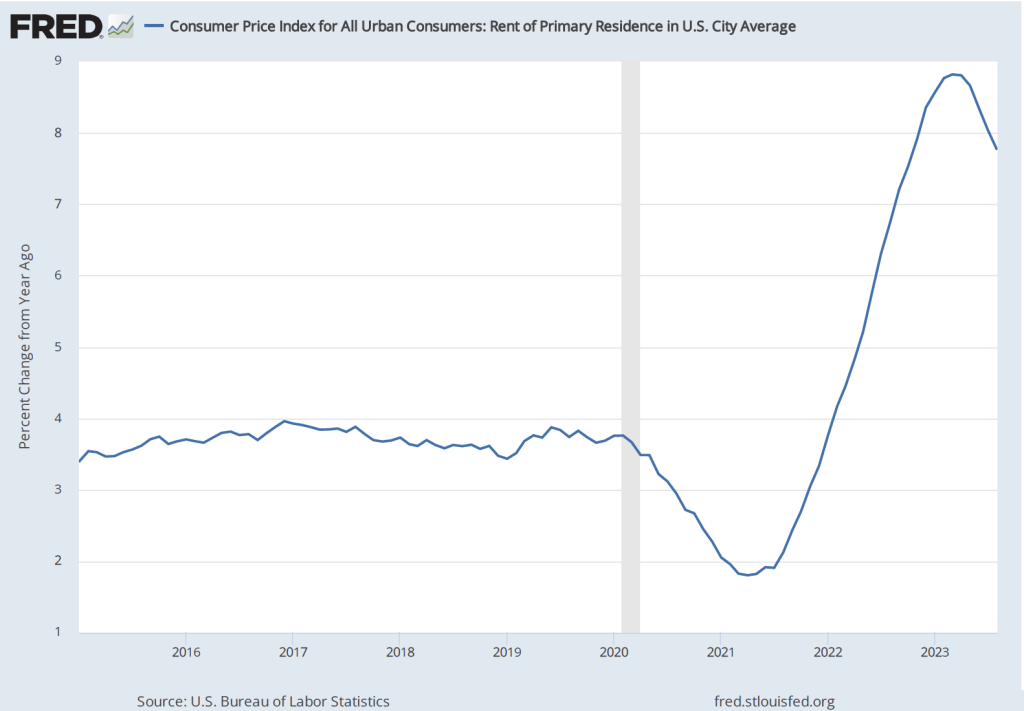
Finally, the figure below shows that while percentage increases in rent are below their peak, they are still well above the increases before and immediately after the recession of 2020. (Note that rents as included in the CPI include all rents, not just rental agreements that were entered into that month. Because many rental agreements, particularly for apartments in urban areas, are for one year or more, in any given month, rents as measured in the CPI may not accurately reflect what is currently happening in rental housing markets.)

Because consumers continue to pay prices that are much higher than the prices they were paying prior to the pandemic, many consider inflation to still be a problem. Which is to say, consumers appear to frequently equate inflation with high prices, even when the inflation rate has markedly declined and prices are increasing more slowly than they were.

Solved Problem: The Mexican “Super Peso”

A food market in Mexico. (Photo from mexperience.com)

Supports: Macroeconomics, Chapter 18, Economics, Chapter 28, and Essentials of Economics, Chapter 19.

In September 2023, an article in the Los Angeles Times discussed the effects on Mexico of the “’super-peso,’ as the Mexican currency has been dubbed since steadily gaining 18% on the dollar during the last 12 months.” The article focused on the effects of the rising value of the peso on people in Mexico who receive U.S. dollars from relatives and friends working in the United States. Many of the people who receive these payments rely on them to buy basic necessities, such as food and clothing. An article in the Wall Street Journal on the effects of the rising value of the peso noted that: “The peso’s strength has helped curtail inflation ….” 

  1. Briefly explain what the Los Angeles Times article means by the peso “gaining” on the U.S. dollar? Does the peso gaining on the dollar mean that someone exchanging dollars for pesos would receive more pesos or fewer pesos? 
  2. As a result of the rising value of the peso would people in Mexico receiving dollar payments from relatives in the United States be better off or worse off? Briefly explain. 
  3. Why would the increasing strength of the peso reduce the inflation rate in Mexico?
  4. The Los Angeles Times article also noted that: “The Bank of Mexico’s benchmark interest rate of 11.25% is more than double the U.S. Federal Reserve target …” Does this fact have anything to do with the increase in the value of the peso in exchange for the dollar? Briefly explain. 

Solving the Problem

Step 1:  Review the chapter material. This problem is about the effect of fluctuations in the exchange rate and the relationship between interest rates and exchange rates, so you may want to review Macroeconomics, Chapter 18, Section 8.2, “The Foreign Exchange Market and Exchange Rates,” or the corresponding sections in Economics, Chapter 28 or Essentials of Economics, Chapter 19.

Step 2: Answer part a. by explaining what it means for the peso to be “gaining” on the U.S. dollar. The peso gaining on the dollar means that someone can exchange fewer pesos to receive a dollar. Or, alternatively, someone exchanging dollars for pesos will receive fewer pesos. 

Step 3: Answer part b. by explaining why people in Mexico receiving dollar payments from relatives in the United States will be worse off because of the rising value of the peso. People living in Mexico needs pesos to buy food and clothing from Mexican stores. Because people will receive fewer pesos in exchange for the dollars they receive from relatives in the United States, these people will have been made worse off by the rising value of the peso. 

Step 4: Answer part c. by explaining why the increasing strength of the peso will reduce inflation in Mexico. A country’s inflation rate includes the prices of imported goods as well as the prices of domestically produced goods.  A stronger peso means that fewer pesos are needed to buy the same quantity of a foreign currency, which reduces the peso price of imports from that country. For example, a stronger peso reduces the number of pesos Mexican consumers pay to buy $10 worth of cucumbers imported from the United States. Falling prices of imported goods will reduce the inflation rate in Mexico. 

Step 5: Answer part d. by explaining why higher interest rates in Mexico relative to interest rates in the United States will increase the value of the peso in exchange for the U.S. dollar. If interest rates in Mexico rise relative to interest rates in the United States, Mexican financial assets, such as Mexican government bonds, will be more desirable, causing investors to increase their demand for the pesos they need to buy Mexican financial assets. The resulting shift to the right in the demand curve for pesos will cause the equilibrium exchange rate between the peso and the dollar to increase. 

Sources:  Patrick J. McDonnell, “Mexico’s Peso Is Soaring. That’s Bad News for People Who Rely on Dollars Sent from the U.S.,” Los Angeles Times, September 5, 2023; and Anthony Harrup, “Mexico’s Peso Surges to Strongest Level Since 2015,” Wall Street Journal, July 13, 2023.

What Explains the Surprising Surge in the Federal Budget Deficit?

Figure from CBO’s monthly budget report.

During 2023, GDP and employment have continued to expand. Between the second quarter of 2022 and the second quarter of 2023, nominal GDP increased by 6.1 percent. From July 2022 to July 2023, total employment increased by 3.3 million as measured by the establishment (or payroll) survey and by 3.0 as measured by the household survey. (In this post, we discuss the differences between the employment measures in the two surveys.)

We would expect that with an expanding economy, federal tax revenues would rise and federal expenditures on unemployment insurance and other transfer programs would decline, reducing the federal budget deficit. (We discuss the effects of the business cycle on the federal budget deficit in Macroeconomics, Chapter 16, Section 16.6, Economics, Chapter 26, Section 26.6, and Essentials of Economics, Chapter 18, Section 18.6.) In fact, though, as the figure from the Congressional Budget Office (CBO) at the top of this post shows, the federal budget deficit actually increased substantially during 2023 in comparison with 2022. The federal budget deficit from the beginning of government’s fiscal year on October 1, 2022 through July 2023 was $1,617 billion, more than double the $726 billion deficit during the same period in fiscal 2022.

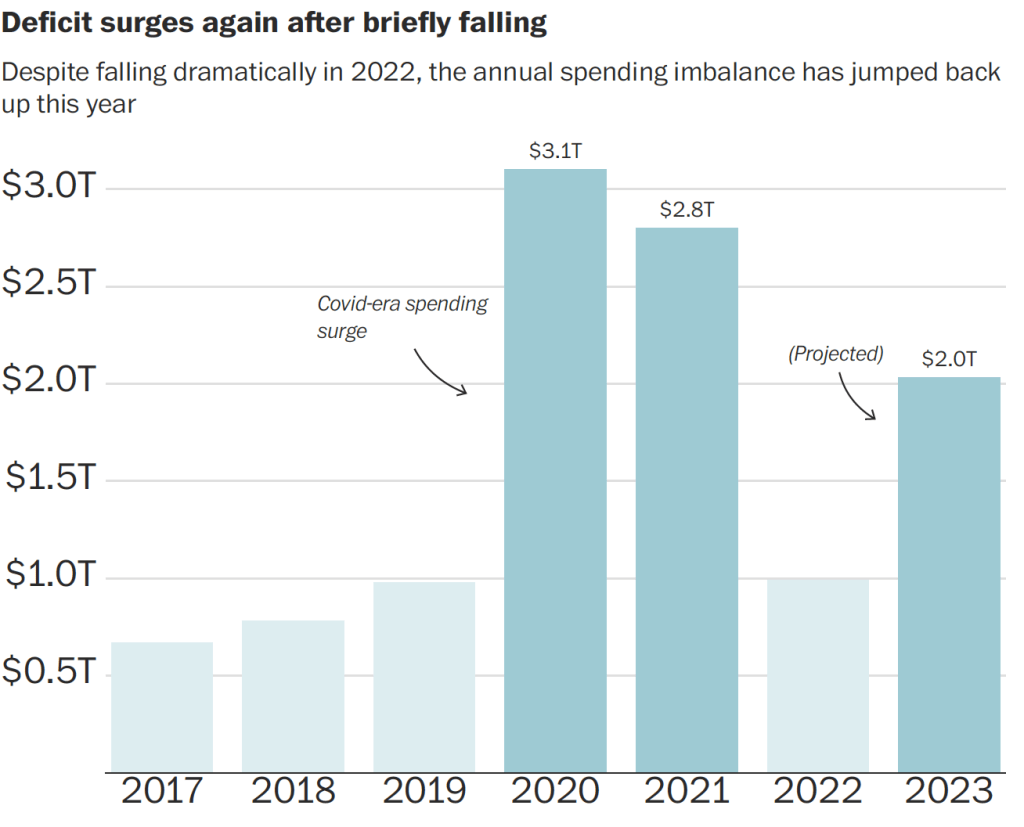
The following figure from an article in the Washington Post uses data from the Committee for a Responsible Federal Budget to illustrate changes in the federal budget deficit in recent years. The figure shows the sharp decline in the federal budget deficit in 2022 as the economic recovery from the Covid–19 pandemic increased federal tax receipts and reduced federal expenditures as emergency spending programs ended. Given the continuing economic recovery, the surge in the deficit during 2023 was unexpected.

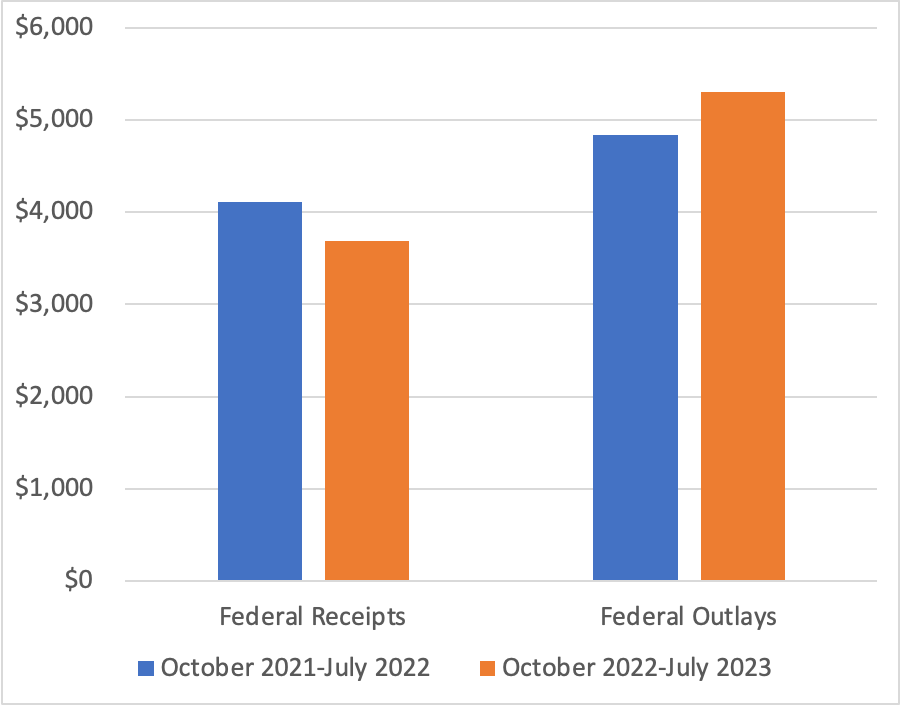
As the following figure shows, using CBO data, federal receipts—mainly taxes—are 10 percent lower this year than last year, and federal outlays—including transfer payments—are 11 percent higher. For receipts to fall and outlays to increase during an economic expansion is very unusual. As an article in the Wall Street Journal put it: “Something strange is happening with the federal budget this year.”

Note: The values on the vertical axis are in billions of dollars.
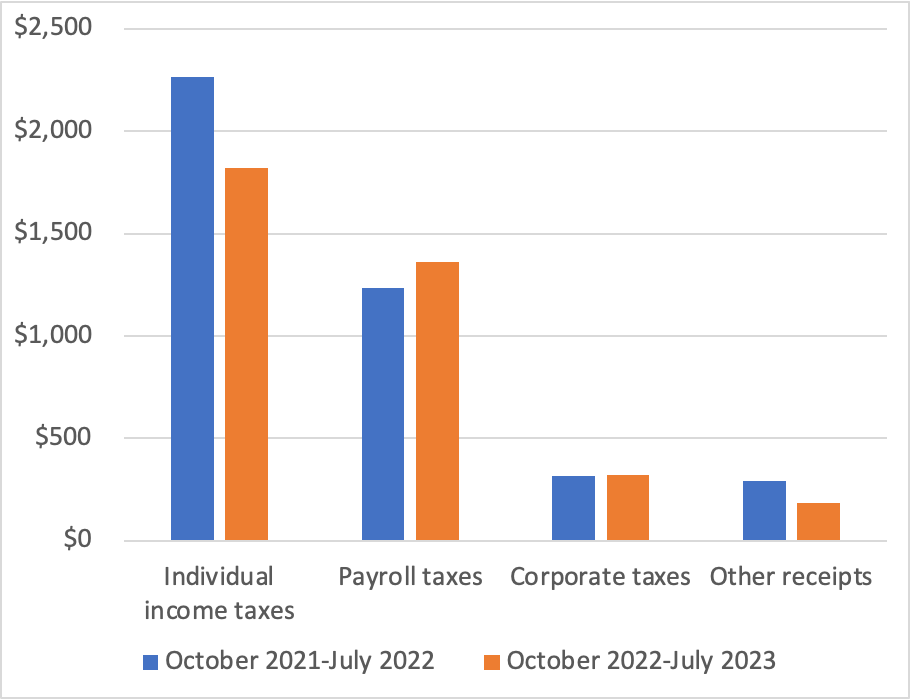
The following figure shows a breakdown of the decline in federal receipts. While corporate taxes and payroll taxes (primarily used to fund the Social Security and Medicare systems) increased, personal income tax receipts fell by 20 percent, and “other receipts” fell by 37 percent. The decline in other receipts is largely the result of a decline in payments from the Federal Reserve to the U.S. Treasury from $99 billion in 2022 to $1 billion in 2023. As we discuss in Macroeconomics, Chapter 17, Section 17.4 (Economics, Chapter 27, Section 27.4), Congress intended the Federal Reserve to be independent of the rest of the government. Unlike other federal agencies and departments, the Fed is self-financing rather than being financed by Congressional appropriations. Typically, the Fed makes a profit because the interest it earns on its holdings of Treasury securities is more than the interest it pays banks on their reserve deposits. After paying its operating costs, the Fed pays the rest of its profit to the Treasury. But as the Fed increased its target for the federal funds rate beginning in March 2022, it also increased the interest rate it pays banks on their reserve deposits. Because most of the securities it holds pay low interest rates, the Fed has begun running a deficit, reducing the payments it makes to the Treasury.

Note: The values on the vertical axis are in billions of dollars.

The reasons for the sharp decline in individual income taxes are less clear. The decline was in the “nonwithheld category” of individual income taxes; federal income taxes withheld from worker paychecks increased. People who are self-employed or who receive substantial income from sources such as capital gains from selling stocks, make quarterly estimated income tax payments. It’s these types of personal income taxes that have been unexpectedly low. Accordingly, smaller capital gains may be one explanation for the shortfall in federal revenues, but a more complete explanation won’t be possible until more data become available later in the year.

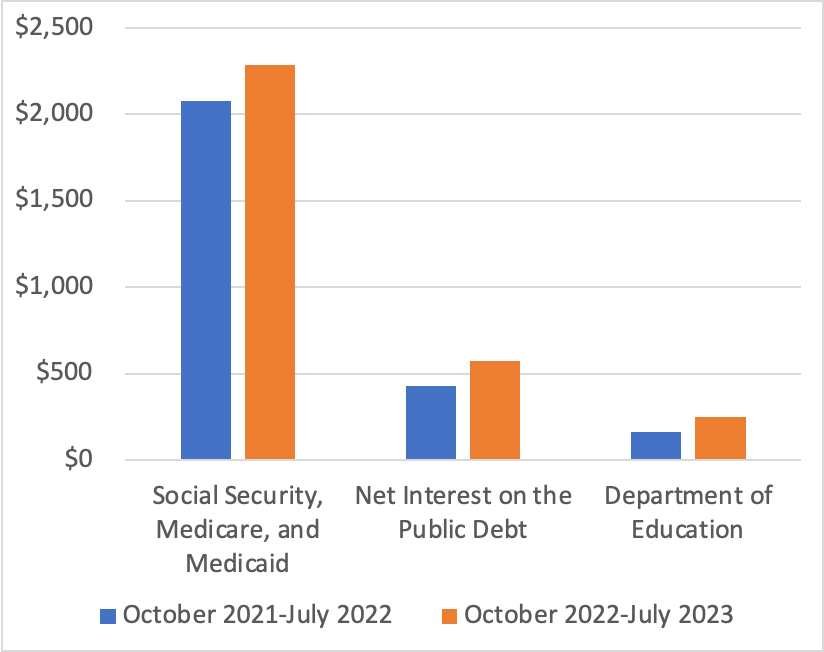
The following figure shows the categories of federal outlays that have increased the most from 2022 to 2023. The largest increase is in spending on Social Security, Medicare, and Medicaid, with spending on Social Security alone increasing by $111 billion. This increase is due partly to an increase in the number of retired workers receiving benefits and partly to the sharp rise in inflation, because Social Security is indexed to changes in the consumer price index (CPI). Spending on Medicare increased by $66 billion or a surprisingly large 18 percent. Interest payments on the public debt (also called the federal government debt or the national debt) increased by $146 billion or 34 percent because interest rates on newly issued Treasury securities rose as nominal interest rates adjusted to the increase in inflation and because the public debt had increased significantly as a result of the large budget deficits of 2020 and 2021. The increase in spending by the Department of Education reflects the effects of the changes the Biden administration made to student loans eligible for the income-driven repayment plan. (We discuss the income-driven repayment plan for student loans in this blog post.)

Note: The values on the vertical axis are in billions of dollars.

The surge in federal government outlays occurred despite a $120 billion decline in refundable tax credits, largely due to the expiration of the expansion of the child tax credit Congress enacted during the pandemic, a $98 billion decline in Treasury payments to state and local governments to help offset the financial effects of the pandemic, and $59 billion decline in federal payments to hospitals and other medical facilities to offset increased costs due to the pandemic.

In this blog post from February, we discussed the challenges posed to Congress and the president by the CBO’s forecasts of rising federal budget deficits and corresponding increases in the federal government’s debt. The unexpected expansion in the size of the federal budget deficit for the current fiscal year significantly adds to the task of putting the federal government’s finances on a sound basis.

The Labor Market Continues to Cool  

As we discussed in this post, most recent data are consistent with the labor market having cooled, which should reduce upward pressure on wages and prices. On Friday morning, the Bureau of Labor Statistics (BLS) released its employment report for August 2023. (The report can be found here.) On balance, the data in the report are consistent with the labor market continuing to cool.

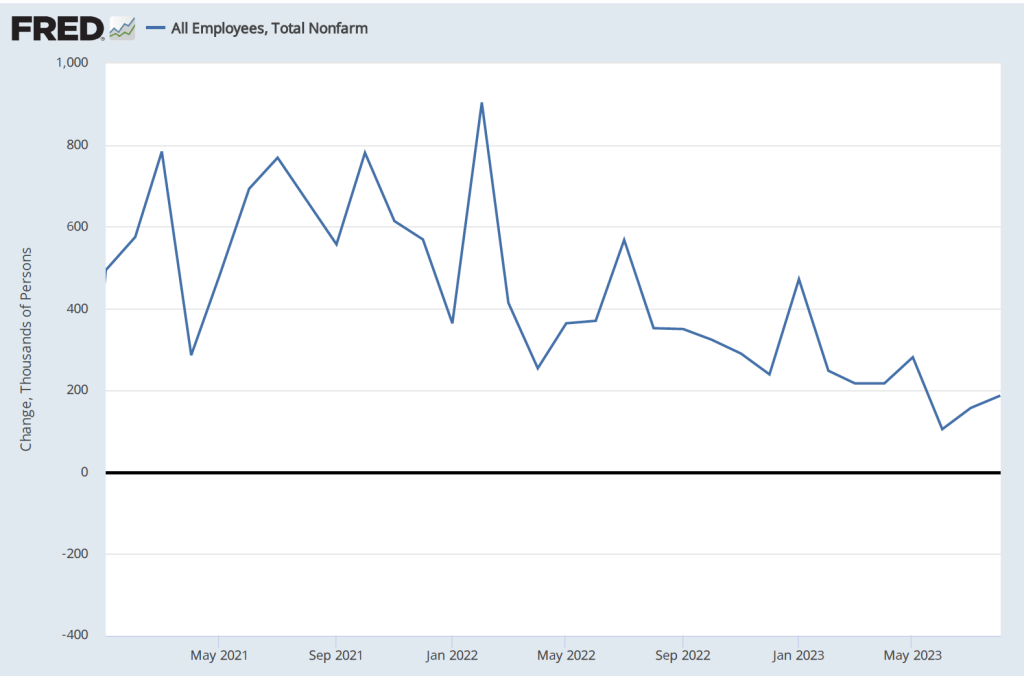
Data from the establishment survey showed an increase in payroll employment of 187,000, which is close to the increase of 170,000 economists surveyed by the Wall Street Journal had forecast. The following figure shows monthly changes in payroll employment since January 2021.

Although the month-to-month changes have been particularly volatile during this period as the U.S. economy recovered from the Covid–19 recession, the general trend in job creation has been downward. The following table shows average monthly increases in payroll employment for 2021, 2022, and 2023 through August. In the most recent three-month period, the average monthly increase in employment was 150,000.

PeriodAverage Monthly Increases in Employment
2021606,000
2022399,000
Jan.-Aug. 2023236,000

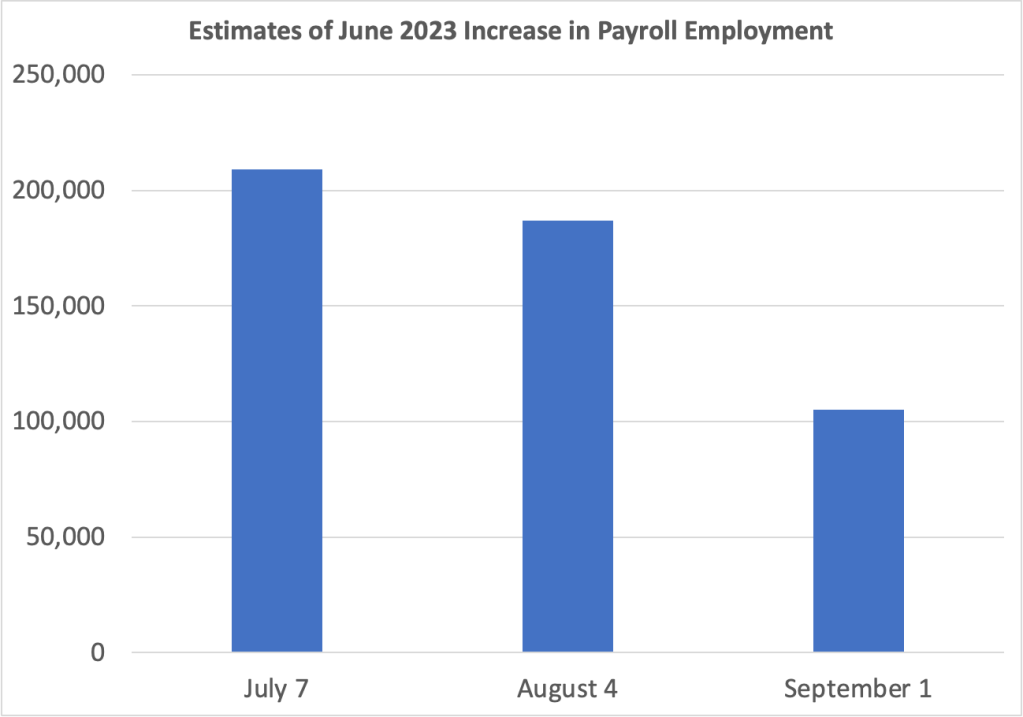
The BLS revised downward its previous estimates of employment increases in June and July by a combined 110,000. The changes to the estimate of the employment increase for June are particularly notable. As the following graph shows, on July 7, the BLS initially estimated the increase as 209,000. The BLS’s first revision on August 4, lowered the estimate to an increase of 187,000. The BLS’s second revision on September 1, lowered the estimate further to 105,000. In other words, the BLS now estimates that employment increased by only half as much in June as it initially reported. As we discuss in Macroeconomics, Chapter 9, Section 9.1 (Economics, Chapter 19, Section 19.1 and Essentials of Economics, Chapter 13, Section 13.1), the revisions that the BLS makes to its employment estimates are likely to be particularly large when the economy is about to enter a period of significantly lower or higher growth. So, the large revisions to the June employment estimate may indicate that during the summer economic growth slowed and labor market conditions eased.

Data from the household survey showed the unemployment rate increasing from 3.5 percent in July to 3.8 percent in August. The following figure shows that the unemployment rate has fluctuated in a narrow range since March 2022. Employment as estimated from the household survey increased by 222,000. The seeming paradox of the number of people employed and the unemployment rate both increasing is accounted for by the substantial 736,000 increase in the labor force.

Finally, as the first of the following figures shows, measured as the percentage change from the same month in the previous year, the increase in average hourly earnings (AHE) remained in its recent range of between 4.25 and 4.50 percent. That rate is down from its peak in mid-2022 but still above the rate of increase in 2019, before the pandemic. But, as the second figure shows, if we look at the compound rate of increase in AHE—that is the rate at which AHE would increase for the year if the current rate of monthly increase persisted over the following 11 months—we can see a significant cooling in the rate at which wages are increasing.

As a reminder, AHE are the wages and salaries per hour worked that private, nonfarm businesses pay workers. AHE don’t include the value of benefits that firms provide workers, such as contributions to 401(k) retirement accounts or health insurance. As an economy-wide average they suffer from a composition effect during periods in which employment either increases or decreases substantially because the mix of high-wage and low-wage workers may change. AHE are also subject to significant revisions. Therefore, short-range changes in AHE can sometimes be misleading indicators of the state of the labor market.

Data Indicate Continued Labor Market Easing

A job fair in Albuquerque, New Mexico earlier this year. (Photo from Zuma Press via the Wall Street Journal.)

In his speech at the Kansas City Fed’s Jackson Hole, Wyoming symposium, Fed Chair Jerome Powell noted that: “Getting inflation back down to 2 percent is expected to require a period of below-trend economic growth as well as some softening in labor market conditions.” To this point, there isn’t much indication that the U.S. economy is experiencing slower economic growth. The Atlanta Fed’s widely followed GDPNow forecast has real GDP increasing at a rapid 5.3 percent during the third quarter of 2023.

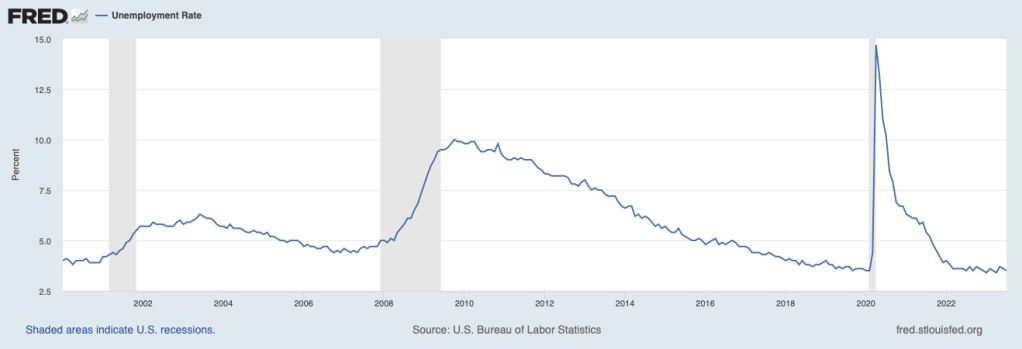
But the labor market does appear to be softening. The most familiar measure of the state of the labor market is the unemployment rate. As the following figure shows, the unemployment rate remains very low.

But, as we noted in this earlier post, an alternative way of gauging the strength of the labor market is to look at the ratio of the number of job openings to the number of unemployed workers. The Bureau of Labor Statistics (BLS) defines a job opening as a full-time or part-time job that a firm is advertising and that will start within 30 days. The higher the ratio of job openings to unemployed workers, the more difficulty firms have in filling jobs, and the tighter the labor market is. As indicated by the earlier quote from Powell, the Fed is concerned that in a very tight labor market, wages will increase more rapidly, which will likely lead firms to increase prices. The following figure shows that in July the ratio of job openings to unemployed workers has declined from the very high level of around 2.0 that was reached in several months between March 2022 and December 2022. The July 2023 value of 1.5, though, was still well above the level of 1.2 that prevailed from mid-2018 to February 2022, just before the beginning of the Covid–19 pandemic. These data indicate that labor market conditions continue to ease, although they remain tighter than they were just before the pandemic.

The following figure shows movements in the quit rate. The BLS calculates job quit rates by dividing the number of people quitting jobs by total employment. When the labor market is tight and competition among firms for workers is high, workers are more likely to quit to take another job that may be offering higher wages. The quit rate in July 2023 had fallen to 2.3 percent of total employment from a high of 3.0 percent, reached in both November 2021 and April 2022. The quit rate was back to its value just before the pandemic. The quit rate data are consistent with easing conditions in the labor market. (The data on job openings and quits are from the BLS report Job Openings and Labor Turnover—July 2023—the JOLTS report—released on August 29. The report can be found here.)

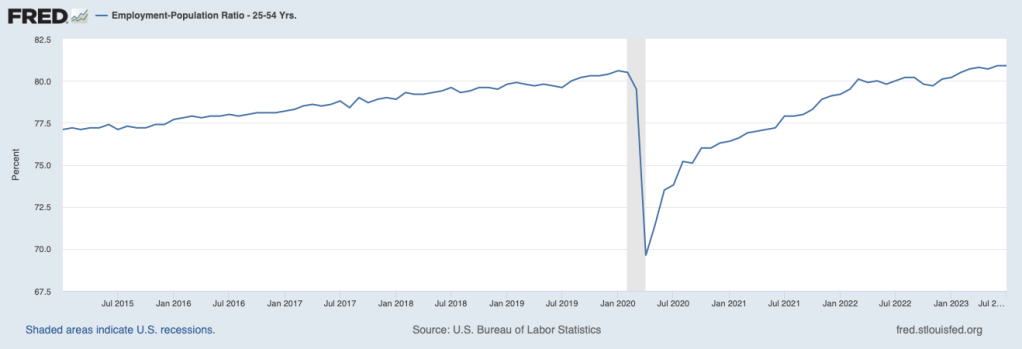
In his Jackson Hole speech, Powell noted that: “Labor supply has improved, driven by stronger participation among workers aged 25 to 54 and by an increase in immigration back toward pre-pandemic levels.” The following figure shows the employment-population ratio for people aged 25 to to 54—so-called prime-age workers. In July 2023, 80.9 percent of people in this age group were employed, actually above the ratio of 80.5 percent just before the pandemic. This increase in labor supply is another indication that the labor market disruptions caused by the pandemic has continued to ease, allowing for an increase in labor supply.

Taken together, these data indicate that labor market conditions are easing, likely reducing upward pressure on wages, and aiding the continuing decline in the inflation rate towards the Fed’s 2 percent target. Unless the data for August show an acceleration in inflation or a tightening of labor market conditions—which is certainly possible given what appears to be a strong expansion of real GDP during the third quarter—at its September meeting the Federal Open Market Committee is likely to keep its target for the federal funds rate unchanged.

Powell at Jackson Hole: No Change to Fed’s Inflation Target

Federal Reserve Chair Jerome Powell at Jackson Hole, Wyoming, August 2023 (Photo from the Associated Press.)

Congress has given the Federal Reserve a dual mandate to achieve price stability and high employment. To reach its goal of price stability, the Fed has set an inflation target of 2 percent, with inflation being measured by the percentage change in the personal consumption expenditures (PCE) price index.

It’s reasonable to ask whether “price stability” is achieved only when the price level is constant—that is, at a zero inflation rate. In practice, Congress has given the Fed wide latitude in deciding when price stability and high employment has been achieved.  The Fed didn’t announce a formal inflation target of 2 percent until 2012. But the members of the Federal Open Market Committee (FOMC) had agreed to set a 2 percent inflation target much earlier—in 1996—although they didn’t publicly announce it at the time. (The transcript of the FOMC’s July 2-3, 1996 meeting includes a discussion of the FOMC’s decision to adopt an inflation target.) Implicitly, the FOMC had been acting as if it had a 2 percent target since at least the mid–1980s.

But why did the Fed decide on an inflation target of 2 percent rather than 0 percent, 1 percent, 3 percent, or some other rate? There are three key reasons:

  1. As we discuss in Macroeconomics, Chapter 9, Section 9.4 (Economics, Chapter 19, Section 29.4 and Essentials of Economics, Chapter 13, Section 13.4), price indexes overstate the actual inflation rate by 0.5 percentage point to 1 percentage point. So, a measured inflation of 2 percent corresponds to an actual inflation rate of 1 to 1.5 percent.
  2. As we discuss in Macroeconomics, Chapter 15, Section 15.5 (Economics, Chapter 25, Section 25.5), the FOMC has a target for the long-run real federal funds rate. Although the target has been as high as 2 percent, in recent years it has been 0.5 percent.  With an inflation target of 2 percent, the long-run nominal federal funds rate target is 2.5 percent. (The FOMC’s long-run target federall funds target can be found in the Summary of Economic Projections here.) As the Fed notes, with an inflation target of less than 2 percent “there would be less room to cut interest rates to boost employment during an economic downturn.”
  3. An inflation target of less than 2 percent would make it more likely that during recessions, the U.S. economy might experience deflation, or a period during which the price level is falling.  Deflation can be damaging if falling prices cause consumers to postpone purchases in the hope of being able to buy goods and services at lower prices in the future. The resulting decline in aggregate demand can make a recession worse. In addition, deflation increases the real interest rate associated with a given nominal interest rate, imposing costs on borrowers, particularly if the deflation is unexpected.

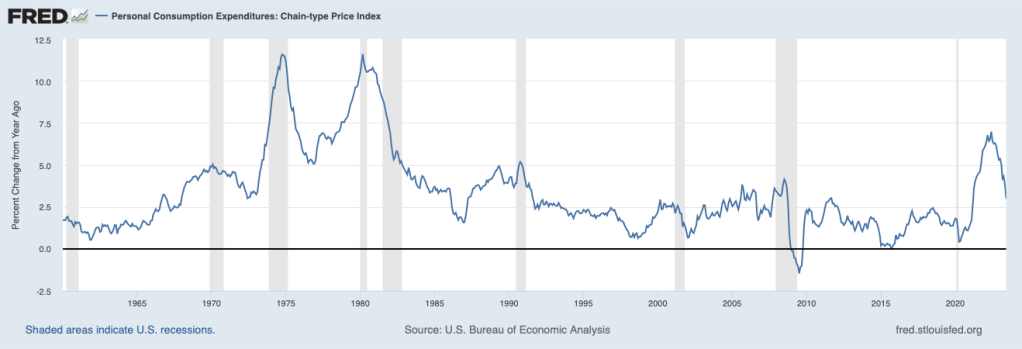
The following figure shows that for most of the period from late 2008 until the spring of 2021, the inflation rate as measured by the PCE was below the Fed’s 2 percent target. Beginning in the spring of 2021, inflation soared, reaching a peak of 7.0 percent in June 2022. Inflation declined over the following year, falling to 3.0 in June 2023. 

On August 25, at the Fed’s annual monetary policy symposium in Jackson Hole, Wyoming, Fed Chair Jerome Powell made clear that the Fed intended to continue a restrictive monetary policy until the inflation rate had returned to 2 percent: “It is the Fed’s job to bring inflation down to our 2 percent goal, and we will do so.” (The text of Powell’s speech can be found here.) Some economists have been arguing that once the Fed had succeeded in pushing the inflation rate back to 2 percent it should, in the future, consider raising its inflation target to 3 percent. At Jackson Hole, Powell appeared to rule out this possibility: “Two percent is and will remain our inflation target.”

Why might a 3 percent inflation target be preferrable to a 2 percent inflation target? Proponents of the change point to two key advantages:

  1. Reducing the likelihood of monetary policy being constrained by the zero lower bound. Because the federal funds rate can’t be negative, zero provides a lower bound on how much the FOMC can cut its federal funds rate target in a recession. Monetary policy was constrained by the zero lower bound during both the Great Recession of 2007–2009 and the Covid recession of 2020. Because an inflation target of 3 percent could likely be achieved with a federal funds rate that is higher than the FOMC’s current long-run target of 2.5 percent, the FOMC should have more room to cut its target during a recession.
  2. During a recession, firms attempting to reduce costs can do so by cutting workers’ nominal wages. But, as we discuss in Macroeconomics, Chapter 13, Section 13.2 (Economics, Chapter 23, Section 23.2 and Essentials of Economics, Chapter 15, Section 15.2), most workers dislike wage cuts. Some workers will quit rather than accept a wage cut and the productivity of workers who remain may decline. As a result, firms often use a policy of freezing wages rather than cutting them. Freezing nominal wages when inflation is occurring results in cuts to real wages.  The higher the inflation rate, the greater the decline in real wages and the more firms can reduce their labor costs without laying off workers.

Why would Powell rule out increasing the Fed’s target for the inflation rate? Although he didn’t spell out the reasons in his Jackson Hole speech, these are two main points usually raised by those who favor keeping the target at 2 percent:

  1. A target rate above 2 percent would be inconsistent with the price stability component of the Fed’s dual mandate. During the years between 2008 and 2021 when the inflation rate was usually at or below 2 percent, most consumers, workers, and firms found the inflation rate to be low enough that it could be safely ignored. A rate of 3 percent, though, causes money to lose its purchasing power more quickly and makes it less likely that people will ignore it. To reduce the effects of inflation people are likely to spend resources in ways such as firms reprinting menus or price lists more frequently or labor unions negotiating for higher wages in multiyear wage contracts. The resources devoted to avoiding the negative effects of inflation represent an efficiency loss to the economy.
  2. Raising the target for the inflation rate might undermine the Fed’s credibility in fighting inflation. One of the reasons that the Fed was able to bring down the inflation rate without causing a recession—at least through August 2023—was that the expectations of workers, firms, and investors remained firmly anchored. That is, there was a general expectation that the Fed would ultimately succeed in bringing the inflation back down to 2 percent. If expectations of inflation become unanchored, fighting inflation becomes harder because workers, firms, and investors are more likely to take actions that contribute to inflation. For instance, lenders won’t assume that inflation will be 2 percent in the future and so will require higher nominal interest rates on loans. Workers will press for higher nominal wages to protect themselves from the effects of higher inflation, thereby raising firms’ costs. Raising its inflation target to 3 percent may also cause workers, firms, and investors to question whether during a future period of high inflation the Fed will raise its target to an even higher rate. If that happens, inflation may be more persistent than it was during 2022 and 2023.

It seems unlikely that the Fed will raise its target for the inflation rate in the near future. But the Fed is scheduled to review its current monetary policy strategy in 2025. It’s possible that as part of that review, the Fed may revisit the issue of its inflation target.  

Is the U.S. Economy Coming in for a Soft Landing?

The Federal Reserve building in Washington, DC. (Photo from Bloomberg News via the Wall Street Journal.)

The key macroeconomic question of the past two years is whether the Federal Reserve could bring down the high inflation rate without triggering a recession. In this blog post from back in February, we described the three likely macroeconomic outcomes as:

  1. A soft landing—inflation returns to the Fed’s 2 percent target without a recession occurring.
  2. A hard landing—inflation returns to the Fed’s 2 percent target with a recession occurring.
  3. No landing—inflation remains above the Fed’s 2 percent target but no recession occurs.

The following figure shows inflation measured as the percentage change in the personal consumption expenditures (PCE) price index and in the core PCE, which excludes food and energy prices. Recall that the Fed uses inflation as measured by the PCE to determine whether it is hitting its inflation target of 2 percent. Because food and energy prices tend to be volatile, many economists inside and outside of the Fed use the core PCE to better judge the underlying rate of inflation—in other words, the inflation rate likely to persist in at least the near future.

The figure shows that inflation first began to rise above the Fed’s target in March 2021. Most members of the Federal Open Market Committee (FOMC) believed that the inflation was caused by temporary disruptions to supply chains caused by the effects of the Covid–19 pandemic. Accordingly, the FOMC didn’t raise its target for the federal funds from 0 to 0.25 percent until March 2022. Since March 2022, the FOMC has raised its target for the federal funds rate in a series of steps until the target range reached 5.25 to 5.50 percent following the FOMC’s July 26, 2023 meeting.

PCE inflation peaked at 7.0 percent in June 2022 and had fallen to 2.9 percent in June 2023. Core PCE had a lower and earlier peak of 5.4 percent in February 2023, but had experienced a smaller decline—to 4.1 percent in June 2023. Inflation as measured by the consumer price index (CPI) followed a similar pattern, as shown in the following figure. Inflation measured by core CPI reached a lower peak than did inflation measured by the CPI and declined by less through June 2023.

As inflation has been falling since mid-2022, , the unemployment rate has remained low and the employment-population ratio for prime-age workers (workers aged 25 to 54) has risen above its 2019 pre-pandemic peak, as the following two figures show.

So, the Fed seems to be well on its way to achieving a soft landing. But in the press conference following the July 26 FOMC meeting Chair Jerome Powell was cautious in summarizing the inflation situation:

“Inflation has moderated somewhat since the middle of last year. Nonetheless, the process of getting inflation back down to 2 percent has a long way to go. Despite elevated inflation, longer-term inflation expectations appear to remain well anchored, as reflected in a broad range of surveys of households, businesses, and forecasters, as well as measures from financial markets.”

By “longer-term expectations appear to remain well anchored,” Powell was referring to the fact that households, firms, and investors appear to be expecting that the inflation rate will decline over the following year to the Fed’s 2 percent target.

Those economists who still believe that there is a good chance of a recession occuring during the next year have tended to focus on the following three points:

1. As shown in the following two figures, the labor market remains tight, with wage increases remaining high—although slowing in recent months—and the ratio of job openings to the number of unemployed workers remaining at historic levels—although that ratio has also been declining in recent months. If the labor market remains very tight, wages may continue to rise at a rate that isn’t consistent with 2 percent inflation. In that case, the FOMC may have to persist in raising its target for the federal funds rate, increasing the chances for a recession.

2. The lagged effect of the Fed’s contractionary monetary policy over the past year—increases in the target for the federal funds rate and quantitative tightening (allowing the Fed’s holdings of Treasury securites and mortgage-backed securities to decline; a process of quantitative tightening (QT))—may have a significant negative effect on the growth of aggegate demand in the coming months. Economists disagree on the extent to which monetary policy has lagged effects on the economy. Some economists believe that lags in policy have been significantly reduced in recent years, while other economists believe the lags are still substantial. The lagged effects of monetary policy, if sufficiently large, may be enough to push the economy into a recession.

3. The economies of key trading partners, including the European Union, the United Kingdom, China, and Japan are either growing more slowly than in the previous year or are in recession. The result could be a decline in net exports, which have been contributing to the growth of aggregate demand since early 2021.

In summary, we can say that in early August 2023, the probability of the Fed bringing off a soft landing has increased compared with the situation in mid-2022 or even at the beginning of 2023. But problems can still arise before the plane is safely on the ground.