Shrinkflation in the Comic Book Industry

Action Comics No. 1, published in June 1938, is often consider the first superhero comic book. (Image from comics.org.)

In a political advertisement that ran before the broadcast of the Super Bowl, President Joe Biden discussed shrinkflation, which refers to firms reducing the quantity of a product in container while keeping the price unchanged. In this post from the summer of 2022, we discussed examples of shrinkflation—including Chobani reducing the quantity of yogurt in the package shown here from 5.3 ounces to 4.5 ounces—and noted that shrinkflation complicates the job of the Bureau of Labor Statistics when compiling the consumer price index. 

This yogurt remained the same price although the quantity of yogurt in the container shrank from 5.3 ounces to 4.5 ounces.

Shrinkflation isn’t new; firms have used the strategy for decades. Firms are particularly likely to use shrinkflation during periods of high inflation or during periods when the federal government implements price controls.  Firms also sometimes resort to shrinkflation when the the price of a product has remained constant for long enough that the firms fear that consumers will react strongly to the firms increasing the price.

Comic books provide an interesting historical example of shrinkflation. David Palmer, a professor of management at South Dakota State University published an article in 2010 in which he presented data on the price and number of pages in copies of Action Comics from 1938 to 2010. When DC Comics introduced Superman in the first issue of Action Comics in June 1938, it started the superhero genre of comic books. Action Comics No. 1 had a price of $0.10 and was 64 pages.

After the United States entered World War II in December 1941, the federal government imposed price controls to try to limit the inflation caused by the surge in spending to fight the war. Rising costs of producing comic books, combined with the difficulty in raising prices because of the controls, led comic book publishers to engage in shrinkflation. In 1943, the publishers reduced the number of pages in their comics from 64 to 56. In 1944, the publishers engaged in further shrinkflation, reducing the number of pages from 56 to 48.

In 1951, during the Korean War, the federal government again imposed price controls. Comic book publishers responded with further shrinkflation, keeping the price at $0.10, while reducing the number of pages from 48 to 40. In 1954, they shrank the number of pages to 36, which remains the most common number of pages in a comic book today. At that time, the publishers also slightly reduced the width of comics from 7 3/4 inches to 7 1/8 inches. (Today the typical comic book has a width of 6 7/8 inches.)

By the late 1950s, comic book publishers became convinced that they would be better off raising the prices of comic books rather than further shrinking the number of pages. But they were reluctant to raise their prices because they had been a constant $0.10 for more than 20 years, so children and their parents might react very negatively to a price increase, and because no firm wanted to be the first to raise its price for fear of losing sales to its competitors. They were caught in a prisoner’s dilemma: Comic book publishers would all have been better off if they had raised their prices but the antitrust laws kept them from colluding to raise prices and no individual firm had an incentive to raise prices alone. (We discuss collusion, prisoner’s dilemmas, and other aspects of oligopolistic firm behaviour in Chapter 14 of Microeconomics and Economics.)

The most successful publisher in the 1950s was Dell, which sold very popular comic books featuring Donald Duck, Uncle Scrooge, and other characters that particularly appealed to younger children. Because the prices of Dell’s comic books, like those of other publishers, been unchanged at $0.10 since the late 1930s, the firm didn’t have a clear idea of the price elasticity of demand for its comics. In 1957, the firm’s managers decided to use a market experiment to gather data on the price elasticity of demand. In most cities, Dell kept the price of its comics at $0.10, but in some cities it sold the identical comics at a price of $0.15.

The experiment lasted from March 1957 to August 1958 when the company discontinued it by reverting to selling all of its comics for $0.10. Although we lack the data necessary to compare the sales of Dell comics with a $0.15 price to the sales of Dell comics with a $0.10 price, the fact that no other publisher raised its prices during that period and that Dell abandoned the experiment indicates that the demand curve for Dell’s comics was price elastic—the percentage decline in the quantity sold was greater than the 50 percent increase in price—so Dell’s revenue from sales in the cities selling comics with a price of $0.15 likely declined. Dell’s strategy can be seen as a failed example of price leadership. (We discuss the relationship between the price elasticity of demand for a good and the total revenue a firm earns from selling the good in Chapter 6, Section 6.3 of Microeconomics and Economics. We discuss price leadership in Microeconomic and Economics, Chapter 14, Section 14.2.)

In March 1961, Dell increased the price of all of its comics from $0.10 to $0.15. At first, Dell’s competitors kept the prices of their comics at $0.10. As a result, in September 1961, Dell cut the price of its comics from $0.15 to $0.12. By early 1962, Dell’s competitors, including DC Comics, Marvel Comics—publishers of Spider-Man and the Fantastic Four—along with several smaller publishers, had increased the prices of their comics from $0.10 to $0.12. The managers at DC decided that raising the price of comics after having kept it constant for so long required an explantion. Accordingly, they printed the following letter in each of their comics.
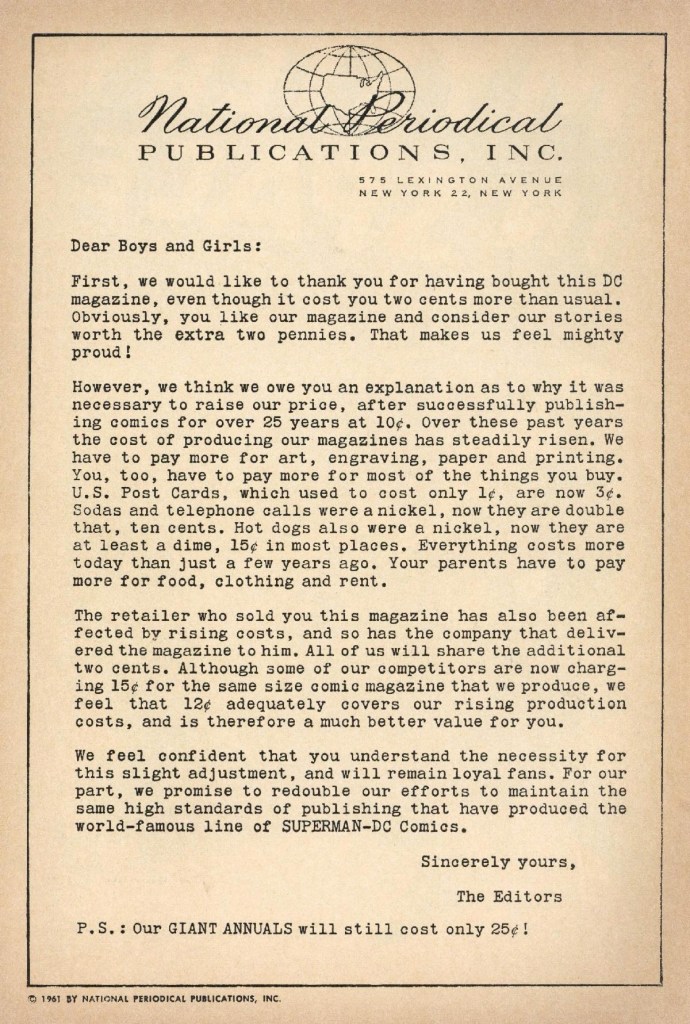
H/T to Buddy Saunders for the image.

Comic book publishers have raised their prices many times since the early 1960s, with most comics currently having a price of $4.99. During the recent period of high inflation, comic publishers did not use a strategy of shrinkflation perhaps because they believe that 36 pages is the minimum number that buyers will accept.

The first 25 years of the comic book industry represents an interesting historical example of shrinkflation.

Surprisingly Strong CPI Report

Photo courtesy of Lena Buonanno.

As we’ve discussed in several blog posts (for instance, here and here), recent macro data have been consistent with the Federal Reserve being close to achieving a soft landing. The Fed’s increases in its target for the federal funds rate have slowed the growth of aggregate demand sufficiently to bring inflation closer to the Fed’s 2 percent target, but haven’t, to this point, slowed the growth of aggregate demand so much that the U.S. economy has been pushed into a recession.

By January 2024, many investors in financial markets and some economists were expecting that at its meeting on March 19-20, the Fed’s Federal Open Market Committee would be cutting its target for the federal funds. However, members of the committee—notably, Chair Jerome Powell—have been cautious about assuming prematurely that inflation had, in fact, been brought under control. In fact, in his press conference on January 31, following the committee’s most recent meeting, Powell made clear that the committee was unlikely to reduce its target for the federal funds rate at its March meeting. Powell noted that “inflation is still too high, ongoing progress in bringing it down is not assured, and the path forward is uncertain.”

Powell’s caution seemed justified when, on February 2, the Bureau of Labor Statistics (BLS) released its most recent “Employment Situation Report” (discussed in this post). The report’s data on growth in employment and growth in wages, as measured by the change in average hourly earnings, might be indicating that aggregate demand is growing too rapidly for inflation to continue to decline.

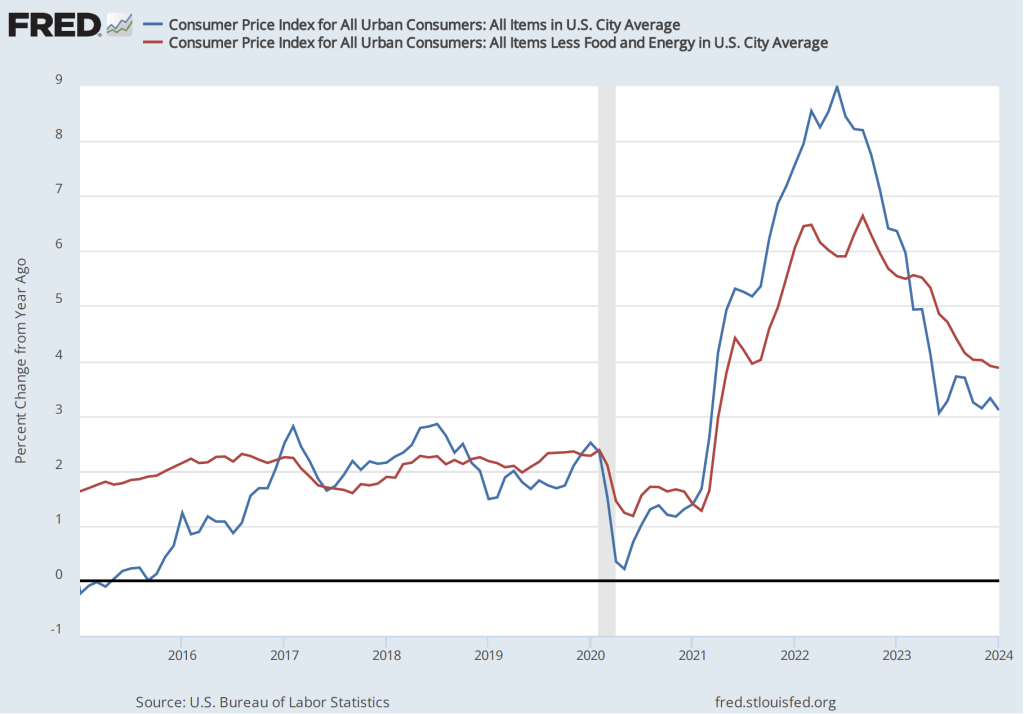
The BLS’s release today (February 13) of its report on the consumer price index (CPI) (found here) for January provided additional evidence that the Fed may not yet have put inflation on a firm path back to its 2 percent target. The average forecast of economists surveyed before the release of the report was that the increase in the version of the CPI that includes the prices of all goods and services in the market basket—often called headline inflation—would be 2.9 percent. (We discuss how the BLS constructs the CPI in Macroeconomics, Chapter 9, Section 19.4, Economics, Chapter 19, Section 19.4, and Essentials of Economics, Chapter 3, Section 13.4.) As the following figure shows, headline inflation for January was higher than expected at 3.1 percent (measured by the percentage change from the same month in the previous year), while core inflation—which excludes the prices of food and energy—was 3.9 percent. Headline inflation was lower than in December 2023, while core inflation was almost unchanged.

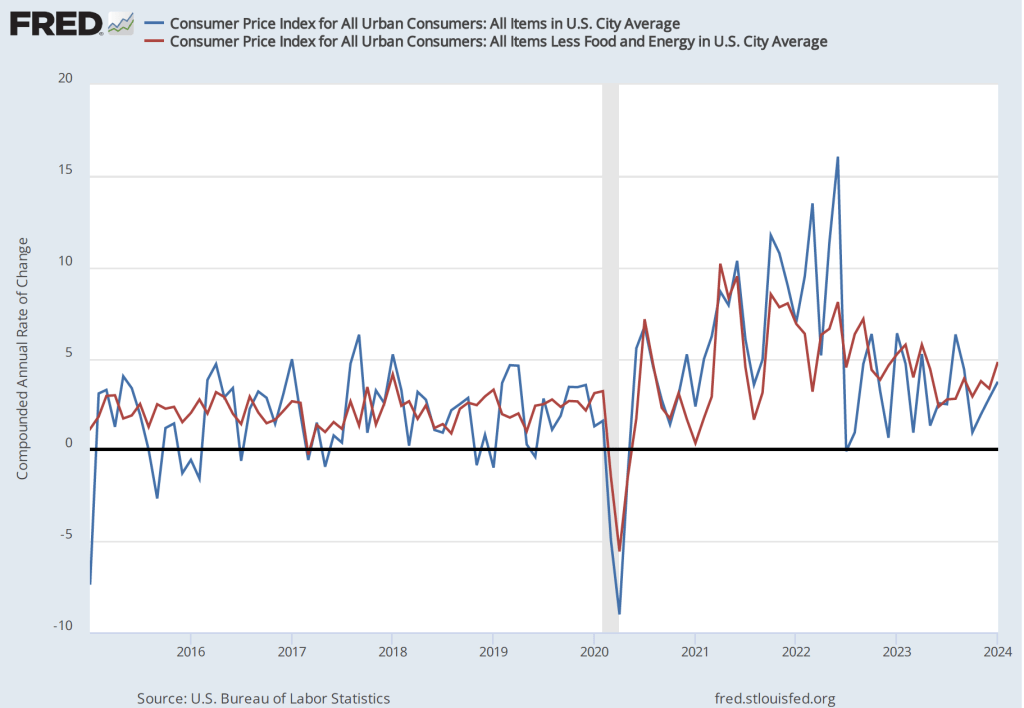
Although the values for January might seem consistent with a gradual decline in inflation, that conclusion may be misleading. Headline inflation in January 2023 had been surprisingly high at 6.4 percent. Hence, the comparision between the value of the CPI in January 2024 with the value in January 2023 may be making the annual CPI inflation rate seem artificially low. If we look at the 1-month inflation rate for headline and core inflation—that is the annual inflation rate calculated by compounding the current month’s rate over an entire year—the values are more concerning, as indicated in the following figure. Headline CPI inflation is 3.7 percent and core CPI inflation is 4.8 percent.

Even more concerning is the path of inflation in the prices of services. Chair Powell has emphasized that as supply chain problems have gradually been resolved, inflation in the prices of goods has been rapidly declining. But inflaion in services hasn’t declined nearly as much. Last summer he stated the point this way:

“Part of the reason for the modest decline of nonhousing services inflation so far is that many of these services were less affected by global supply chain bottlenecks and are generally thought to be less interest sensitive than other sectors such as housing or durable goods. Production of these services is also relatively labor intensive, and the labor market remains tight. Given the size of this sector, some further progress here will be essential to restoring price stability.”

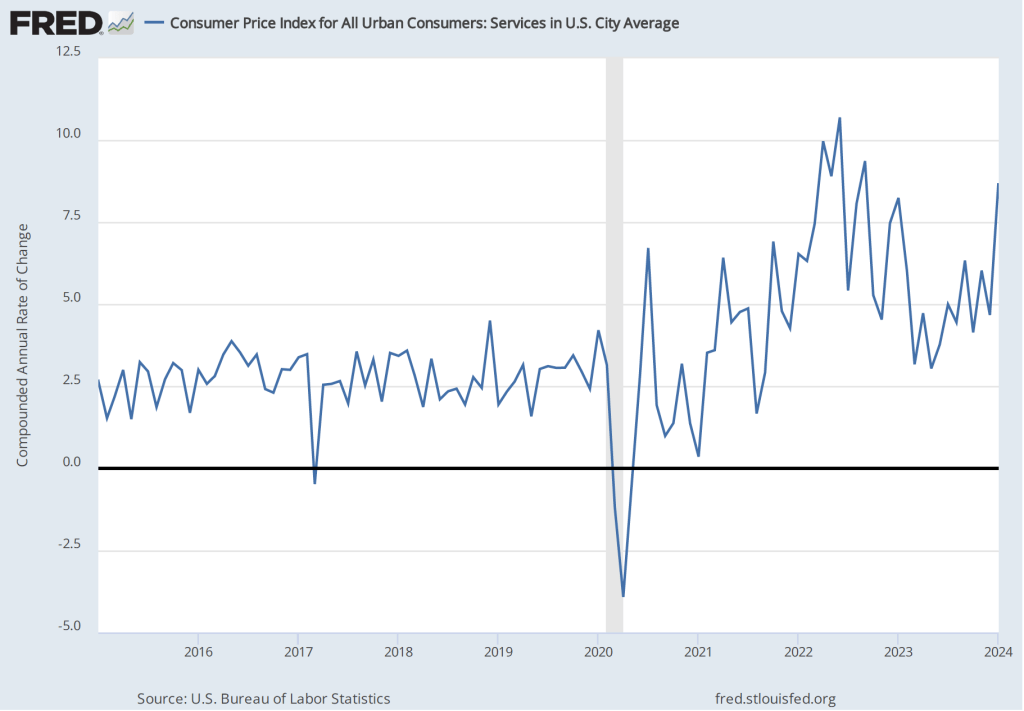
The following figure shows the 1-month inflation rate in services prices. The figure shows that inflation in services has been above 4 percent in every month since July 2023. Inflation in services was a very high 8.7 percent in January. Clearly such large increases in the prices of services aren’t consistent with the Fed meeting its 2 percent inflation target.

How should we interpret the latest CPI report? First, it’s worth bearing in mind that a single month’s report shouldn’t be relied on too heavily. There can be a lot of volatility in the data month-to-month. For instance, inflation in the prices of services jumped from 4.7 percent in December to 8.7 percent in January. It seems unlikely that inflation in the prices of services will continue to be over 8 percent.

Second, housing prices are a large component of service prices and housing prices can be difficult to measure accurately. Notably, the BLS includes in its measure the implicit rental price that someone who owns his or her own home pays. The BLS calculates that implict rental price by asking consumers who own their own homes the following question: “If someone were to rent your home today, how much do you think it would rent for monthly, unfurnished and without utilities?” (The BLS discusses how it measures the price of housing services here.) In practice, it may be difficult for consumers to accurately answer the question if very few houses similar to theirs are currently for rent in their neighborhood.

Third, the Fed uses the personal consumption expenditures (PCE) price index, not the CPI, to gauge whether it is achieving its 2 percent inflation target. The Bureau of Economic Analysis (BEA) includes the prices of more goods and services in the PCE than the BLS includes in the CPI and measures housing services using a different approach than that used by the BLS. Although inflation as measured by changes in the CPI and as measured by changes in the PCE move roughly together over long periods, the two measures can differ significantly over a period of a few months. The difference between the two inflation measures is another reason not to rely too heavily on a single month’s CPI data.

Despite these points, investors on Wall Street clearly interpreted the CPI report as bad news. Investors have been expecting that the Fed will soon cut its target for the federal funds rate, which should lead to declines in other key interest rates. If inflation continues to run well above the Fed’s 2 percent target, it seems likely that the Fed will keep its federal funds target at its current level for longer, thereby slowing the growth of aggregate demand and raising the risk of a recession later this year. Accordingly, the Dow Jones Industrial Average declined by more than 500 points today (February 13) and the interest rate on the 10-year Treasury note rose above 4.3 percent.

The FOMC has more than a month before its next meeting to consider the implications of the latest CPI report and the additional macro data that will be released in the meantime.

Surprisingly Strong Jobs Report

Photo courtesy of Lena Buonanno.

This morning of Friday, February 2, the Bureau of Labor Statistics (BLS) issued its “Employment Situation Report” for January 2024.  Economists and policymakers—notably including the members of the Fed’s Federal Open Market Committee (FOMC)—typically focus on the change in total nonfarm payroll employment as recorded in the establishment, or payroll, survey. That number gives what is generally considered to be the best gauge of the current state of the labor market.

Economists surveyed in the past few days by business news outlets had expected that growth in payroll employment would slow to an increase of between 180,000 and 190,000 from the increase in December, which the BLS had an initially estimated as 216,00. (For examples of employment forecasts, see here and here.) Instead, the report indicated that net employment had increased by 353,000—nearly twice the expected amount. (The full report can be found here.)

In this previous blog post on the December employment report, we noted that although the net increase in employment in that month was still well above the increase of 70,000 to 100,000 new jobs needed to keep up with population growth, employment increases had slowed significantly in the second half of 2023 when compared with the first.

That slowing trend in employment growth did not persist in the latest monthly report. In addition, to the strong January increase of 353,000 jobs, the November 2023 estimate was revised upward from 173,000 jobs to 182,000 jobs, and the December estimate was substantially revised from 216,000 to 333,000. As the following figure from the report shows, the net increase in jobs now appears to have trended upward during the last three months of 2023.

Economists surveyed were also expecting that the unemployment rate—calculated by the BLS from data gathered in the household survey—would increase slightly to 3.8 percent. Instead, it remained constant at 3.7 percent. As the following figure shows, the unemployment rate has been remarkably stable for more than two years and has been below 4.0 percent each month since December 2021. The members of the FOMC expect that the unemployment rate during 2024 will be 4.1 percent, a forcast that will be correct only if the demand for labor declines significantly over the rest of the year.

The “Employment Situation Report” also presents data on wages, as measured by average hourly earnings. The growth rate of average hourly earnings, measured as the percentage change from the same month in the previous year, had been slowly declining from March 2022 to October 2023, but has trended upward during the past few months. The growth of average hourly earnings in January 2024 was 4.5 percent, which represents a rise in firms’ labor costs that is likely too high to be consistent with the Fed succeeding in hitting its goal of 2 percent inflation. (Keep in mind, though, as we note in this blog post, changes in average hourly earnings have shortcomings as a measure of changes in the costs of labor to businesses.)

Taken together, the data in today’s “Employment Situation Report” indicate that the U.S. labor market remains very strong. One implication is that the FOMC will almost certainly not cut its target for the federal funds rate at its next meeting on March 19-20. As Fed Chair Jerome Powell noted in a statement to reporters after the FOMC earlier this week: “The Committee does not expect it will be appropriate to reduce the target range until it has gained greater confidence that inflation is moving sustainably toward 2 percent. We will continue to make our decisions meeting by meeting.” (A transcript of Powell’s press conference can be found here.) Today’s employment report indicates that conditions in the labor market may not be consistent with a further decline in price inflation.

It’s worth keeping several things in mind when interpreting today’s report.

  1. The payroll employment data and the data on average hourly earnings are subject to substantial revisions. This fact was shown in today’s report by the large upward revision in net employment creation in December, as noted earlier in this post.
  2. A related point: The data reported in this post are all seasonally adjusted, which means that the BLS has revised the raw (non-seasonally adjusted) data to take into account normal fluctuations due to seasonal factors. In particular, employment typically increases substantially during November and December in advance of the holiday season and then declines in January. The BLS attempts to take into account this pattern so that it reports data that show changes in employment during these months holding constant the normal seasonal changes. So, for instance, the raw (non-seasonally adjusted) data show a decrease in payroll employment during January of 2,635,000 as opposed to the seasonally adjusted increase of 353,000. Over time, the BLS revises these seasonal adjustment factors, thereby also revising the seasonally adjusted data. In other words, the BLS’s initial estimates of changes in payroll employment for these months at the end of one year and the beginning of the next should be treated with particular caution.
  3. The establishment survey data on average weekly hours worked show a slow decline since November 2023. Typically, a decline in hours worked is an indication of a weakening labor market rather than the strong labor market indicated by the increase in employment. But as the following figure shows, the data on average weekly hours are noisy in that the fluctuations are relatively large, as are the revisons the BLS makes to these data over time.

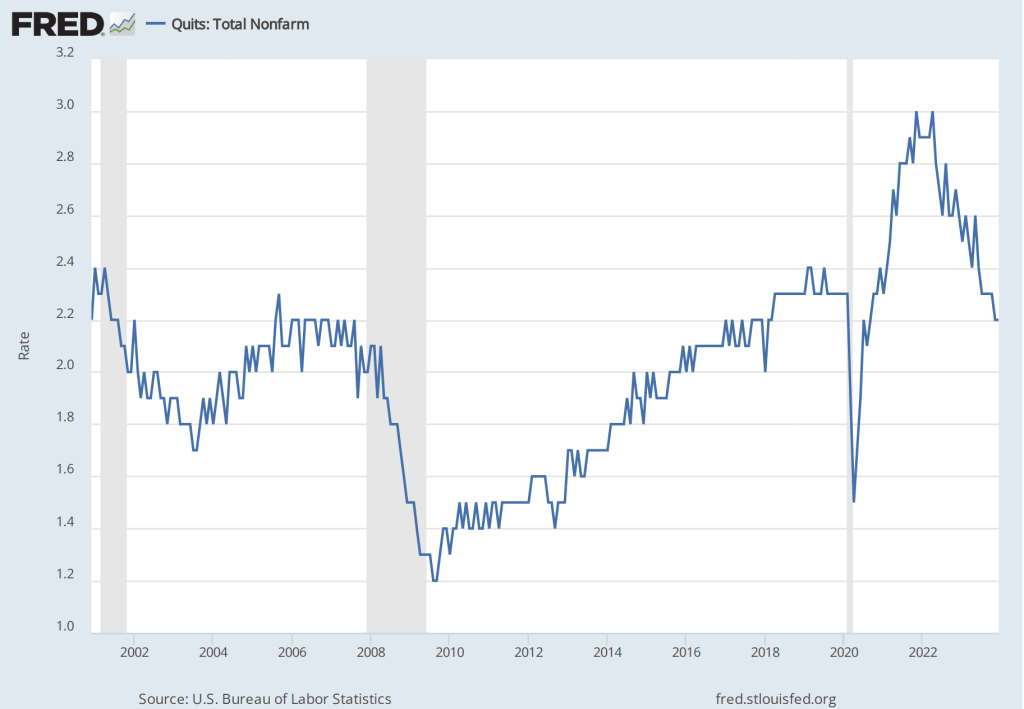
4. In contrast to today’s jobs report, other labor market data seem to indicate that the demand for labor is slowing. For instance, quit rates—or the number of people voluntarily leaving their jobs as a percentage of the total number of people employed—have been declining. As shown in the following figure, the quit rate peaked at 3.0 percent in November 2021 and March 2022, and has declined to 2.2 percent in December 2023—a rate lower than just before the beginning of the Covid–19 pandemic.

Similarly, as the following figure shows, the number of job openings per unemployed person has declined from a high of 2.0 in March 2022 to 1.4 in December 2023. This value is still somewhat higher than just before the beginning of the Covid–19 pandemic.

To summarize, recent data on conditions in the labor market have been somewhat mixed. The strong increases in net employment and in average hourly earnings in recent months are in contrast with declining average number of hours worked, a declining quit rate, and a falling number of job openings per unemployed person. Taken together, these data make it likely that the FOMC will be in no hurry to cut its target for the federal funds rate. As a result, long-term interest rates are also likely to remain high in the coming months. The following figure from the Wall Street Journal provides a striking illustration of the effect of today’s jobs report on the bond market, as the interest rate on the 10-year Treasury note rose above 4.0 percent for the first time in more than a month. The interest rate on the 10-year Treasury note plays an important role in the financial system, influencing interest rates on mortgages and corporate bonds. 

FOMC Meeting: Steady as She Goes

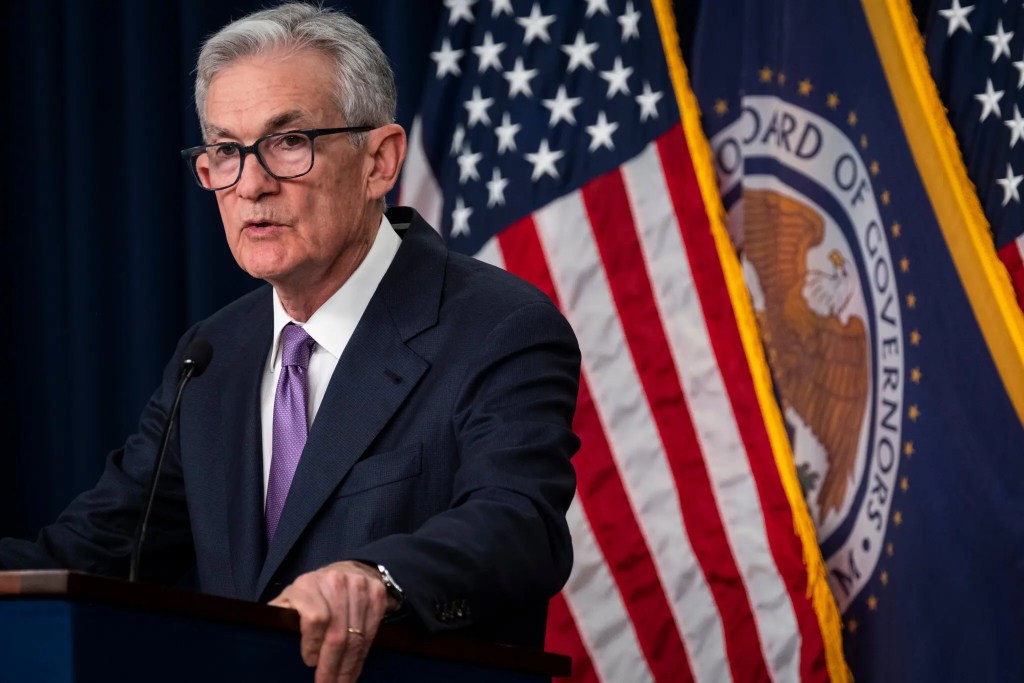
Federal Reserve Chair Jerome Powell (Photo from the New York Times.)

This afternoon, Wednesday, January 31, the Federal Reserve’s Federal Open Market Committee (FOMC) held the first of its eight scheduled meetings during 2024. As we noted in a recent post, macroeconomic data have been indicating that the Fed is close to achieving its goal of bringing the U.S. economy in for a soft landing—reducing inflation down to the Fed’s 2 percent target without pushing the economy into a recession. But as we also noted in that post, it was unlikely that at this meeting Fed Chair Jerome Powell and the other members of the FOMC would declare victory in their fight to reduce inflation from the high levels it reached during 2022.

In fact, in Powell’s press conference following the meeting, when asked directly by a reporter whether he believed that the economy had made a safe landing, Powell said that he wasn’t yet willing to draw that conclusion. Accordingly, the committee kept its target range for the federal funds rate unchanged at 5.25 percent to 5.50 percent. This was the fifth meeting in a row at which the FOMC had left the target unchanged. Although some policy analysts expect that the FOMC might reduce its federal funds rate target at its next meeting in March, the committee’s policy statement made that seem unlikely:

“In considering any adjustments to the target range for the federal funds rate, the Committee will carefully assess incoming data, the evolving outlook, and the balance of risks. The Committee does not expect it will be appropriate to reduce the target range until it has gained greater confidence that inflation is moving sustainably toward 2 percent.”

Powell reinforced the point during his press conference by stating it was unlikely that the committee would cut the target rate at the next meeting. He noted that:

“The economy has surprised forecasters in many ways since the pandemic, and ongoing progress toward our 2 percent inflation objective is not assured. The economic outlook is uncertain, and we remain highly attentive to inflation risks. We are prepared to maintain the current target range for the federal funds rate for longer, if appropriate.”

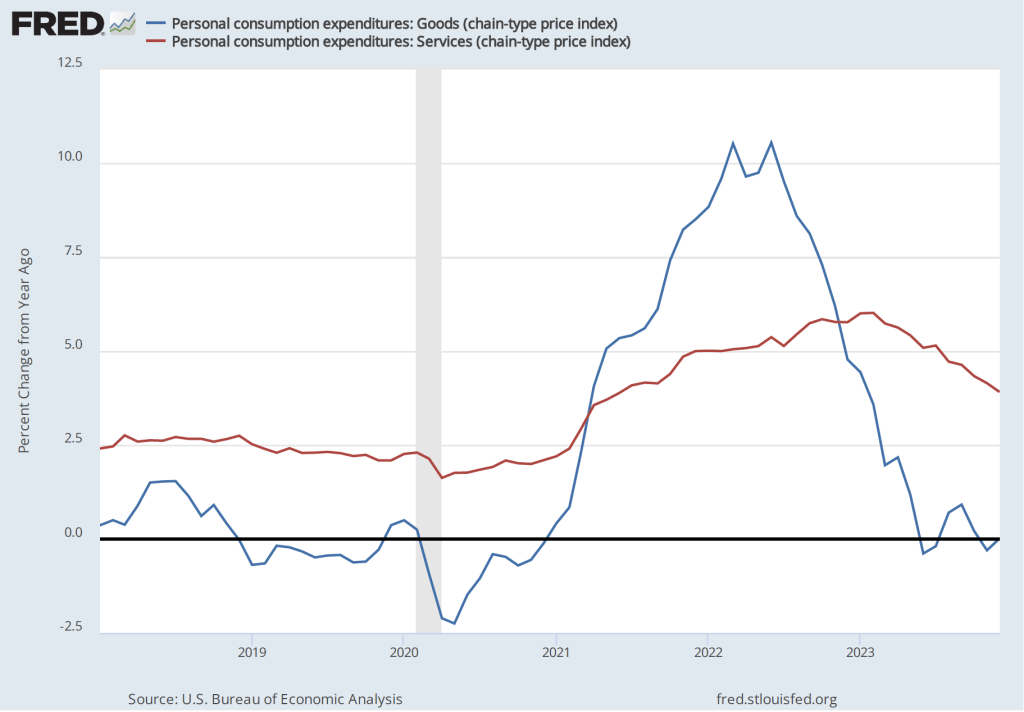
Powell highlighted a couple of areas of potential concern. The Fed gauges its progress towards achieving its 2 percent inflation goal using the percentage change in the personal consumption expenditures (PCE) price index. As we noted in a recent post, PCE inflation has declined from a high of 7.1 percent in June 2022 to 2.9 percent in December 2023. But Powell noted that PCE inflation in goods has followed a different path from PCE inflation in services, as the following figure shows.

Inflation during 2022 was much greater in the prices of goods than in the prices of services, reflecting the fact that supply chain disruptions caused by the pandemic had a greater effect on goods than on services. Inflation in goods has been less than 1 percent every month since June 2023 and has been negative in three of those months. Inflation in services peaked in February 2023 at 6.0 percent and has been declining since, but was still 3.9 percent in December. Powell noted that the very low rates of inflation in the prices of goods probably aren’t sustainable. If inflation in the prices of goods increases, the Fed may have difficulty achieving its 2 percent inflation target unless inflation in the prices of services slows.

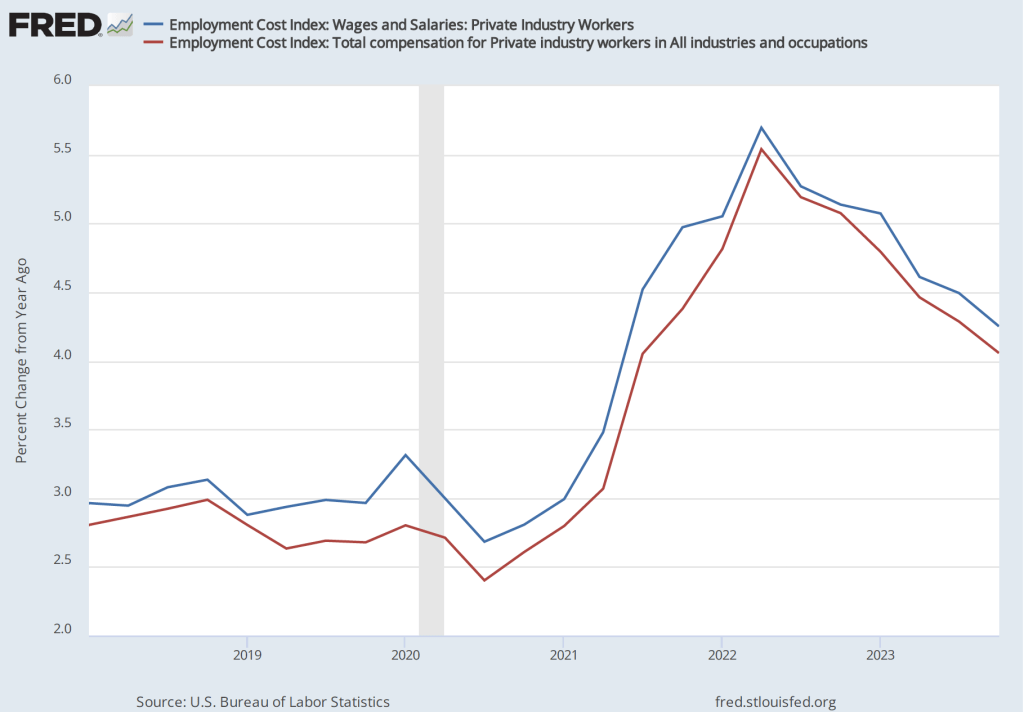
Powell also noted that the most recent data on the employment cost index (ECI) had been released the morning of the meeting. The ECI is compiled by the Bureau of Labor Statistics and is published quarterly. It measures the cost to employers per employee hour worked. The BLS publishes data that includes only wages and salaries and data that includes, in addition to wages and salaries, non-wage benefits—such as contributions to retirement accounts or health insurance—that firms pay workers. The figure below shows the percentage change from the same month in the previous year for the ECI including just wages and salaries (blue line) and for the ECI including all compensation (red line). Although ECI inflation has declined significantly from its peak in he second quarter of 2022, in the fourth quarter of 2023, both measures of ECI inflation were above 4 percent. Wages increasing at that pace may not be consistent with a 2 percent rate of price inflation.
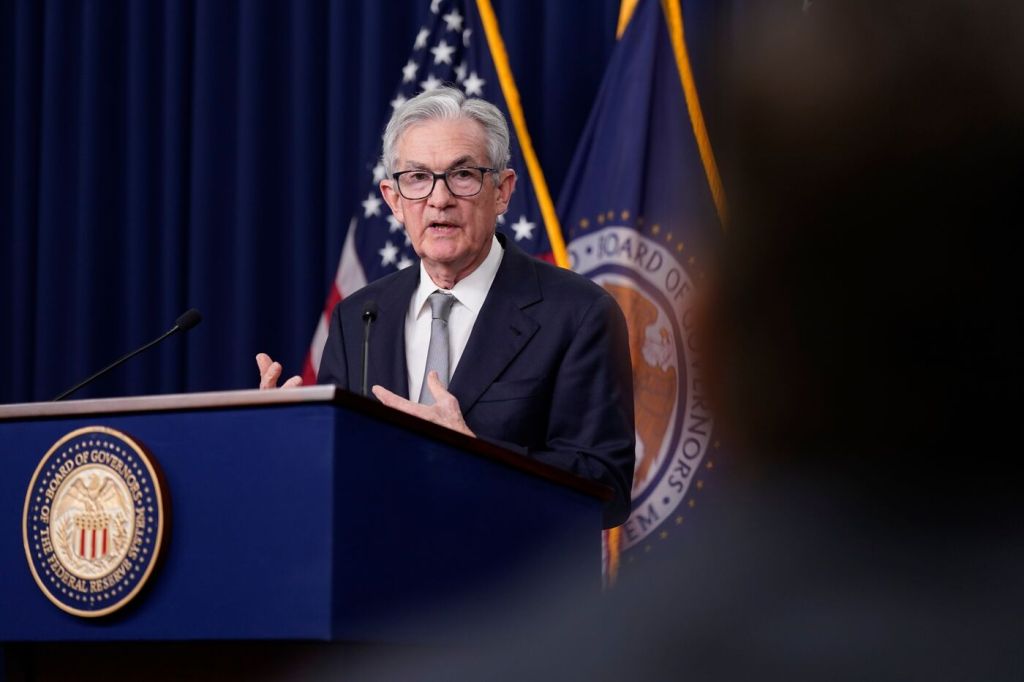
Powell’s tone at his news conference (which can be watched here) was one of cautious optimism. He and the other committee members expect to be able to cut the target for the federal funds rate later this year but remain on guard for any indications that the inflation rate is increasing again.

Has the Federal Reserve Achieved a Soft Landing?

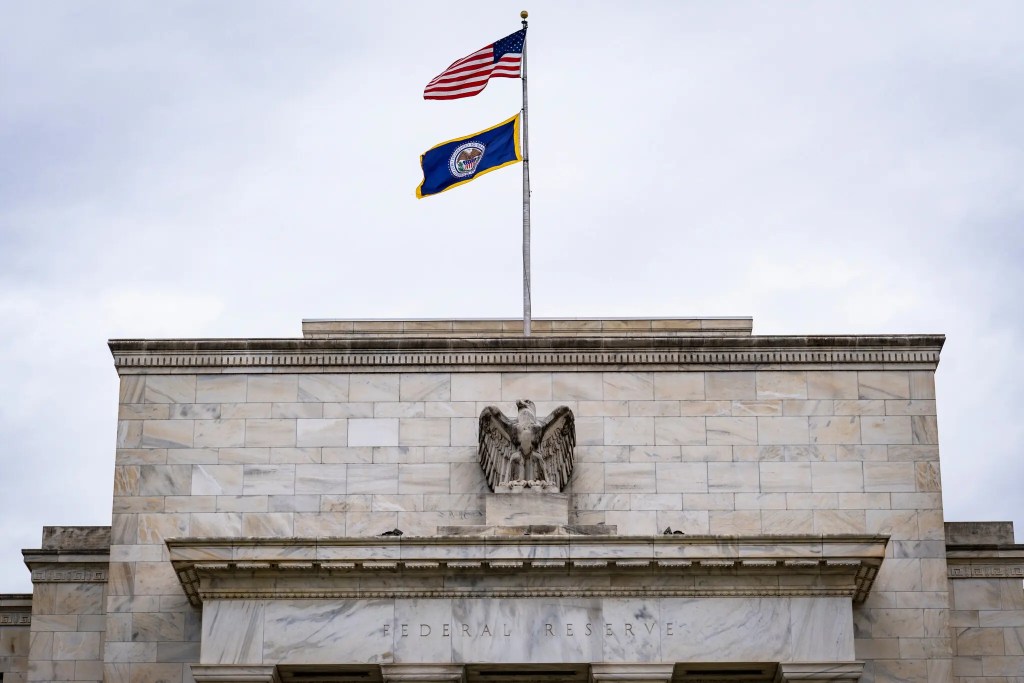
The Federal Reserve building in Washington, DC. (Photo from the New York Times.)

Since inflation began to increase rapidly in the late spring of 2021, the key macroeconomic question has been whether the Fed would be able to achieve a soft landing—pushing inflation back to its 2 percent target without causing a recession. The majority of the members of the Fed’s Federal Open Market Committee (FOMC) believed that increases in inflation during 2021 were largely caused by problems with supply chains resulting from the effects of the Covid–19 pandemic. 

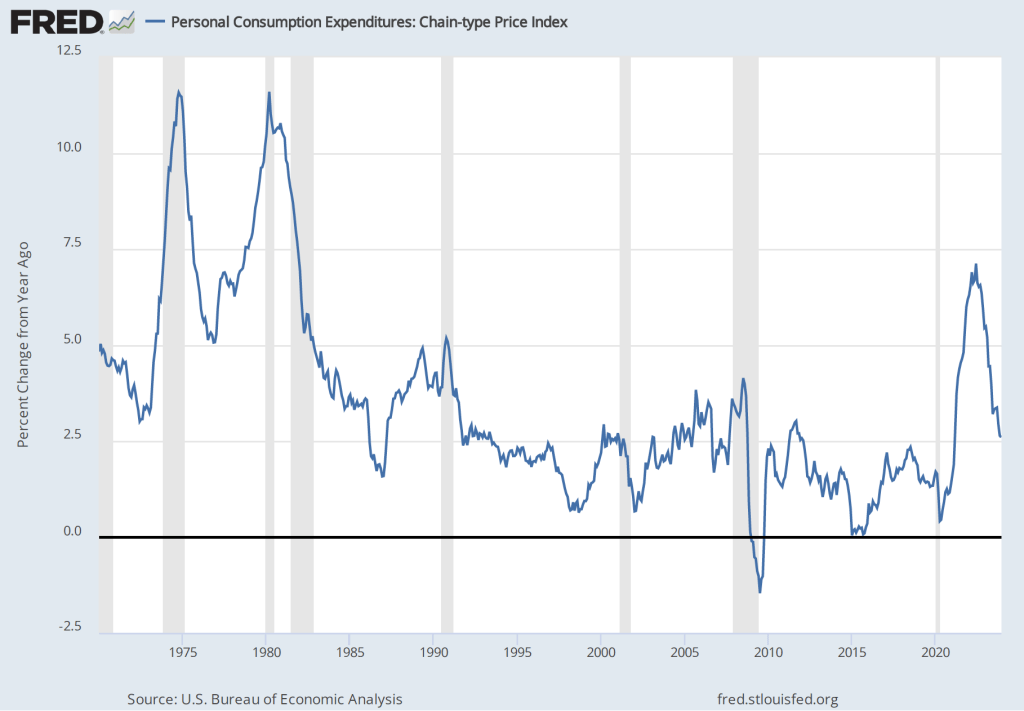
These committee members believed that once supply chains returned to normal, the increase in he inflation rate would prove to have been transitory—meaning that the inflation rate would decline without the need for the FOMC to pursue a contractionary monetary by substantially raising its target range for the federal funds rate. Accordingly, the FOMC left its target range unchanged at 0 to 0.25 percent until March 2022. As the following figure shows, by that time the inflation rate had increased to 6.9 percent, the highest it had been since January 1982. (Note that the figure shows inflation as measured by the percentage change from the same month in the previous year in the personal consumption expenditures (PCE) price index. Inflation as measured by the PCE is the gauge the Fed uses to determine whether it is achieving its goal of 2 percent inflation.)

By the time inflation reached its peak in mid-2022, many economists believed that the FOMC’s decision to delay increasing the federal funds rate until March 2022 had made it unlikely that the Fed could return inflation to 2 percent without causing a recession.  But the latest macroeconomic data indicate that—contrary to that expectation—the Fed does appear to have come very close to achieving a soft landing.  On January 26, the Bureau of Economic Analysis (BEA) released data on the PCE for December 2023. The following figure shows for the period since 2015, inflation as measured by the percentage change in the PCE from the same month in the previous year (the blue line) and as measured by the percentage change in the core PCE, which excludes the prices of food and energy (the red line).  

The figure shows that PCE inflation continued its decline, falling slightly in December to 2.6 percent. Core PCE inflation also declined in December to 2.9 percent from 3.2 percent in November. Note that both measures remained somewhat above the Fed’s inflation target of 2 percent.

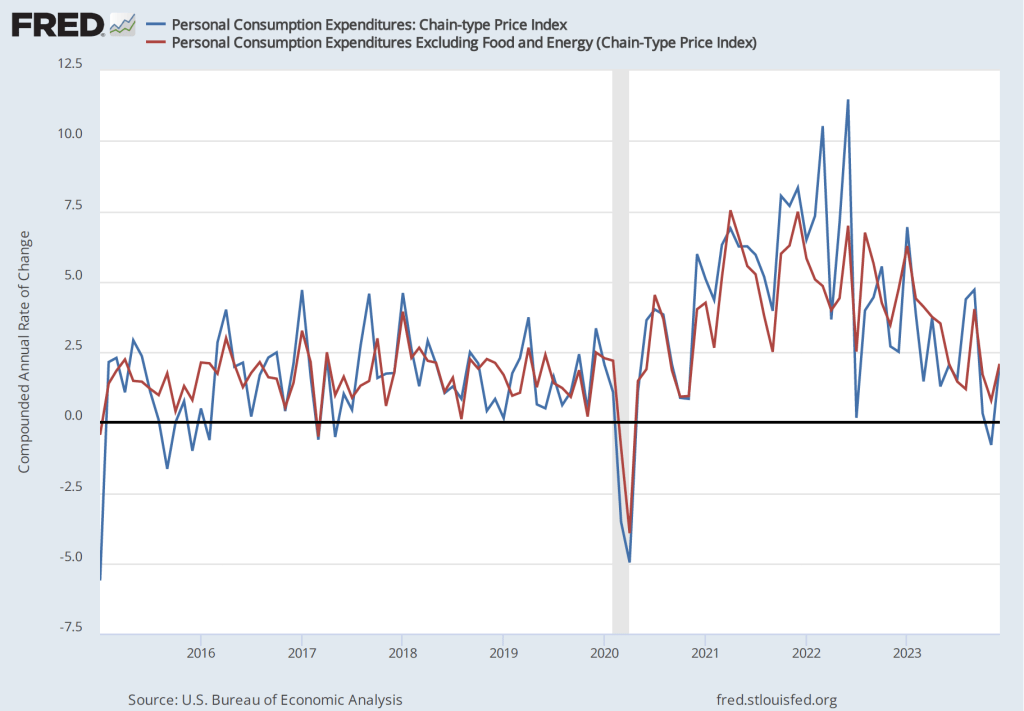
If we look at the 1-month inflation rate—that is the annual inflation rate calculated by compounding the current month’s rate over an entire year—inflation is closer to Fed’s target, as the following figure shows. The 1-month PCE inflation rate has moved somewhat erratically, but has generally trended down since mid-2022. In December, PCE inflation increased from from –0.8 percent in November (which acutally indicates that deflation occurred that month) to 2.0 percent in December. The 1-month core PCE inflation rate has moved less erratically, also trending down since mid-2022. In December, the 1-month core PCE inflation increased from 0.8 percent in November to 2.1 percent in December. In other words, the December reading on inflation indicates that inflation is very close to the Fed’s target.

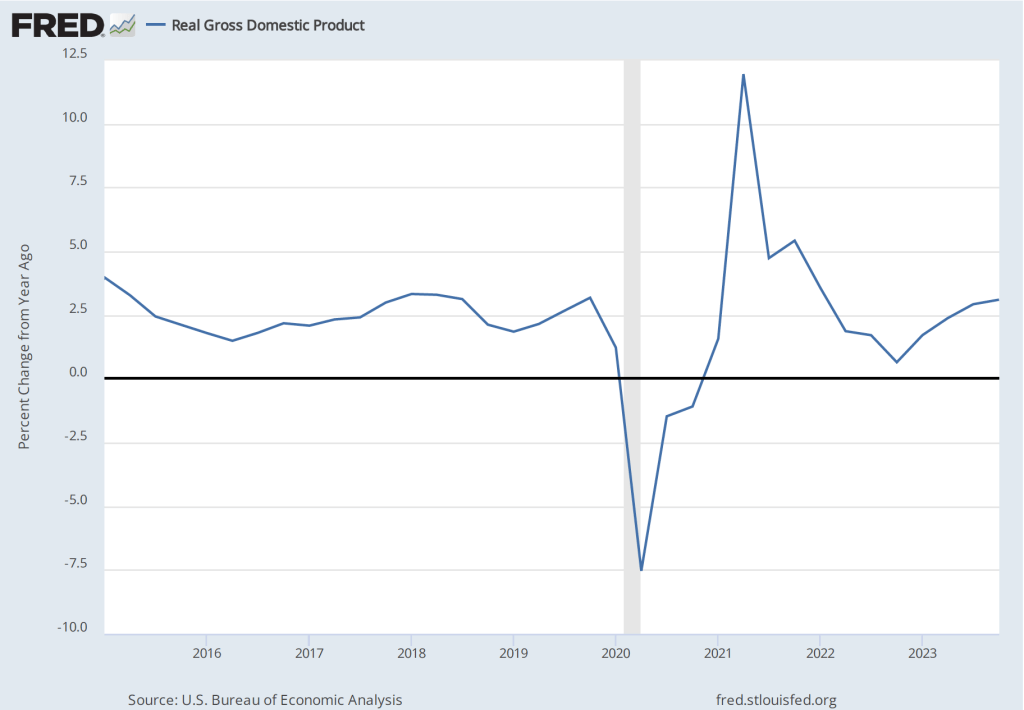
The following figure shows for each quarter since the beginning of 2015, the growth rate of real GDP measured as the percentage change from the same quarter in the previous year. The figure indicates that although real GDP growth dropped to below 1 percent in the fourth quarter of 2022, the growth rate rose during each quarter of 2023. The growth rate of 3.1 percent in the fourth quarter of 2023 remained well above the FOMC’s 1.8 percent estimate of long-run economic growth. (The average of the members of the FOMC’s estimates of the long-run growth rate of real GDP can be found here.) To this point, there is no indication from the GDP data that the U.S. economy is in danger of experiencing a recession in the near future.

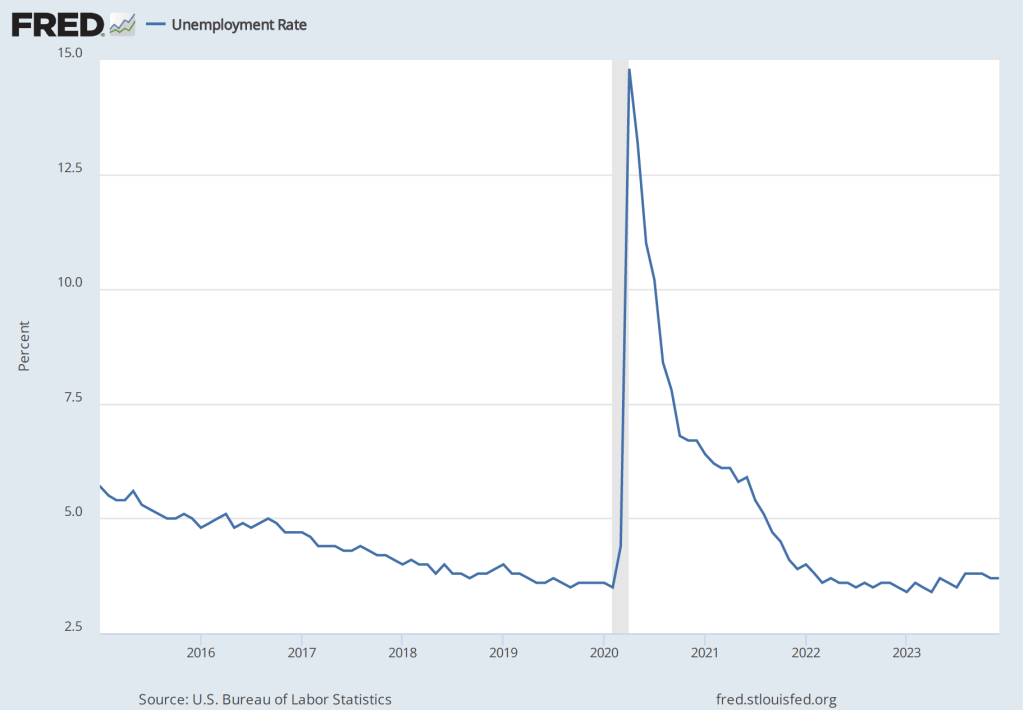
The labor market also shows few signs of a recession, as indicated by the following figure, which shows the unemployment rate in the months since January 2015. The unemployment rate has remained below 4 percent in each month since December 2021. The unemployment rate was 3.7 percent in December 2023, below the FOMC’s projection of a long-run unemployment rate of 4.1 percent.

The FOMC’s next meeting is on Tuesday and Wednesday of this week (February 1-2). Should we expect that at that meeting Fed Chair Jerome Powell will declare that the Fed has succeeded in achieving a soft landing? That seems unlikely. Powell and the other members of the committee have made clear that they will be cautious in interpreting the most recent macroeconomic data. With the growth rate of real GDP remaining above its long run trend and the unemployment rate remaining below most estimates of the natural rate of unemployment, there is still the potential that aggregate demand will increase at a rate that might cause the inflation rate to once again rise.

In a speech at the Brookings Institution on January 16, Fed Governor Christopher Waller echoed what appear to be the views of most members of the FOMC:

“Time will tell whether inflation can be sustained on its recent path and allow us to conclude that we have achieved the FOMC’s price-stability goal. Time will tell if this can happen while the labor market still performs above expectations. The data we have received the last few months is allowing the Committee to consider cutting the policy rate in 2024. However, concerns about the sustainability of these data trends requires changes in the path of policy to be carefully calibrated and not rushed. In the end, I am feeling more confident that the economy can continue along its current trajectory.”

At his press conference on February 1, following the FOMC meeting, Chair Powell will likely provide more insight into the committee’s current thinking.

Another Middling Inflation Report

Photo courtsey of Lena Buonanno.

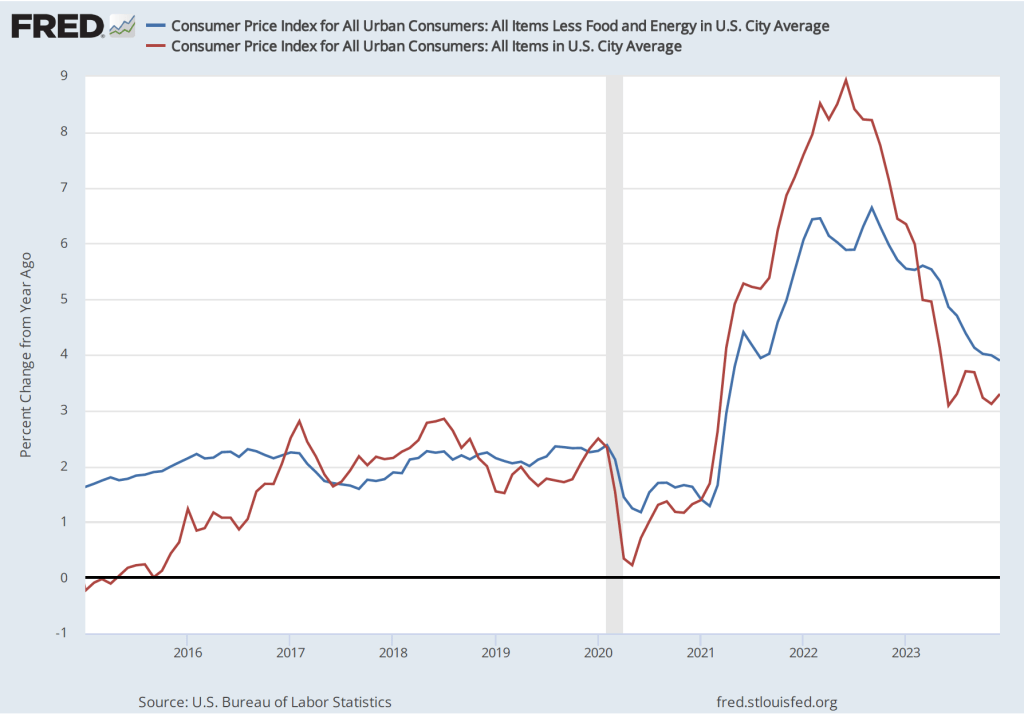
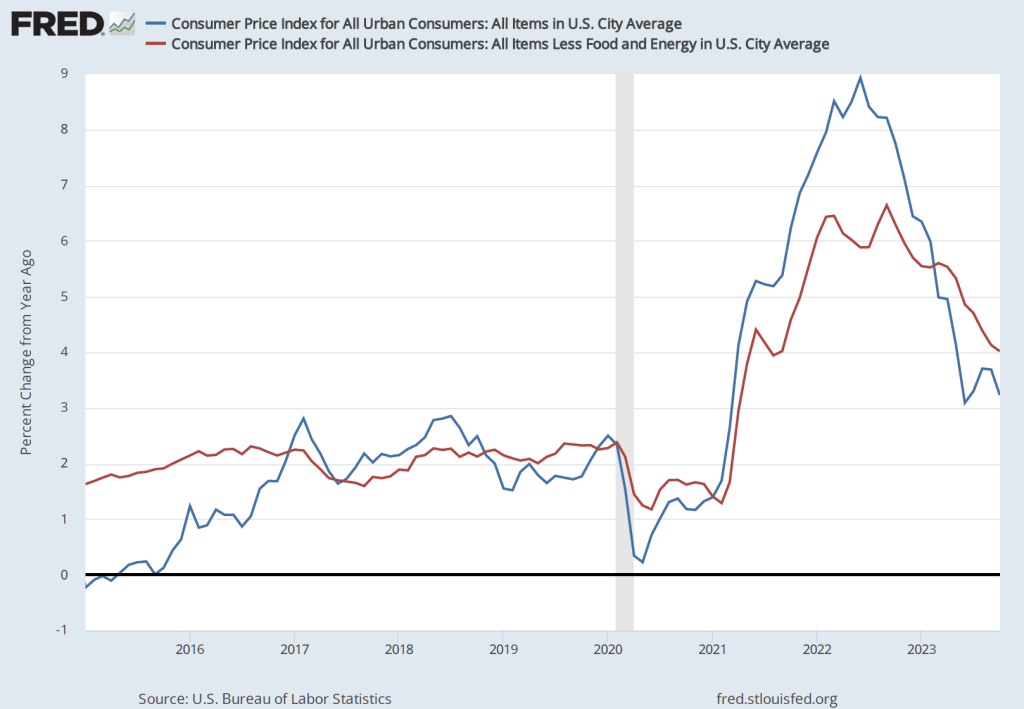
On the morning of January 11, 2024, the Bureau of Labor Statistics released its report on changes in consumer prices during December 2023. The report indicated that over the period from December 2022 to December 2023, the Consumer Price Index (CPI) increased by 3.4 percent (often referred to as year-over-year inflation). “Core” CPI, which excludes prices for food and energy, increased by 3.9 percent. The following figure shows the year-over-year inflation rate since Januar 2015, as measured using the CPI and core CPI.

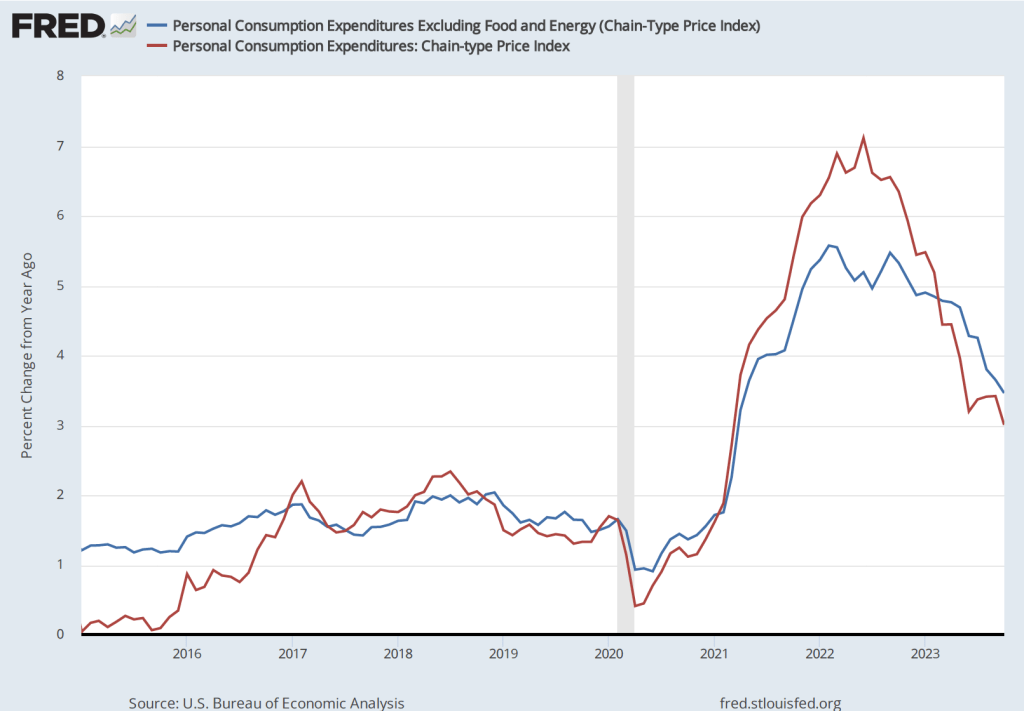
This report was consistent with other recent reports on the CPI and on the personal consumption expenditures (PCE) price index—the measure the Fed uses to gauge whether it is achieving its target of 2 percent annual inflation—in showing that inflation has declined substantially from its peak in mid-2022 but is still above the Fed’s target.

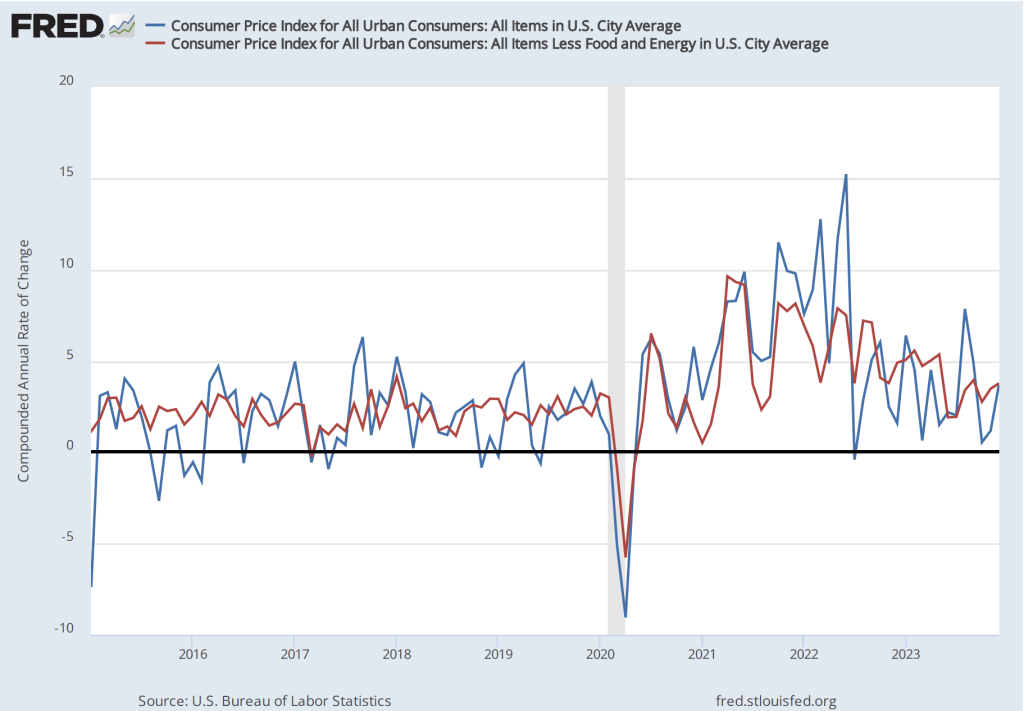
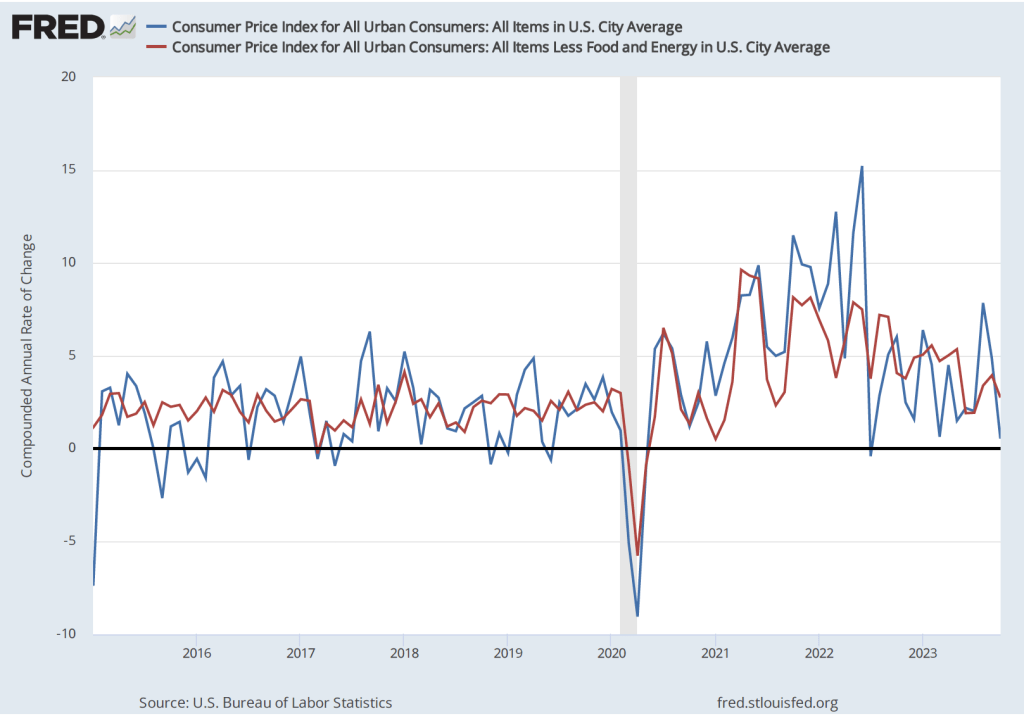
We get a similar result if we look at the 1-month inflation rate—that is the annual inflation rate calculated by compounding the current month’s rate over an entire year—as the following figure shows. The 1-month CPI inflation rate has moved erratically but has generally trended down. The 1-month core CPi inflation rate has moved less erratically, making the downward trend since mid-2022 clearer.

The headline on the Wall Street Journal article discussing this BLS report was: “Inflation Edged Up in December After Rapid Cooling Most of 2023.” The headline reflected the reaction of Wall Street investors who had hoped that the report would unambiguously show further slowing in inflation.
Overall, the report was middling: It didn’t show a significant acceleration in inflation at the end of 2023 but neither did it show a signficant slowing of inflation. At its next meeting on January 30-31, the Fed’s Federal Open Market Committee (FOMC) is expected to keep its target for the federal funds rate unchanged. There doesn’t appear to be anything in this inflation report that would be likely to affect the committee’s decision.
A Mixed Employment Report

Photo courtesy of Lena Buonanno.

During the last few months of 2023, the macroeconomic data has generally been consistent with the Federal Reserve successfully bringing about a soft landing: Inflation returning to the Fed’s 2 percent target without the economy entering a recession. On the morning of Friday, January 5, the Bureau of Labor Statistics (BLS) issued its latest “Employment Situation Report” for December 2023.  The report was generally consistent with the economy still being on course for a soft landing, but because both employment growth and wage growth were stronger than expected, the report makes it somewhat less likely that the Federal Reserve’s Federal Open Market Committee (FOMC) will soon begin reducing its target for the federal funds rate. (The full report can be found here.)
Economists and policymakers—notably including the members of the FOMC—typically focus on the change in total nonfarm payroll employment as recorded in the establishment, or payroll, survey. That number gives what is generally considered to be the best gauge of the current state of the labor market.

The report indicated that during December there had been a net increase of 216,000 jobs.  This number was well above the expected gain of 160,000 to 170,000 jobs that several surveys of economists had forecast (see here, here, and here). The BLS revised downward by a total of 71,000 jobs its previous estimates for October and November, somewhat offsetting the surprisingly strong estimated increase in net jobs for December.

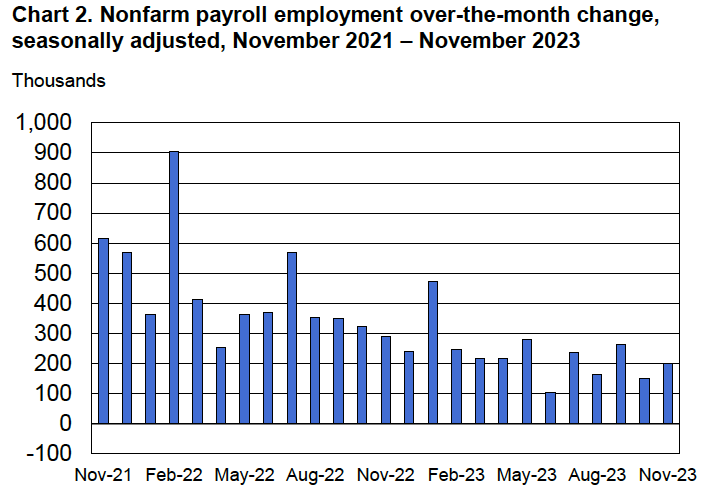
The following figure from the report shows the net increase in jobs each month since December 2021. Although the net number of jobs created has trended up from September to December, the longer run trend has been toward slower growth in employment. In the first half of 2023, an average of 257,000 net jobs were created per month, whereas in the second half of 2023, an average of 193,000 net jobs were created per month. Average weekly hours worked have also been slowly trending down, from 34.6 hours per week in January to 34.3 hours per week in December.

Economists surveyed were also expecting that the unemployment rate—calculated by the BLS from data gathered in the household survey—would increase slightly. Instead, it remained constant at 3.7 percent. As the following figure shows, the unemployment rate has been below 4.0 percent each month since December 2021. The members of the FOMC expect that the unemployment rate during 2024 will be 4.1 percent. (The most recent economic projections of the members of the FOMC can be found here.)

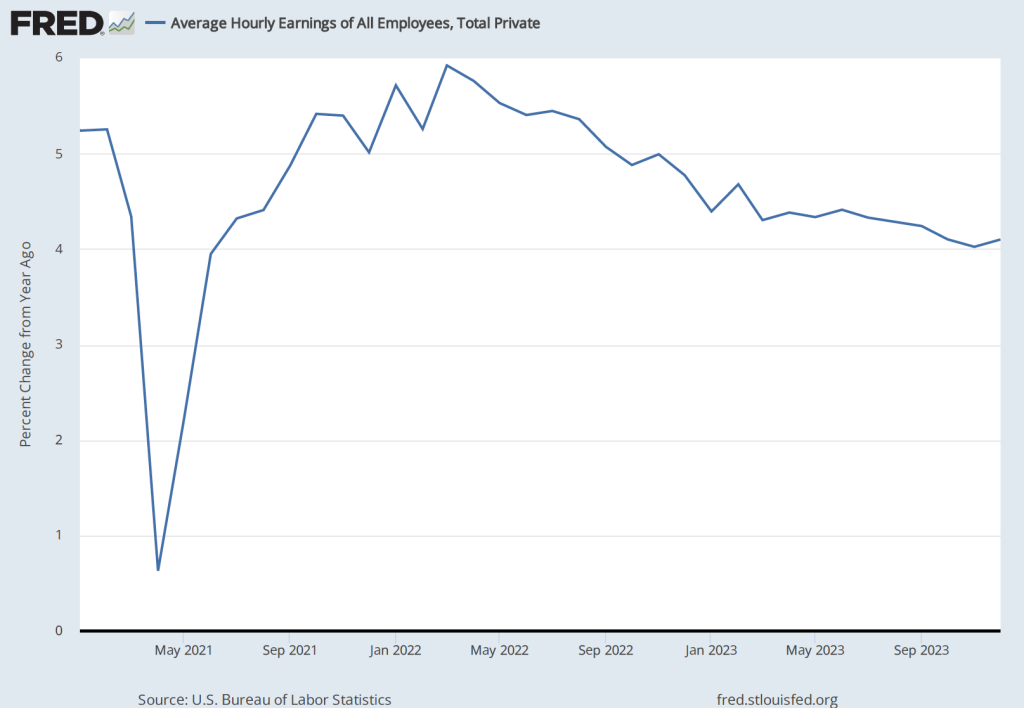
Although the employment data indicate that conditions in the labor market are easing in a way that may be consistent with inflation returning to the Fed’s 2 percent target, the data on wage growth are so far sending a different message. Average hourly earnings—data on which are collected in the establishment survey—increased by 4.1 percent in December compared with the same month in 2022. This rate of increase was slightly higher than the 4.0 percent increase in November. The following figure shows movements in the rate of increase in average hourly earnings since January 2021.

In his press conference following the FOMC’s December 13, 2023 meeting, Fed Chair Jerome Powell noted that increases in wages at 4 percent or higher were unlikely to result in inflation declining to the Fed’s 2 percent goal:

“So wages are still running a bit above what would be consistent with 2 percent inflation over a long period of time. They’ve been gradually cooling off. But if wages are running around 4 percent, that’s still a bit above, I would say.”

The FOMC’s next meeting is on January 30-31. At this point it seems likely that the committee will maintain its current target for the federal funds. The data in the latest employment report make it somewhat less likely that the committee will begin reducing its target at its meeting on March 19-20, as some economists and some Wall Street analysts had been expecting. (The calendar of the FOMC’s 2024 meetings can be found here.)

Another Employment Report Consistent with a Soft Landing

Photo courtesy of Lena Buonanno.

In recent months, the macroeconomic data has generally been consistent with the Federal Reserve successfully bringing about a soft landing: Inflation returning to the Fed’s 2 percent target without the economy entering a recession. The Bureau of Labor Statistics’ latest Employment Situation Report, released on the morning of Friday, December 8,  was consistent with this trend. (The full report can be found here.)

Economists and policymakers—notably including the members of the Federal Reserve’s Federal Open Market Committee (FOMC)—typically focus on the change in total nonfarm payroll employment as recorded in the establishment, or payroll, survey. That number gives what is generally considered to be the best gauge of the current state of the labor market.

The report indicated that during November there had been a net increase of 199,000 jobs.  This number was somewhat above the expected gain of 153,000 jobs Reuters news service reported from its survey of economists and just slightly above an expected gain of 190,000 jobs the Wall Street Journal reported from a separate survey of economists. The BLS revised downward by 35,000 jobs its previous estimate for September. It left its estimate for October unchanged.  The following figure from the report shows the net increase in jobs each month since November 2021.

Because the BLS often substantially revises its preliminary estimates of employment from the establishment survey, it’s important not to overinterpret data for a single month or even for a few months. But general trends in the data can give useful information on changes in the state of the labor market. The estimate for November is the fourth time in the past six months that employment has increased by less than 200,000. Prior to that, employment had increased by more than 200,000 every month since January 2021.

Although the rate of job increases is slowing, it’s still above the rate at which new entrants enter the labor market, which is estimated to be roughly 90,000 people per month. The additional jobs are being filled in part by increased employment among people aged 25 to 54—so-called prime-age workers. (We discuss the employment-population ratio in Macroeconomics, Chapter 9, Section 9.1, Economics, Chapter 19, Section 9.1, and Essentials of Economics, Chapter 13, Section 13.1.) As the following figure shows, the employment-population ratio for prime-age workers remains above its level in early 2020, just before the spread of the Covid–19 pandemic in the United States.

The estimated unemployment rate, which is collected in the household survey, was down slightly from 3.9 percent to 3.7 percent. A shown in the following figure, the unemployment rate has been below 4 percent every month since February 2022.

The Employment Situation Report also presents data on wages, as measured by average hourly earnings. The growth rate of average hourly earnings, measured as the percentage change from the same month in the previous year, continued its gradual decline, as shown in the following figure. As a result, upward pressure on prices from rising labor costs is easing. (Keep in mind, though, as we note in this blog post, changes in average hourly earnings have shortcomings as a measure of changes in the costs of labor to businesses.)

Taken together, the data in the latest employment report indicate that the labor market is becoming less tight, reflecting a gradual slowing in U.S. economic growth. The data are consistent with the U.S. economy approaching a soft landing. It’s still worth bearing in mind, of course, that, as Fed Chair Jerome Powell continues to caution, there’s no certainty that inflation won’t surge again or that the U.S. economy won’t enter a recession.

Can We Now Rule Out One of the Three Potential Monetary Policy Outcomes?

Federal Reserve Chair Jerome Powell (photo from bloomberg.com)

In a blog post from February of this year, we discussed three possible outcomes of the contractionary monetary policy that the Federal Reserve has been pursuing since March 2022, when the Federal Open Market Committee (FOMC) began raising its target range for the federal funds rate:

  1.  A soft landing. The Fed’s preferred outcome; inflation returns to the Fed’s target of 2 percent without the economy falling into recession.
  2. A hard landing. Inflation returns to the Fed’s 2 percent target, but the economy falls into a recession.
  3. No landing. At the beginning of 2023, the unemployment remained very low and inflation, as measured by the percentage change in the personal consumption expenditures (PCE) price index from the same month in the previous year, was still above 5 percent. So, some observers, particularly in Wall Street financial firms, began discussing the possibility that low unemployment and high inflation might persist indefinitely, resulting an outcome of no landing.

At the end of 2023, the economy appears to be slowing: Retail sales declined in October; real disposable personal income increased in October, but it has been trending down, as have real personal consumption expenditures; while the increase in third quarter real GDP was recently revised upward from 4.9 percent to 5.2 percent, forecasts of growth in real GDP during the fourth quarter show a marked slowing—for instance, GDPNow, compiled by the Atlanta Fed, estimates fourth quarter growth at 2.1 percent; and while employment continues to expand, average weekly hours have been slowly declining and initial claims for unemployment insurance have been increasing.

The slowing in the growth of output, income, and employment are reflected in a falling inflation rate. The following figure show the percentage change since the same month in the previous year in PCE price index, which is the measure the Fed uses to gauge whether it is hitting its 2 percent inflation target. (We discuss the reasons for the Fed preferring the PCE price index to the consumer price index (CPI) in Macroeconomics, Chapter 15, Section 15.5 and Economics, Chapter 25, Section 25.5.) The figure also shows core PCE, which excludes the prices of food and energy. Core PCE inflation typically gives a better measure of the underlying inflation rate than does PCE inflation.

PCE inflation declined from 3.4 percent in September to 3.0 percent in October. Core PCE inlation declined from 3.8 percent in September to 3.5 percent in September. Although inflation has been declining from its peak in mid-2022, both of these measures of inflation remain above the Fed’s 2 percent target.

But if we look at the 1-month inflation rate—that is the annual inflation rate calculated by compounding the current month’s rate over an entire year—we see a much sharper decline in inflation, as the following figure shows.

The 1-month inflation rate is naturally more volatile than the 12-month inflation rate. In this case, the 1-month rate shows a sharp decline in PCE inflation from 3.8 percent in September to 0.6 percent in October. Core PCE inflation declined less sharply from 3.9 percent in September to 2.0 percent in October.

The continuing decline in inflation has caused some economists and Wall Street analysts to predict that the FOMC will not implement further increases in its target for the federal funds rate and will likely begin cutting its target by mid-2024.

On December 1 in a speech at Spelman College in Atlanta, Fed Chair Jerome Powell urged caution in assuming that the Fed has succeeded in putting inflation on a course back to its 2 percent target:

“The FOMC is strongly committed to bringing inflation down to 2 percent over time, and to keeping policy restrictive until we are confident that inflation is on a path to that objective. It would be premature to conclude with confidence that we have achieved a sufficiently restrictive stance, or to speculate on when policy might ease. We are prepared to tighten policy further if it becomes appropriate to do so.”

In terms of the three policy outcomes listed at the beginning of this post, the third—no landing, with the unemployment rate remaining very low while the inflation rate remains above the Fed’s 2 percent target—now seems unlikely. The labor market appears to be weakening, which will likely result in increases in the unemployment rate. The next “Employment Report” from the Bureau of Labor Statistics, which will be released on December 8, will provide additional data on the state of the labor market.

Although we can’t entirely rule out the possibility of a no landing outcome, it seems more likely that the economy will either make a soft landing—if output and employment continue to increase, although at a slower rate, while inflation continues to decline—or a hard landing—if output and employment begin to fall as the economy enters a recession.  Although a consensus seems to be building among economists, policymakers, and Wall Street analysts that a soft landing is the likeliest outcome, Powell has provided a reminder that that outcome is far from certain.

Wall Street Journal: “Cooling Inflation Likely Ends Fed Rate Hikes”

The Bureau of Labor Statistics released its latest report on consumer prices the morning of November 14. The Wall Street Journal’s headline reflects the general reaction to the report: The inflation rate continued to decline, which made it less likely that the Fed’s Federal Open Market Committee will raise its target range for the federal funds rate again at its December meeting. The following figure shows inflation measured as the percentage change in the Consumer Price Index (CPI) from the same month in the previous year. It also shows the inflation rate measure using “core” CPI, which excludes prices for food and energy.

The inflation rate for the CPI declined from 3.7 percent in September to 3.2 percent in October. Core CPI declined from 4.1 percent in September to 4.0 percent in October. So, measured this way, inflation declined substantially when measured by the CPI including prices of all goods and services but only slightly when measured using core CPI.

The 12-month inflation rate is the one typically reported in the Wall Street Journal and elsewhere, but it has the drawback that it doesn’t always reflect accurately the current trend in prices. The following figure shows the 1-month inflation rate—that is the annual inflation rate calculated by compounding the current month’s rate over an entire year— for CPI and core CPI. The 1-month inflation rate is naturally more volatile than the 12-month inflation rate. In this case, 1-month rate shows a sharp decline in the inflation rate for the CPI from 4.9 percent in September to 0.5 percent in October. Core inflation declined less sharply from 3.9 percent in September to 2.8 percent in October.

The release of the CPI report was treated as good news on Wall Street, with the Dow Jones Industrial Average increasing by 500 points and the interest rate on the 10-year U.S. Treasury Note declining from 4.6 percent just before the report was released to 4.4 percent immediately after. The increases in stock and bond prices (recall that the prices of bonds and the yields on the bonds move in opposite directions, so bond prices rose following release of the report) reflect the view of financial investors that if the FOMC stops increasing its target for the federal funds rate, the chance that the U.S. economy will fall into a recession is reduced.

A word of caution, however. In a speech on November 9, Fed Chair Jerome Powell noted that the FOMC may need still need to implement additional increases to its federal funds rate target:

“My colleagues and I are gratified by this progress [against inflation] but expect that the process of getting inflation sustainably down to 2 percent has a long way to go…. The Federal Open Market Committee (FOMC) is committed to achieving a stance of monetary policy that is sufficiently restrictive to bring inflation down to 2 percent over time; we are not confident that we have achieved such a stance. We know that ongoing progress toward our 2 percent goal is not assured: Inflation has given us a few head fakes. If it becomes appropriate to tighten policy further, we will not hesitate to do so.”

So, while the latest inflation report is good news, it’s still too early to know whether inflation is on a stable path to return to the Fed’s 2 percent target. (It’s worth noting that the Fed uses inflation as measured by the personal consumption expenditure (PCE) price index rather than as measured by the CPI when evaluating whether it has achieved its 2 percent target.)