A Mixed Employment Report

Photo courtesy of Lena Buonanno.

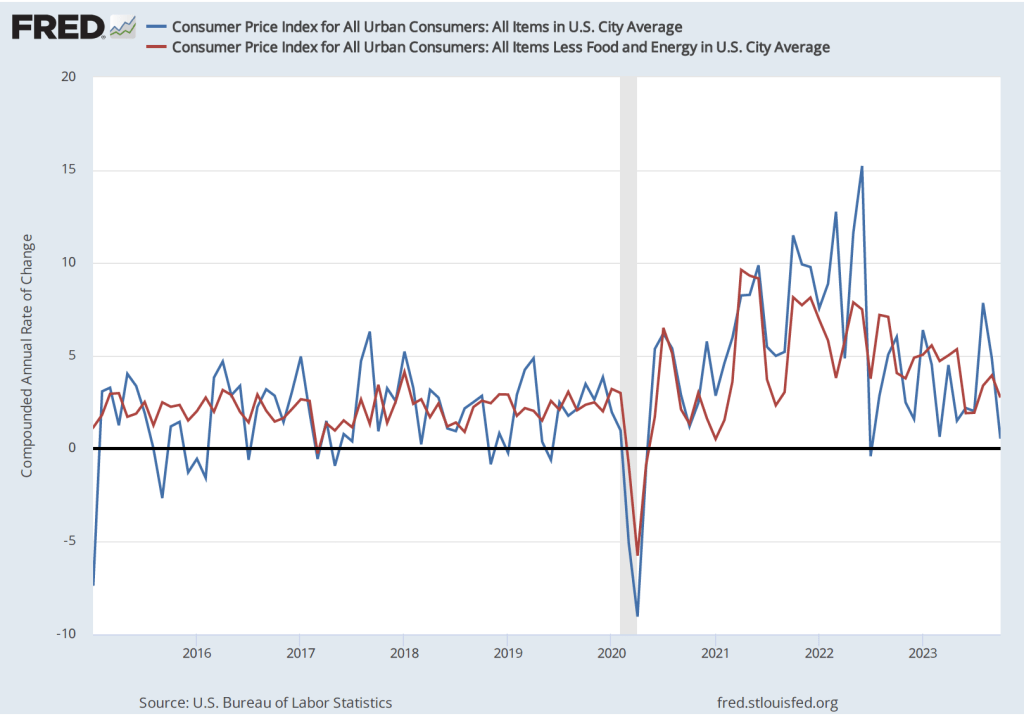
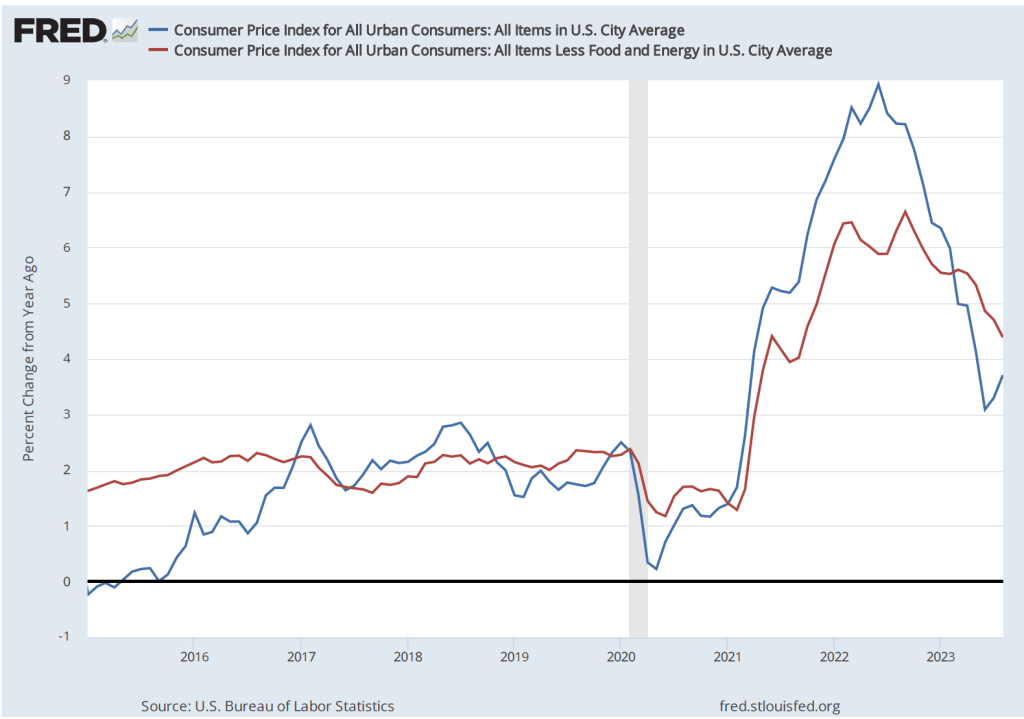
During the last few months of 2023, the macroeconomic data has generally been consistent with the Federal Reserve successfully bringing about a soft landing: Inflation returning to the Fed’s 2 percent target without the economy entering a recession. On the morning of Friday, January 5, the Bureau of Labor Statistics (BLS) issued its latest “Employment Situation Report” for December 2023.  The report was generally consistent with the economy still being on course for a soft landing, but because both employment growth and wage growth were stronger than expected, the report makes it somewhat less likely that the Federal Reserve’s Federal Open Market Committee (FOMC) will soon begin reducing its target for the federal funds rate. (The full report can be found here.)

Economists and policymakers—notably including the members of the FOMC—typically focus on the change in total nonfarm payroll employment as recorded in the establishment, or payroll, survey. That number gives what is generally considered to be the best gauge of the current state of the labor market.

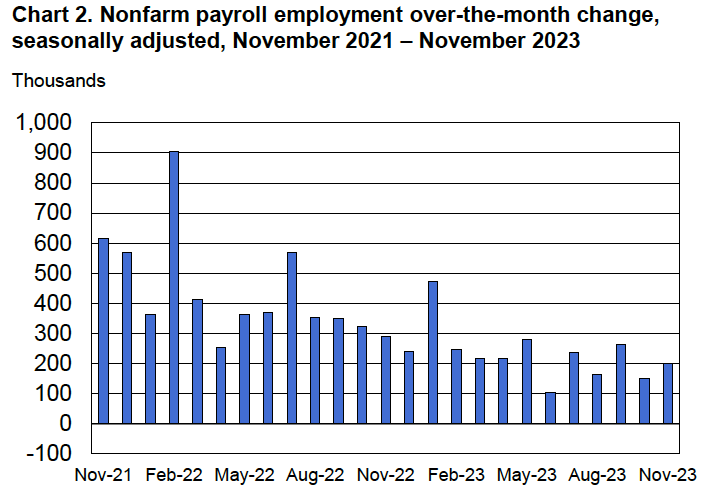
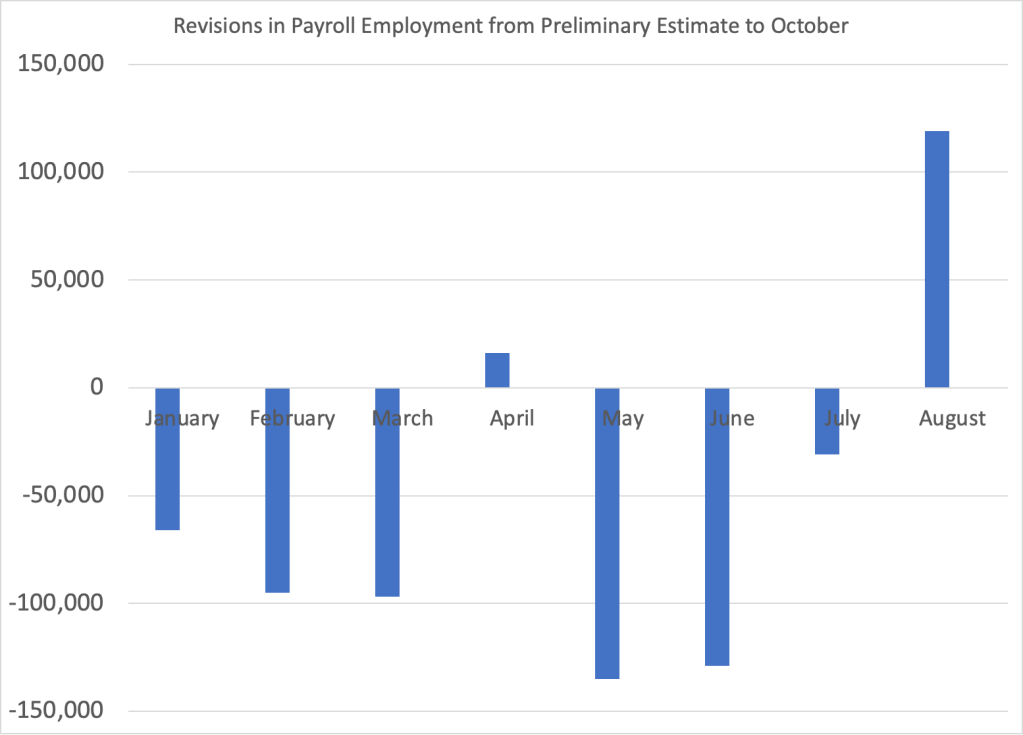
The report indicated that during December there had been a net increase of 216,000 jobs.  This number was well above the expected gain of 160,000 to 170,000 jobs that several surveys of economists had forecast (see here, here, and here). The BLS revised downward by a total of 71,000 jobs its previous estimates for October and November, somewhat offsetting the surprisingly strong estimated increase in net jobs for December.

The following figure from the report shows the net increase in jobs each month since December 2021. Although the net number of jobs created has trended up from September to December, the longer run trend has been toward slower growth in employment. In the first half of 2023, an average of 257,000 net jobs were created per month, whereas in the second half of 2023, an average of 193,000 net jobs were created per month. Average weekly hours worked have also been slowly trending down, from 34.6 hours per week in January to 34.3 hours per week in December.

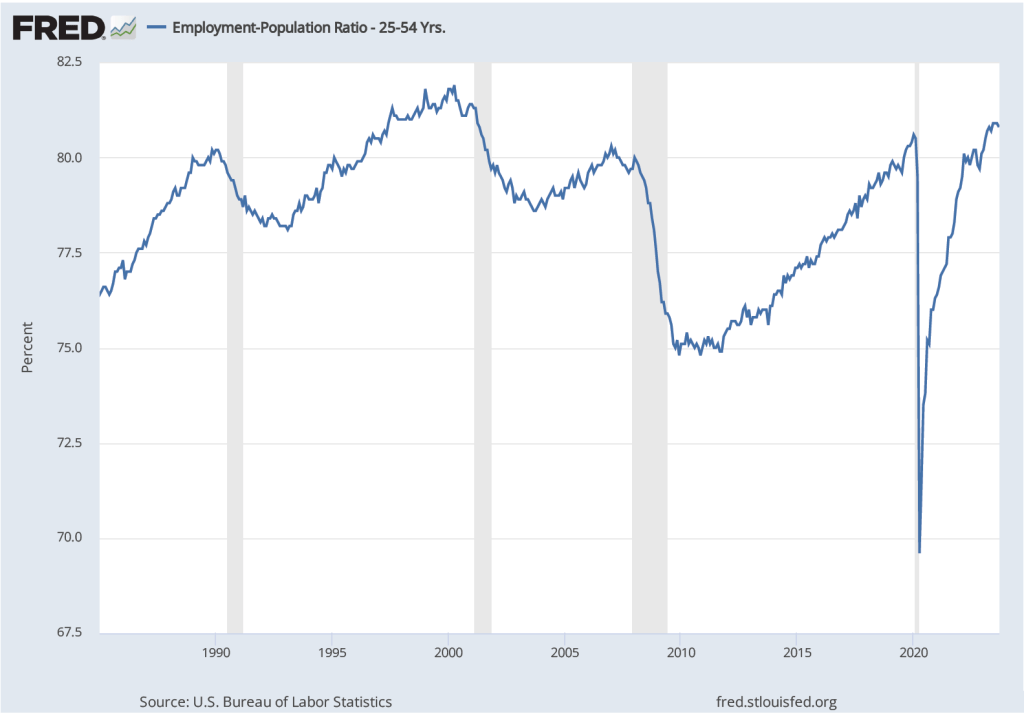
Economists surveyed were also expecting that the unemployment rate—calculated by the BLS from data gathered in the household survey—would increase slightly. Instead, it remained constant at 3.7 percent. As the following figure shows, the unemployment rate has been below 4.0 percent each month since December 2021. The members of the FOMC expect that the unemployment rate during 2024 will be 4.1 percent. (The most recent economic projections of the members of the FOMC can be found here.)

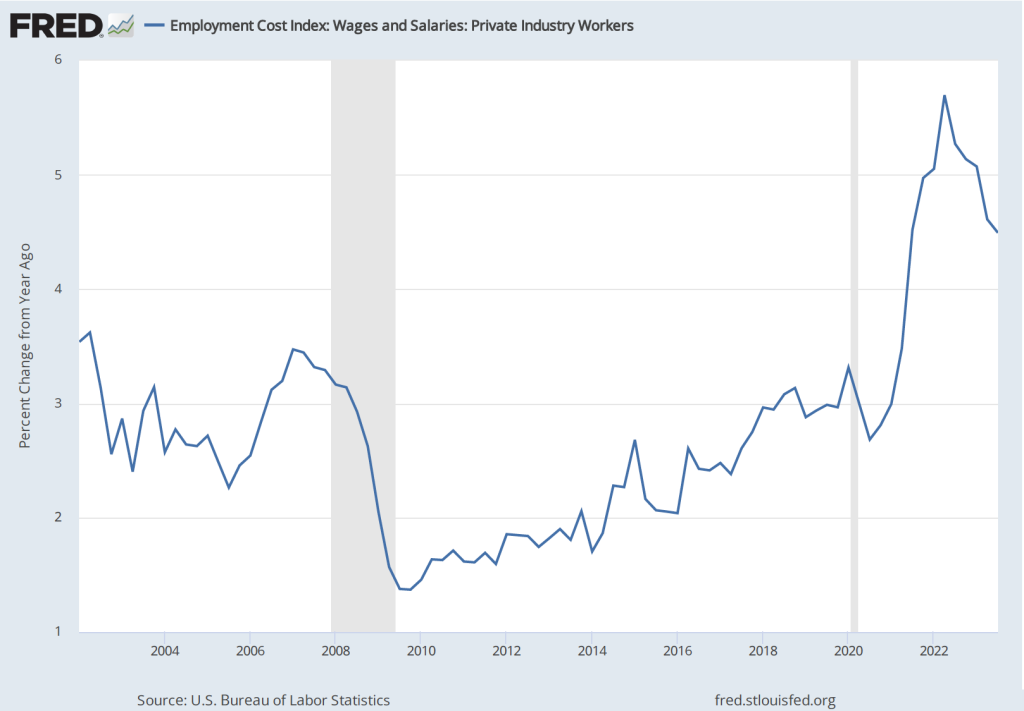
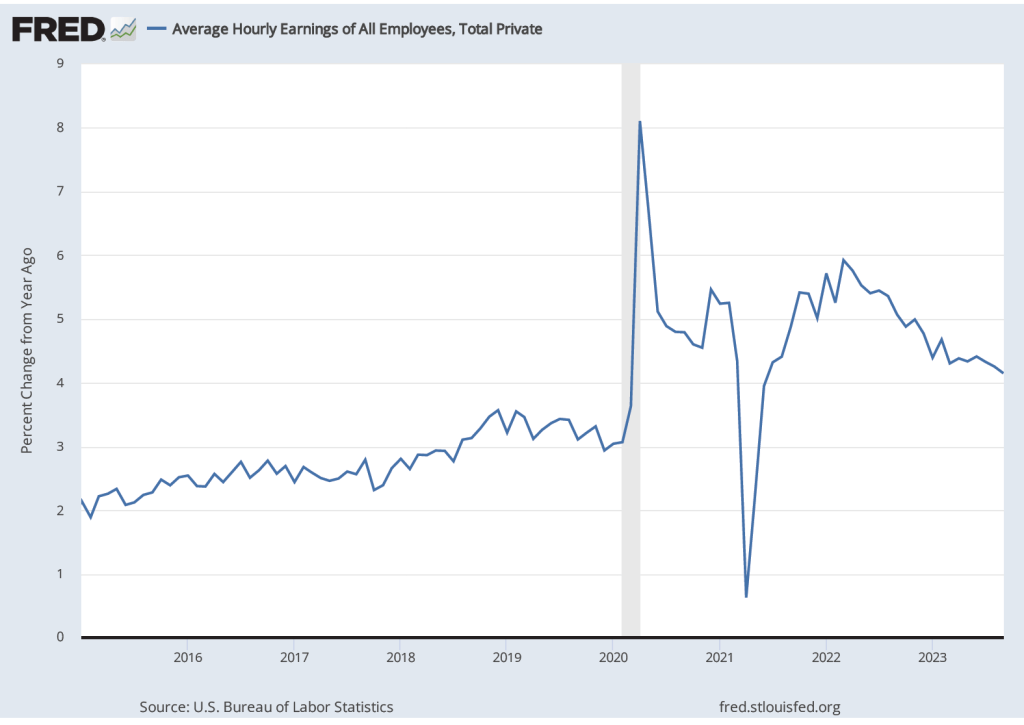
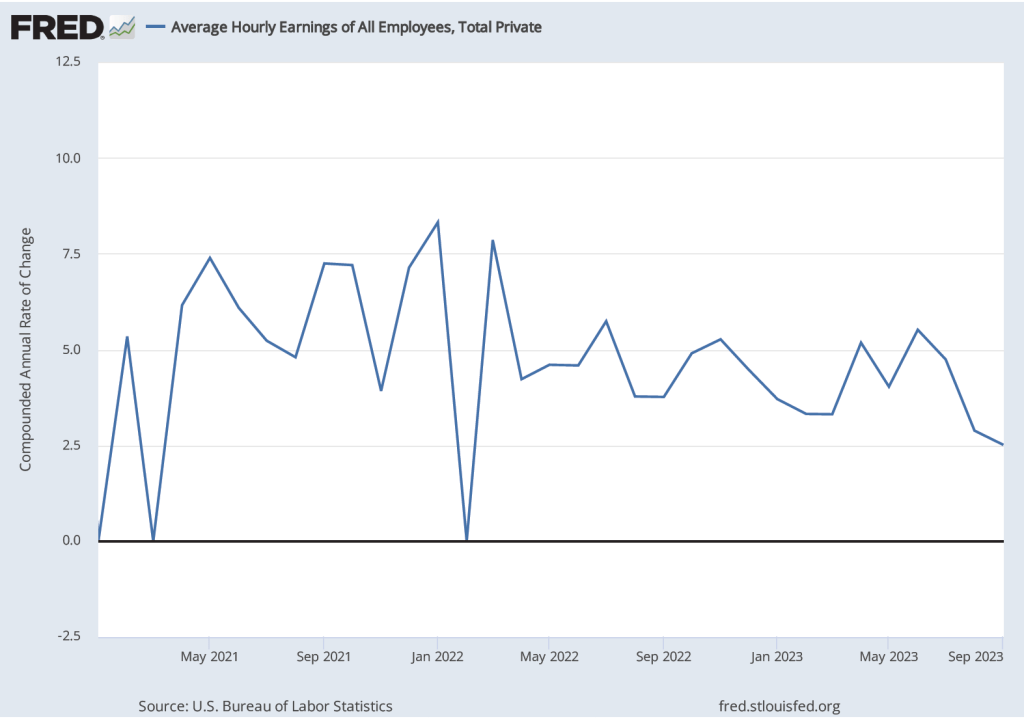
Although the employment data indicate that conditions in the labor market are easing in a way that may be consistent with inflation returning to the Fed’s 2 percent target, the data on wage growth are so far sending a different message. Average hourly earnings—data on which are collected in the establishment survey—increased by 4.1 percent in December compared with the same month in 2022. This rate of increase was slightly higher than the 4.0 percent increase in November. The following figure shows movements in the rate of increase in average hourly earnings since January 2021.

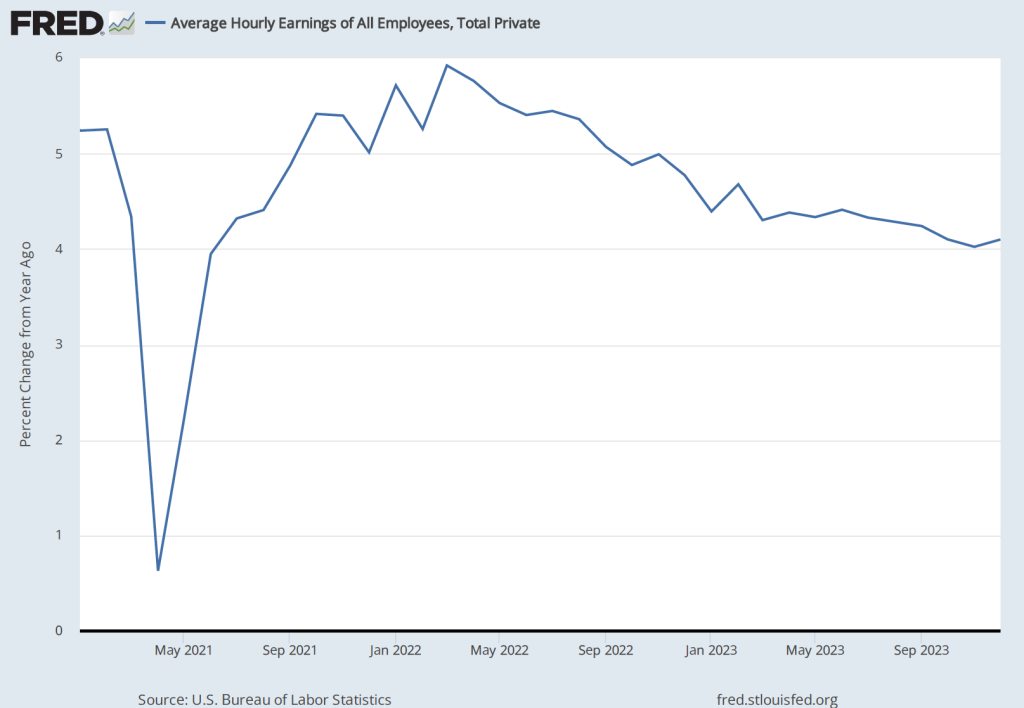
In his press conference following the FOMC’s December 13, 2023 meeting, Fed Chair Jerome Powell noted that increases in wages at 4 percent or higher were unlikely to result in inflation declining to the Fed’s 2 percent goal:

“So wages are still running a bit above what would be consistent with 2 percent inflation over a long period of time. They’ve been gradually cooling off. But if wages are running around 4 percent, that’s still a bit above, I would say.”

The FOMC’s next meeting is on January 30-31. At this point it seems likely that the committee will maintain its current target for the federal funds. The data in the latest employment report make it somewhat less likely that the committee will begin reducing its target at its meeting on March 19-20, as some economists and some Wall Street analysts had been expecting. (The calendar of the FOMC’s 2024 meetings can be found here.)

Another Employment Report Consistent with a Soft Landing

Photo courtesy of Lena Buonanno.

In recent months, the macroeconomic data has generally been consistent with the Federal Reserve successfully bringing about a soft landing: Inflation returning to the Fed’s 2 percent target without the economy entering a recession. The Bureau of Labor Statistics’ latest Employment Situation Report, released on the morning of Friday, December 8,  was consistent with this trend. (The full report can be found here.)

Economists and policymakers—notably including the members of the Federal Reserve’s Federal Open Market Committee (FOMC)—typically focus on the change in total nonfarm payroll employment as recorded in the establishment, or payroll, survey. That number gives what is generally considered to be the best gauge of the current state of the labor market.

The report indicated that during November there had been a net increase of 199,000 jobs.  This number was somewhat above the expected gain of 153,000 jobs Reuters news service reported from its survey of economists and just slightly above an expected gain of 190,000 jobs the Wall Street Journal reported from a separate survey of economists. The BLS revised downward by 35,000 jobs its previous estimate for September. It left its estimate for October unchanged.  The following figure from the report shows the net increase in jobs each month since November 2021.

Because the BLS often substantially revises its preliminary estimates of employment from the establishment survey, it’s important not to overinterpret data for a single month or even for a few months. But general trends in the data can give useful information on changes in the state of the labor market. The estimate for November is the fourth time in the past six months that employment has increased by less than 200,000. Prior to that, employment had increased by more than 200,000 every month since January 2021.

Although the rate of job increases is slowing, it’s still above the rate at which new entrants enter the labor market, which is estimated to be roughly 90,000 people per month. The additional jobs are being filled in part by increased employment among people aged 25 to 54—so-called prime-age workers. (We discuss the employment-population ratio in Macroeconomics, Chapter 9, Section 9.1, Economics, Chapter 19, Section 9.1, and Essentials of Economics, Chapter 13, Section 13.1.) As the following figure shows, the employment-population ratio for prime-age workers remains above its level in early 2020, just before the spread of the Covid–19 pandemic in the United States.

The estimated unemployment rate, which is collected in the household survey, was down slightly from 3.9 percent to 3.7 percent. A shown in the following figure, the unemployment rate has been below 4 percent every month since February 2022.

The Employment Situation Report also presents data on wages, as measured by average hourly earnings. The growth rate of average hourly earnings, measured as the percentage change from the same month in the previous year, continued its gradual decline, as shown in the following figure. As a result, upward pressure on prices from rising labor costs is easing. (Keep in mind, though, as we note in this blog post, changes in average hourly earnings have shortcomings as a measure of changes in the costs of labor to businesses.)

Taken together, the data in the latest employment report indicate that the labor market is becoming less tight, reflecting a gradual slowing in U.S. economic growth. The data are consistent with the U.S. economy approaching a soft landing. It’s still worth bearing in mind, of course, that, as Fed Chair Jerome Powell continues to caution, there’s no certainty that inflation won’t surge again or that the U.S. economy won’t enter a recession.

Can We Now Rule Out One of the Three Potential Monetary Policy Outcomes?

Federal Reserve Chair Jerome Powell (photo from bloomberg.com)

In a blog post from February of this year, we discussed three possible outcomes of the contractionary monetary policy that the Federal Reserve has been pursuing since March 2022, when the Federal Open Market Committee (FOMC) began raising its target range for the federal funds rate:

  1.  A soft landing. The Fed’s preferred outcome; inflation returns to the Fed’s target of 2 percent without the economy falling into recession.
  2. A hard landing. Inflation returns to the Fed’s 2 percent target, but the economy falls into a recession.
  3. No landing. At the beginning of 2023, the unemployment remained very low and inflation, as measured by the percentage change in the personal consumption expenditures (PCE) price index from the same month in the previous year, was still above 5 percent. So, some observers, particularly in Wall Street financial firms, began discussing the possibility that low unemployment and high inflation might persist indefinitely, resulting an outcome of no landing.

At the end of 2023, the economy appears to be slowing: Retail sales declined in October; real disposable personal income increased in October, but it has been trending down, as have real personal consumption expenditures; while the increase in third quarter real GDP was recently revised upward from 4.9 percent to 5.2 percent, forecasts of growth in real GDP during the fourth quarter show a marked slowing—for instance, GDPNow, compiled by the Atlanta Fed, estimates fourth quarter growth at 2.1 percent; and while employment continues to expand, average weekly hours have been slowly declining and initial claims for unemployment insurance have been increasing.

The slowing in the growth of output, income, and employment are reflected in a falling inflation rate. The following figure show the percentage change since the same month in the previous year in PCE price index, which is the measure the Fed uses to gauge whether it is hitting its 2 percent inflation target. (We discuss the reasons for the Fed preferring the PCE price index to the consumer price index (CPI) in Macroeconomics, Chapter 15, Section 15.5 and Economics, Chapter 25, Section 25.5.) The figure also shows core PCE, which excludes the prices of food and energy. Core PCE inflation typically gives a better measure of the underlying inflation rate than does PCE inflation.

PCE inflation declined from 3.4 percent in September to 3.0 percent in October. Core PCE inlation declined from 3.8 percent in September to 3.5 percent in September. Although inflation has been declining from its peak in mid-2022, both of these measures of inflation remain above the Fed’s 2 percent target.

But if we look at the 1-month inflation rate—that is the annual inflation rate calculated by compounding the current month’s rate over an entire year—we see a much sharper decline in inflation, as the following figure shows.

The 1-month inflation rate is naturally more volatile than the 12-month inflation rate. In this case, the 1-month rate shows a sharp decline in PCE inflation from 3.8 percent in September to 0.6 percent in October. Core PCE inflation declined less sharply from 3.9 percent in September to 2.0 percent in October.

The continuing decline in inflation has caused some economists and Wall Street analysts to predict that the FOMC will not implement further increases in its target for the federal funds rate and will likely begin cutting its target by mid-2024.

On December 1 in a speech at Spelman College in Atlanta, Fed Chair Jerome Powell urged caution in assuming that the Fed has succeeded in putting inflation on a course back to its 2 percent target:

“The FOMC is strongly committed to bringing inflation down to 2 percent over time, and to keeping policy restrictive until we are confident that inflation is on a path to that objective. It would be premature to conclude with confidence that we have achieved a sufficiently restrictive stance, or to speculate on when policy might ease. We are prepared to tighten policy further if it becomes appropriate to do so.”

In terms of the three policy outcomes listed at the beginning of this post, the third—no landing, with the unemployment rate remaining very low while the inflation rate remains above the Fed’s 2 percent target—now seems unlikely. The labor market appears to be weakening, which will likely result in increases in the unemployment rate. The next “Employment Report” from the Bureau of Labor Statistics, which will be released on December 8, will provide additional data on the state of the labor market.

Although we can’t entirely rule out the possibility of a no landing outcome, it seems more likely that the economy will either make a soft landing—if output and employment continue to increase, although at a slower rate, while inflation continues to decline—or a hard landing—if output and employment begin to fall as the economy enters a recession.  Although a consensus seems to be building among economists, policymakers, and Wall Street analysts that a soft landing is the likeliest outcome, Powell has provided a reminder that that outcome is far from certain.

Wall Street Journal: “Cooling Inflation Likely Ends Fed Rate Hikes”

The Bureau of Labor Statistics released its latest report on consumer prices the morning of November 14. The Wall Street Journal’s headline reflects the general reaction to the report: The inflation rate continued to decline, which made it less likely that the Fed’s Federal Open Market Committee will raise its target range for the federal funds rate again at its December meeting. The following figure shows inflation measured as the percentage change in the Consumer Price Index (CPI) from the same month in the previous year. It also shows the inflation rate measure using “core” CPI, which excludes prices for food and energy.

The inflation rate for the CPI declined from 3.7 percent in September to 3.2 percent in October. Core CPI declined from 4.1 percent in September to 4.0 percent in October. So, measured this way, inflation declined substantially when measured by the CPI including prices of all goods and services but only slightly when measured using core CPI.

The 12-month inflation rate is the one typically reported in the Wall Street Journal and elsewhere, but it has the drawback that it doesn’t always reflect accurately the current trend in prices. The following figure shows the 1-month inflation rate—that is the annual inflation rate calculated by compounding the current month’s rate over an entire year— for CPI and core CPI. The 1-month inflation rate is naturally more volatile than the 12-month inflation rate. In this case, 1-month rate shows a sharp decline in the inflation rate for the CPI from 4.9 percent in September to 0.5 percent in October. Core inflation declined less sharply from 3.9 percent in September to 2.8 percent in October.

The release of the CPI report was treated as good news on Wall Street, with the Dow Jones Industrial Average increasing by 500 points and the interest rate on the 10-year U.S. Treasury Note declining from 4.6 percent just before the report was released to 4.4 percent immediately after. The increases in stock and bond prices (recall that the prices of bonds and the yields on the bonds move in opposite directions, so bond prices rose following release of the report) reflect the view of financial investors that if the FOMC stops increasing its target for the federal funds rate, the chance that the U.S. economy will fall into a recession is reduced.

A word of caution, however. In a speech on November 9, Fed Chair Jerome Powell noted that the FOMC may need still need to implement additional increases to its federal funds rate target:

“My colleagues and I are gratified by this progress [against inflation] but expect that the process of getting inflation sustainably down to 2 percent has a long way to go…. The Federal Open Market Committee (FOMC) is committed to achieving a stance of monetary policy that is sufficiently restrictive to bring inflation down to 2 percent over time; we are not confident that we have achieved such a stance. We know that ongoing progress toward our 2 percent goal is not assured: Inflation has given us a few head fakes. If it becomes appropriate to tighten policy further, we will not hesitate to do so.”

So, while the latest inflation report is good news, it’s still too early to know whether inflation is on a stable path to return to the Fed’s 2 percent target. (It’s worth noting that the Fed uses inflation as measured by the personal consumption expenditure (PCE) price index rather than as measured by the CPI when evaluating whether it has achieved its 2 percent target.)

Glenn, Harry Holzer, and Michael Strain Analyze the Effect of Changes in Unemployment Benefits during the Pandemic

A job fair in Jackson, Mississippi (photo from the Associated Press)

As part of the Social Security Act of 1935,Congress created the unemployment insurance program to make payments to unemployed workers. The program run jointly by the federal government and the state governments. It’s financed primarily by state and federal taxes on employers. States are allowed to determine which workers are eligible, the dollar amount of the unemployment benefit workers will receive, and for how long workers will receive the benefit. 

 What’s the purpose of the unemployment insurance program? A document published the U.S. Department of Labor explains that: “Unemployment compensation is a social insurance program. It is designed to provide benefits to most individuals out of work, generally through no fault of their own, for periods between jobs…. [Unemployment compensation] ensures that a significant proportion of the necessities of life can be met on a week-to-week basis while a search for work takes place.”

But the same document also notes that unemployment compensation “maintains [unemployed workers’] purchasing power which also acts as an economic stabilizer in times of economic downturn.” By “economic stabilizer,” the Department of Labor is noting that unemployment compensation is what in Macroeconomics, Chapter 16, Section 16.1 (Economics, Chapter 26, Section 26.1) we call an automatic stabilizer. An automatic stabilizer is a government spending or taxing program that automatically increases or decreases along with the business cycle.  

As shown in the following figure, when the economy enters a recession, the total amount of unemployment compensation payments increases without the federal government or the state governments having to take any action because eligibility for the payments is already defined in existing law. So, during a recession, the unemployment insurance program helps to keep aggregate demand higher than it would otherwise be, which can lessen the severity of the recession.  

As we discuss in Macroeconomics, Chapter 9, Section 9.3 (Economics, Chapter 19, Section 19.3), the unemployment insurance program can have an unintended effect. The higher the unemployment insurance payment a worker receives and the longer the worker receives it, the more likely the worker is to delay searching for another job. In other words, by reducing the opportunity cost of being unemployed, unemployment insurance benefits may unintentionally increase the length of unemployment spells—the amount of time the typical worker is unemployed. 

During and immediately after the 2020 recession, the federal government increased the dollar amount of the unemployment insurance payments that workers received and extended the number of months workers could continue to receive these payments.  Under the American Rescue Plan, a law which President Biden proposed and Congress passed in March 2021, workers receiving unemployment insurance benefits received an additional $300 weekly from March 2021 until September 6, 2021. Also, under the law, people, such as the self-employed and gig workers, would receive unemployment insurance benefits even though they had previously been ineligible to receive them. (Note the resulting spike during this period in the total dollar amount of unemployment insurance benefits as shown in the above figure.)

Some state governments were concerned that the extended benefits might cause some workers to delay taking jobs, thereby slowing the recovery of these states’ economies from the effects of the pandemic. Accordingly, 18 states stopped participating in the programs in June 2021, meaning that at that time unemployed workers would no longer receive the extra $300 per week and workers who prior to March 2021 hadn’t been eligible to receive unemployment benefits would again be ineligible.

Were unemployed workers in the states that ended the expanded unemployment insurance benefits in June more likely to become employed than were unemployed workers in states that continued the expanded benefits into September? On the one hand, ending the expanded benefits would increase the opportunity cost of not having a job. But, on the other hand, because government payments to workers would decline in these states, the result could be a decline in consumer spending that would decrease the demand for labor.  Which of these effects was larger would determine whether employment increased or decreased in the states that ended expanded unemployment benefits early.

Glenn, along with Harry Holzer of Georgetown University and Michael Strain of the American Enterprise Institute, carried out an econometric analysis to explore the effects ending expanded unemployment benefits early had on the labor markets in those states.  They find that:

  1. Among unemployed workers ages 25 to 54 (“prime-age workers”), ending the expanded unemployment benefit program increased the number of workers in those states who moved from being unemployed to being employed by 14 percentage points.
  2. Among prime-age workers, the employment-to-population ratio in those states increased by about 1 percentage point.
  3. Among prime-age workers, the unemployment rate in those stated decreased by about 0.9 percentage point.

These estimates indicate that the effect of ending the expanded unemployment benefit program raised the opportunity cost of being unemployed more than it decreased the demand for labor by reducing the incomes of some household. But what about the larger question of whether households were made better or worse off as a result of ending the program early? The authors find that ending the program early decreased the share of households that had no difficulty meeting expenses. They, therefore, conclude that the effects on household well-being of ending the program early are ambiguous. 

The paper presenting these results can be found here. Warning! The econometric analysis is quite technical.

A Review of Recent Macro Data

Some interesting macro data were released during the past two weeks. On the key issues, the data indicate that inflation continues to run in the range of 3.0 percent to 3.5 percent, although depending on which series you focus on, you could conclude that inflation has dropped to a bit below 3 percent or that it is still in vicinity of 4 percent.  On balance, output and employment data seem to be indicating that the economy may be cooling in response to the contractionary monetary policy that the Federal Open Market Committee began implementing in March 2022.

We can summarize the key data releases.

Employment, Unemployment, and Wages

On Friday morning, the Bureau of Labor Statistics (BLS) released its Employment Situation report. (The full report can be found here.) Economists and policymakers—notably including the members of the Federal Reserve’s Federal Open Market Committee (FOMC)—typically focus on the change in total nonfarm payroll employment as recorded in the establishment, or payroll, survey. That number gives what is generally considered to be the best indicator of the current state of the labor market.

The previous month’s report included a surprisingly strong net increase of 336,000 jobs during September. Economists surveyed by the Wall Street Journal last week forecast that the net increase in jobs in October would decline to 170,000. The number came in at 150,000, slightly below that estimate. In addition, the BLS revised down the initial estimates of employment growth in August and September by a 101,000 jobs. The figure below shows the net gain in jobs for each  month of 2023.

Although there are substantial fluctuations, employment increases have slowed in the second half of the year. The average increase in employment from January to June was 256,667. From July to October the average increase declined to 212,000. In the household survey, the unemployment rate ticked up from 3.8 percent in September to 3.9 percent in October. The unemployment rate has now increased by 0.5 percentage points from its low of 3.4 percent in April of this year. 

Finally, data in the employment report provides some evidence of a slowing in wage growth. The following figure shows wage inflation as measured by the percentage increase in average hourly earnings (AHE) from the same month in the previous year. The increase in October was 4.1 percent, continuing a generally downward trend since March 2022, although still somewhat above wage inflation during the pre-2020 period.

As the following figure shows, September growth in average hourly earnings measured as a compound annual growth rate was 2.5 percent, which—if sustained—would be consistent with a rate of price inflation in the range of the Fed’s 2 percent target.  (The figure shows only the months since January 2021 to avoid obscuring the values for recent months by including the very large monthly increases and decreases during 2020.)

Job Openings and Labor Turnover Survey (JOLTS) 

On November 1, the BLS released its Job Openings and Labor Turnover Survey (JOLTS) report for September 2023. (The full report can be found here.) The report indicated that the number of unfilled job openings was 9.5 million, well below the peak of 11.8 million job openings in December 2021 but—as shown in the following figure—well above prepandemic levels.

The following figure shows the ratio of the number of job opening to the number of unemployed people. The figure shows that, after peaking at 2.0 job openings per unemployed person in in March 2022, the ratio has decline to 1.5 job opening per unemployed person in September 2022. While high, that ratio was much closer to the ratio of 1.2 that prevailed during the year before the pandemic. In other words, while the labor market still appears to be strong, it has weakened somewhat in recent months.

Employment Cost Index

As we note in this blog post, the employment cost index (ECI), published quarterly by the BLS, measures the cost to employers per employee hour worked and can be a better measure than AHE of the labor costs employers face. The BLS released its most recent report on October 31. (The report can be found here.) The first figure shows the percentage change in ECI from the same quarter in the previous year. The second figure shows the compound annual growth rate of the ECI. Both measures show a general downward trend in the growth of labor costs, although compound annual rate of change shows an uptick in the third quarter of 2023. (We look at wages and salaries rather than total compensation because non-wage and salary compensation can be subject to fluctuations unrelated to underlying trends in labor costs.)

The Federal Open Market Committee’s October 31-November 1 Meeting

As was widely expected from indications in recent statements by committee members, the Federal Open Market Committee voted at its most recent meeting to hold constant its targe range for the federal funds rate at 5.25 percent to 5.50 percent. (The FOMC’s statement can be found here.)

At a press conference following the meeting, Fed Chair Jerome Powell remarks made it seem unlikely that the FOMC would raise its target for the federal funds rate at its December 14-15 meeting—the last meeting of 2023. But Powell also noted that the committee was unlikely to reduce its target for the federal funds rate in the near future (as some economists and financial jounalists had speculated): “The fact is the Committee is not thinking about rate cuts right now at all. We’re not talking about rate cuts, we’re still very focused on the first question, which is: have we achieved a stance of monetary policy that’s sufficiently restrictive to bring inflation down to 2 percent over time, sustainably?” (The transcript of Powell’s press conference can be found here.)

Investors in the bond market reacted to Powell’s press conference by pushing down the interest rate on the 10-year Treasury note, as shown in the following figure. (Note that the figure gives daily values with the gaps representing days on which the bond market was closed) The interest rate on the Treasury note reflects investors expectations of future short-term interest rates (as well as other factors). Investors interpreted Powell’s remarks as indicating that short-term rates may be somewhat lower than they had previously expected.

Real GDP and the Atlanta Fed’s Real GDPNow Estimate for the Fourth Quarter

On October 26, the Bureau of Economic Analysis (BEA) released its advance estimate of real GDP for the third quarter of 2023. (The full report can be found here.) We discussed the report in this recent blog post. Although, as we note in that post, the estimated increase in real GDP of 4.9 percent is quite strong, there are indications that real GDP may be growing significantly more slowly during the current (fourth) quarter.

The Federal Reserve Bank of Atlanta compiles a forecast of real GDP called GDPNow. The GDPNow forecast uses data that are released monthly on 13 components of GDP. This method allows economists at the Atlanta Fed to issue forecasts of real GDP well in advance of the BEA’s estimates. On November 1, the GDPNow forecast was that real GDP in the fourth quarter of 2023 would increase at a slow rate of 1.2 percent. If this preliminary estimate proves to be accurate, the growth rate of the U.S. economy will have sharply declined from the third to the fourth quarter.

Fed Chair Powell has indicated that economic growth will likely need to slow if the inflation rate is to fall back to the target rate of 2 percent. The hope, of course, is that contractionary monetary policy doesn’t cause aggregate demand growth to slow to the point that the economy slips into a recession.

Very Strong GDP Report

Photo from Lena Buonanno

This morning the Bureau of Economic Analysis (BEA) released its advance estimate of GDP for the third quarter of 2023. (The report can be found here.) The BEA estimates that real GDP increased by 4.9 percent at an annual rate in the third quarter—July through September. That was more than double the 2.1 percent increase in real GDP in the second quarter, and slightly higher than the 4.7 percent that economists surveyed by the Wall Street Journal last week had expected. The following figure shows the rates of GDP growth each quarter beginning in 2021.

Note that the BEA’s most recent estimates of real GDP during the first two quarters of 2022 still show a decline. The Federal Reserve’s Federal Open Market Committee only switched from a strongly expansionary monetary policy, with a target for the federal funds of effectively zero, to a contractionary monetary policy following its March 16, 2022 meeting. That real GDP was declining even before the Fed had pivoted to a contractionary monetary policy helps explain why, despite strong increases employment during this period, most economists were expecting that the U.S. economy would experience a recession at some point during 2022 or 2023. This expectation was reinforced when inflation soared during the summer of 2022 and it became clear that the FOMC would have to substantially raise its target for the federal funds rate.

Clearly, today’s data on real GDP growth, along with the strong September employment report (which we discuss in this blog post), indicates that the chances of the U.S. economy avoiding a recession in the future have increased and are much better than they seemed at this time last year.

Consumer spending was the largest contributor to third quarter GDP growth. The following figure shows growth rates of real personal consumption expenditures and the subcategories of expenditures on durable goods, nondurable goods, and services. There was strong growth in each component of consumption spending. The 7.6 percent increase in expenditures on durables was particularly strong, particularly given that spending on durables had fallen by 0.3 percent in the second quarter.

Investment spending and its components were a more mixed bag, as shown in the following figure. Overall, gross private domestic investment increased at a very strong rate of 8.4 percent—the highest rate since the fourth quarter of 2021. Residential investment increased 3.9 percent, which was particularly notable following nine consecutive quarters of decline and during a period of soaring mortgage interest rates. But business fixed investment was noticeably weak, falling by 0.1 percent. Spending on structures—such as factories and office buildings—increased by only 1.6 percent, while spending on equipment fell by 3.8 percent.

Today’s real GDP report also contained data on the private consumption expenditure (PCE) price index, which the FOMC uses tp determine whether it is achieving its goal of a 2 percent inflation rate. The following figure shows inflation as measured using the PCE and the core PCE—which excludes food and energy prices—since the beginning of 2015. (Note that these inflation rates are measured using quarterly data and as compound annual rates of change.) Despite the strong growth in real GDP and employment, inflation as measured by PCE increased only from 2.5 percent in the second quarter to 2.9 percent in the third quarter. Core PCE, which may be a better indicator of the likely course of inflation in the future, continued the long decline that began in first quarter of 2022 by failling from 3.7 percent to 2.9 percent.

The combination of strong growth in real GDP and declining inflation indicates that the Fed appears well on its way to a soft landing—achieving  a return to its 2 percent inflation target without pushing the economy into a recession. There are reasons to be cautious, however.

GDP, inflation, and employment data are all subject to—possibly substantial—revisions. So growth may have been significantly slower than today’s advance estimate of real GDP indicates. Even if the estimate of real GDP growth of 4.9 percent proves in the long run to have been accurate, there are reasons to doubt whether output growth can be maintained at near that level. Since 2000, annual growth in real GDP has average only 2.1 percent. For GDP to begin increasing at a rate substantially higher than that would require a significant expansion in the labor force and an increase in productivity. While either or both of those changes may occur, they don’t seem likely as of now.

In addition, the largest contributor to GDP growth in the third quarter was from consumption expenditures. As households continue to draw down the savings they built up as a result of the federal government’s response to the Covid recession of 2020, it seems unlikely that the current pace of consumer spending can be maintained. Finally, the lagged effects of monetary policy—particularly the effects of the interest rate on the 10-year Treasury note having risen to nearly 5 percent (which we discuss in our most recent podcast)—may substantially reduce growth in real GDP and employment in future quarters.

But those points shouldn’t distract from the fact that today’s GDP report was good news for the economy.

Surprisingly Strong Jobs Report

Photo from Lena Buonanno

When the Bureau of Labor Statistics’ Employment Situation report is released on the first Friday of each month economists and policymakers—notably including the members of the Federal Reserve’s Federal Open Market Committee (FOMC)—focus on the change in total nonfarm payroll employment as recorded in the establishment, or payroll, survey. That number gives what is generally considered to be the best indicator of the current state of the labor market. The most recent report showed a surprisingly strong net increase of 336,000 jobs during September. (The report can be found here.)

According to a survey by the Wall Street Journal, economists had been expecting an net increase in jobs of only 170,000. The larger than expected increase indicated that the economy might be expanding more rapidly than had been thought, raising the possibility that the FOMC might increase its target for the federal funds rate at least once more before the end of the year.

To meet increases in the growth of the U.S. working-age population, the economy needs to increase the total jobs available by approximately 80,000 jobs per month. A net increase of more than four times that amount may be an indication of an overheated job market. As always, one difficulty with drawing that conclusion is determing how many more people might be pulled into the labor market by a strong demand for workers. An increase in labor supply can potentially satisify an increase in labor demand without leading to an acceleration in wage growth and price inflation.

The following figure shows the employment-to-population ratio for workers ages 25 to 54—so-called prime-age workers—for the period since 1985. In September 2023, the ratio was 80.8 perccent, down slightly from 80.9 percent in August, but above the levels reached in early 2020 just before the effects of the Covid–19 pandemic were felt in the United States. The ratio was still below the record high of 81.9 percent reached in April 2000. The population of prime-age workers is about 128 million. So, if the employment-population ratio were to return to its 2000 peak, potentially another 1.3 million prime-age workers might enter the labor market. The likelihood of that happening, however, is difficult to gauge.

A couple of other points about the September employment report. First, it’s worth keeping in mind that the results from the establishment survey are subject to often substantial revisisons. The figure below shows the revisions the BLS has released as of October to their preliminary estimates for each month of 2023. In three of these eight months the revisions so far have been greater than 100,000 jobs. As we discuss in Macroeconomics, Chapter 9, Section 9.1 (Economics, Chapter 19, Section 19.1 and Essentials of Economics, Chapter 13, Section 13.1), the revisions that the BLS makes to its employment estimates are likely to be particularly large when the economy is about to enter a period of significantly lower or higher growth. So, the large revisions to the preliminary employment estimates in most months of 2023 may indicate that the surprisingly large preliminary estimate of a 336,000 increase in net employment will be revised lower in coming months.

Finally, data in the employment report provides some evidence of a slowing in wage growth, despite the sharp increase in employment. The following figure shows wage inflation as measured by the percentage increase in average hourly earnings (AHE) from the same month in the previous year. The increase in September was 4.2 percent, continuing a generally downward trend since March 2022, although still somewhat above wage inflation during the pre-2020 period.

As the following figure shows, September growth in average hourly earnings measured as a compound annual growth rate was 2.5 percent, which—if sustained—would be consistent with a rate of price inflation in the range of the Fed’s 2 percent target.  (The figure shows only the months since January 2021 to avoid obscuring the values for recent months by including the very large monthly increases and decrease during 2020.)

As we note in this blog post, the employment cost index (ECI), published quarterly by the BLS, measures the cost to employers per employee hour worked and can be a better measure than AHE of the labor costs employers face. The first figure shows the percentage change in ECI from the same quarter in the previous year. The second figure shows the compound annual growth rate of the ECI. Both measures show a general downward trend in the growth of labor costs, although the measures are somewhat dated because the most recent values are for the second quarter of 2023.

Ultimately, the key question is one we’ve considered in previous blog posts (most recently here) and podcasts (most recently here): Will the Fed be able to achieve a soft landing by bringing inflation down to its 2 percent target without triggering a recession? The September jobs report can be interpreted as increasing the probability of a soft landing if the slowing in wage growth is emphasized but decreasing the probability if the Fed decides that the strong employment growth is real—that is, the September increase is not likely to be revised sharply lower in coming months—and requires additional increases in the target for the federal funds rate. It’s worth mentioning, of course, that factors over which the Fed has no control, such as a federal government shutdown, rising oil prices, or uncertainty resulting from the attack on Israel by Hamas, will also affect the likelihood of a soft landing.

Inflation, Disinflation, Deflation, and Consumers’ Perceptions of Inflation

Inflation has declined, although many consumers are skeptical. What explains consumer skepticism? First we can look at what’s happened to inflation in the period since the beginning of 2015. The figure below shows inflation measured as the percentage change in the consumer price index (CPI) from the same month in the previous year. We show both so-called headline inflation, which includes the prices of all goods and services in the index, and core inflation, which excludes energy and food prices. Because energy and food prices can be volatile, most economists believe that the core inflation provides a better indication of underlying inflation. 

Both measures show inflation following a similar path. The inflation rate begins increasing rapidly in the spring of 2021, reaches a peak in the summer of 2022, and declines from there. Headline CPI peaks at 8.9 percent in June 2022 and declines to 3.7 percent in August 2023. Core inflation reaches a peak of 6.6 percent in September 2022 and declines to 4.4 percent in August 2022.

As we discuss in Macroeconomics, Chapter 15, Section 15.5 (Economics, Chapter 25, Section 25.5, and Essentials of Economics, Chapter 17, Section 17.5), the Fed’s inflation target is stated in terms of the personal consumption expenditure (PCE) price index, not the CPI. The PCE includes the prices of all the goods and services included in the consumption component of GDP. Because the PCE includes the prices of more goods and services than does the CPI, it’s a broader measure of inflation. The following figure shows inflation as measured by the PCE and by the core PCE, which excludes energy and food prices.

Inflation measured using the PCE or the core PCE shows the same pattern as inflation measured using the CPI: A sharp increase in inflation in the spring of 2021, a peak in the summer of 2022, and a decline thereafter.

Although it has yet to return to the Fed’s 2 percent target, the inflation rate has clearly fallen substantially during the past year. Yet surveys of consumers show that majorities are unconvinced that inflation has been declining. A Pew Research Center poll from June found that 65 percent of respondents believe that inflation is “a very big problem,” with another 27 percent believing that inflation is “a moderately big problem.” A Gallup poll from earlier in the year found that 67 percent of respondents thought that inflation would go up, while only 29 percent thought it would go down. Perhaps not too surprisingly, another Gallup poll found that only 4 percent of respondents had a “great deal” of confidence in Federal Reserve Chair Jerome Powell, with another 32 percent having a “fair amount” of confidence. Fifty-four percent had either “only a little” confidence in Powell or “almost none.”

There are a couple of reasons why most consumers might believe that the Fed is doing worse in its fight against inflation than the data indicate. First, few people follow the data releases as carefully as economists do. As a result, there can be a lag between developments in the economy—such as declining inflation—and when most people realize that the development has occurred.

Probably more important, though, is the fact that most people think of inflation as meaning “high prices” rather than “increasing prices.” Over the past year the U.S. economy has experienced disinflation—a decline in the inflation rate. But as long as the inflation rate is positive, the price level continues to increase. Only deflation—a declining price level—would lead to prices actually falling. And an inflation rate of 3 percent to 4 percent, although considerably lower than the rates in mid-2022, is still significantly higher than the inflation rates of 2 percent or below that prevailed during most of the time since 2008.

Although, core CPI and core PCE exclude energy and food prices, many consumers judge the state of inflation by what’s happening to gasoline prices and the price of food in supermarkets. These are products that consumers buy frequently, so they are particularly aware of their prices. The figure below shows the component of the CPI that represents the prices of food consumers buy in groceries or supermarkets and prepare at home. The price of food rose rapidly beginning in the spring of 2021. Althought increases in food prices leveled off beginning in early 2023, they were still about 24 percent higher than before the pandemic.

There is a similar story with respect to gasoline prices. Although the average price of gasoline in August 2023 at $3.84 per gallon is well below its peak of nearly $5.00 per gallon in June 2022, it is still well above average gasoline prices in the years leading up to the pandemic.

Finally, the figure below shows that while percentage increases in rent are below their peak, they are still well above the increases before and immediately after the recession of 2020. (Note that rents as included in the CPI include all rents, not just rental agreements that were entered into that month. Because many rental agreements, particularly for apartments in urban areas, are for one year or more, in any given month, rents as measured in the CPI may not accurately reflect what is currently happening in rental housing markets.)

Because consumers continue to pay prices that are much higher than the prices they were paying prior to the pandemic, many consider inflation to still be a problem. Which is to say, consumers appear to frequently equate inflation with high prices, even when the inflation rate has markedly declined and prices are increasing more slowly than they were.

Solved Problem: The Mexican “Super Peso”

A food market in Mexico. (Photo from mexperience.com)

Supports: Macroeconomics, Chapter 18, Economics, Chapter 28, and Essentials of Economics, Chapter 19.

In September 2023, an article in the Los Angeles Times discussed the effects on Mexico of the “’super-peso,’ as the Mexican currency has been dubbed since steadily gaining 18% on the dollar during the last 12 months.” The article focused on the effects of the rising value of the peso on people in Mexico who receive U.S. dollars from relatives and friends working in the United States. Many of the people who receive these payments rely on them to buy basic necessities, such as food and clothing. An article in the Wall Street Journal on the effects of the rising value of the peso noted that: “The peso’s strength has helped curtail inflation ….” 

  1. Briefly explain what the Los Angeles Times article means by the peso “gaining” on the U.S. dollar? Does the peso gaining on the dollar mean that someone exchanging dollars for pesos would receive more pesos or fewer pesos? 
  2. As a result of the rising value of the peso would people in Mexico receiving dollar payments from relatives in the United States be better off or worse off? Briefly explain. 
  3. Why would the increasing strength of the peso reduce the inflation rate in Mexico?
  4. The Los Angeles Times article also noted that: “The Bank of Mexico’s benchmark interest rate of 11.25% is more than double the U.S. Federal Reserve target …” Does this fact have anything to do with the increase in the value of the peso in exchange for the dollar? Briefly explain. 

Solving the Problem

Step 1:  Review the chapter material. This problem is about the effect of fluctuations in the exchange rate and the relationship between interest rates and exchange rates, so you may want to review Macroeconomics, Chapter 18, Section 8.2, “The Foreign Exchange Market and Exchange Rates,” or the corresponding sections in Economics, Chapter 28 or Essentials of Economics, Chapter 19.

Step 2: Answer part a. by explaining what it means for the peso to be “gaining” on the U.S. dollar. The peso gaining on the dollar means that someone can exchange fewer pesos to receive a dollar. Or, alternatively, someone exchanging dollars for pesos will receive fewer pesos. 

Step 3: Answer part b. by explaining why people in Mexico receiving dollar payments from relatives in the United States will be worse off because of the rising value of the peso. People living in Mexico needs pesos to buy food and clothing from Mexican stores. Because people will receive fewer pesos in exchange for the dollars they receive from relatives in the United States, these people will have been made worse off by the rising value of the peso. 

Step 4: Answer part c. by explaining why the increasing strength of the peso will reduce inflation in Mexico. A country’s inflation rate includes the prices of imported goods as well as the prices of domestically produced goods.  A stronger peso means that fewer pesos are needed to buy the same quantity of a foreign currency, which reduces the peso price of imports from that country. For example, a stronger peso reduces the number of pesos Mexican consumers pay to buy $10 worth of cucumbers imported from the United States. Falling prices of imported goods will reduce the inflation rate in Mexico. 

Step 5: Answer part d. by explaining why higher interest rates in Mexico relative to interest rates in the United States will increase the value of the peso in exchange for the U.S. dollar. If interest rates in Mexico rise relative to interest rates in the United States, Mexican financial assets, such as Mexican government bonds, will be more desirable, causing investors to increase their demand for the pesos they need to buy Mexican financial assets. The resulting shift to the right in the demand curve for pesos will cause the equilibrium exchange rate between the peso and the dollar to increase. 

Sources:  Patrick J. McDonnell, “Mexico’s Peso Is Soaring. That’s Bad News for People Who Rely on Dollars Sent from the U.S.,” Los Angeles Times, September 5, 2023; and Anthony Harrup, “Mexico’s Peso Surges to Strongest Level Since 2015,” Wall Street Journal, July 13, 2023.