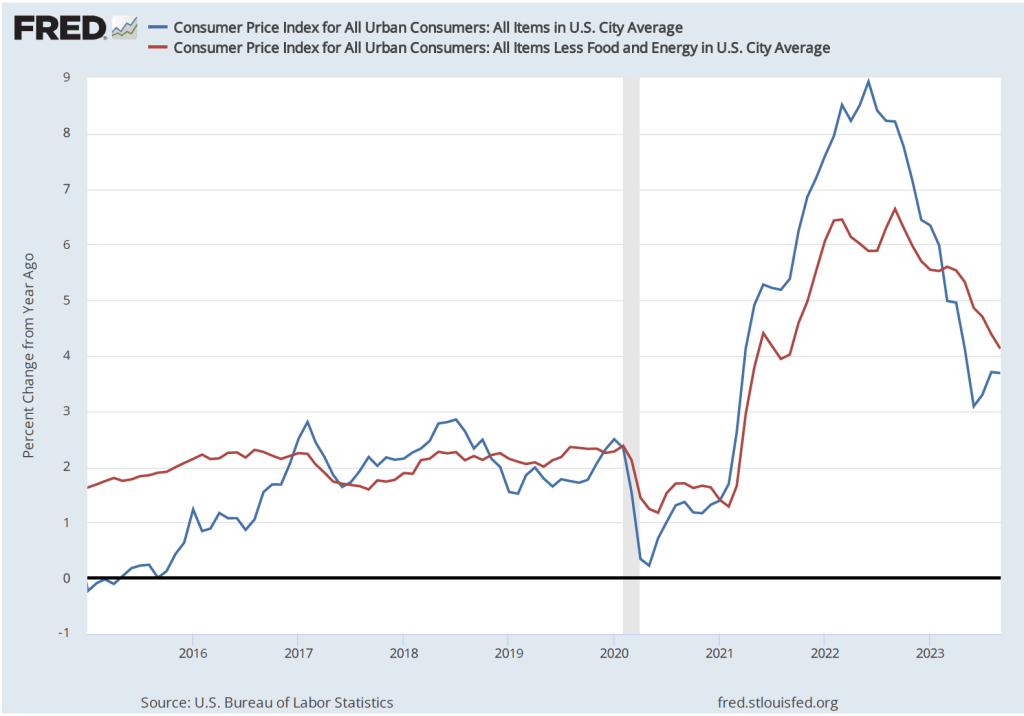
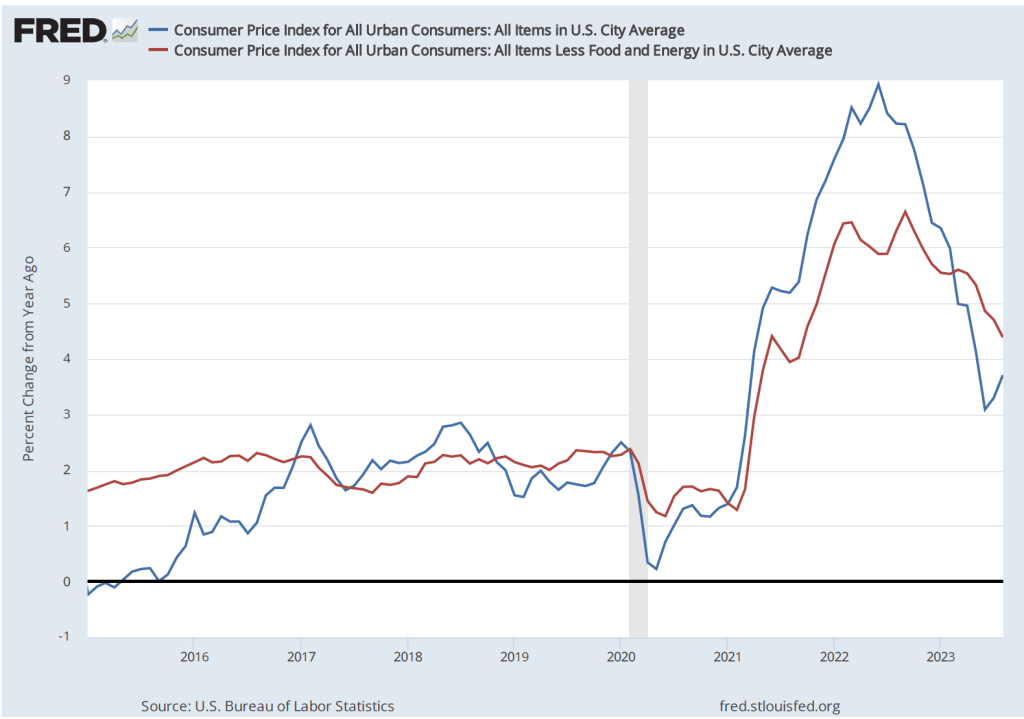
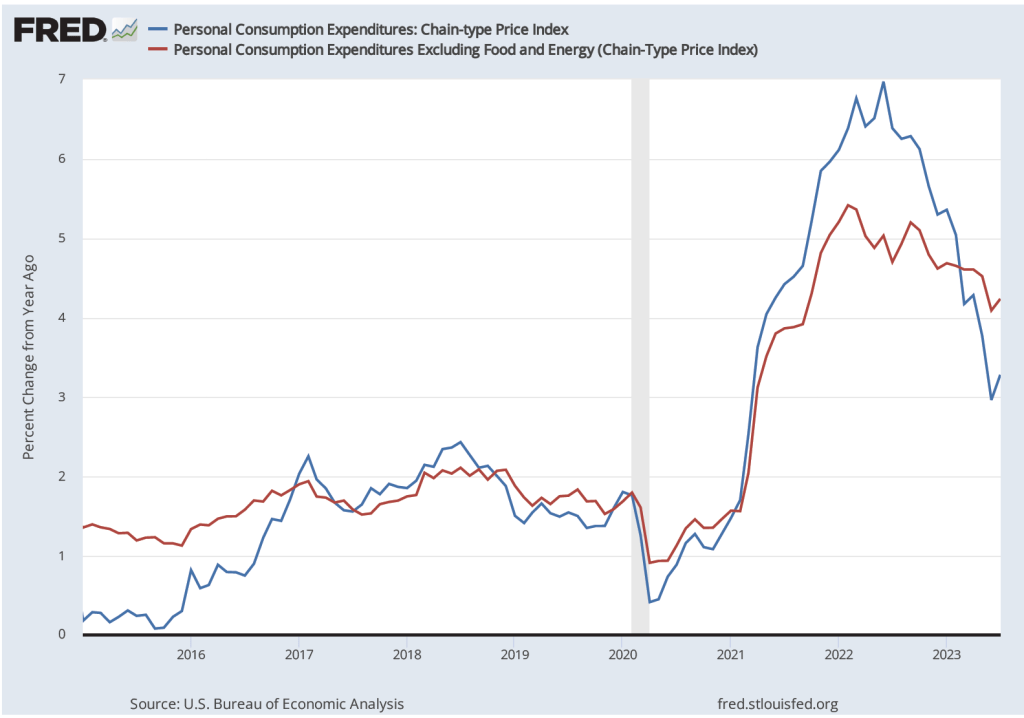
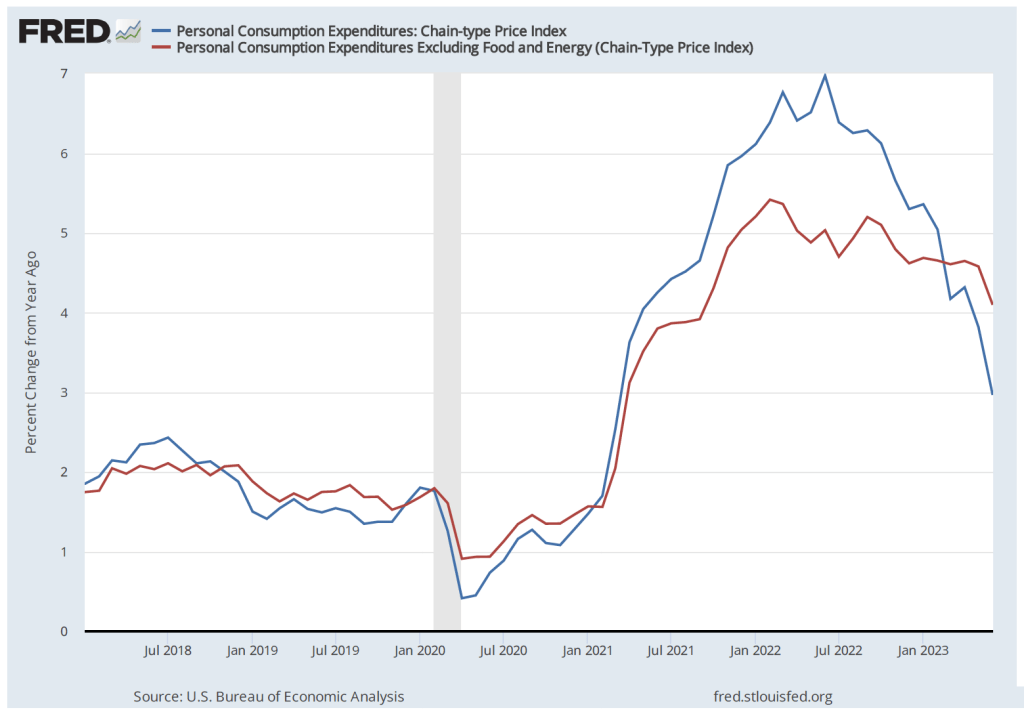
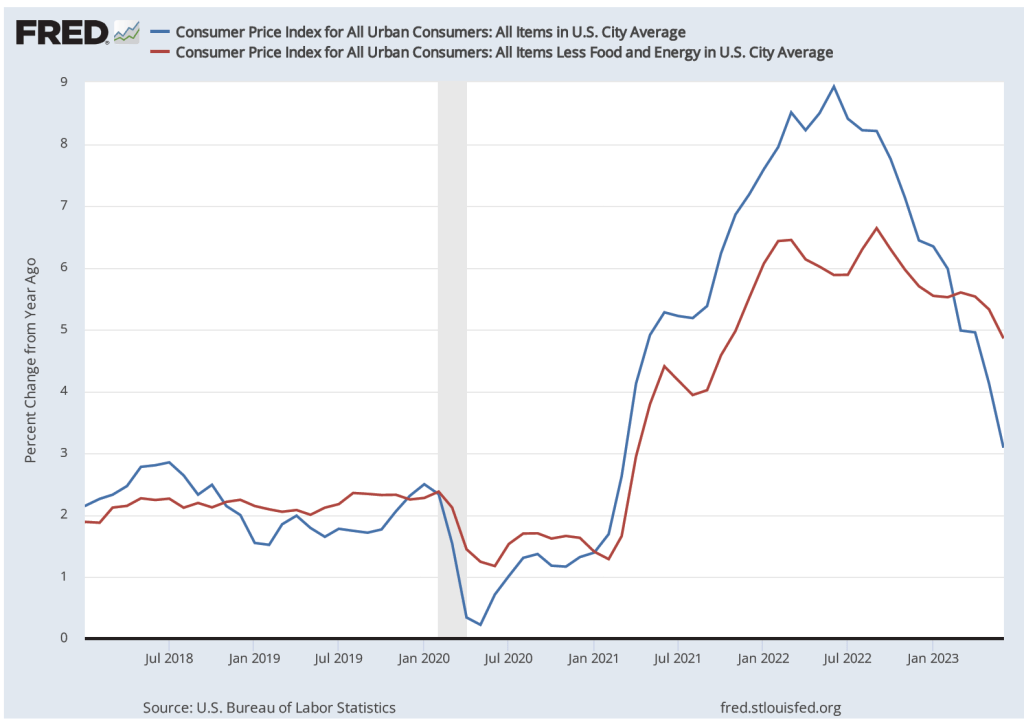
Some interesting macro data were released during the past two weeks. On the key issues, the data indicate that inflation continues to run in the range of 3.0 percent to 3.5 percent, although depending on which series you focus on, you could conclude that inflation has dropped to a bit below 3 percent or that it is still in vicinity of 4 percent. On balance, output and employment data seem to be indicating that the economy may be cooling in response to the contractionary monetary policy that the Federal Open Market Committee began implementing in March 2022.
We can summarize the key data releases.
Employment, Unemployment, and Wages
On Friday morning, the Bureau of Labor Statistics (BLS) released its Employment Situation report. (The full report can be found here.) Economists and policymakers—notably including the members of the Federal Reserve’s Federal Open Market Committee (FOMC)—typically focus on the change in total nonfarm payroll employment as recorded in the establishment, or payroll, survey. That number gives what is generally considered to be the best indicator of the current state of the labor market.
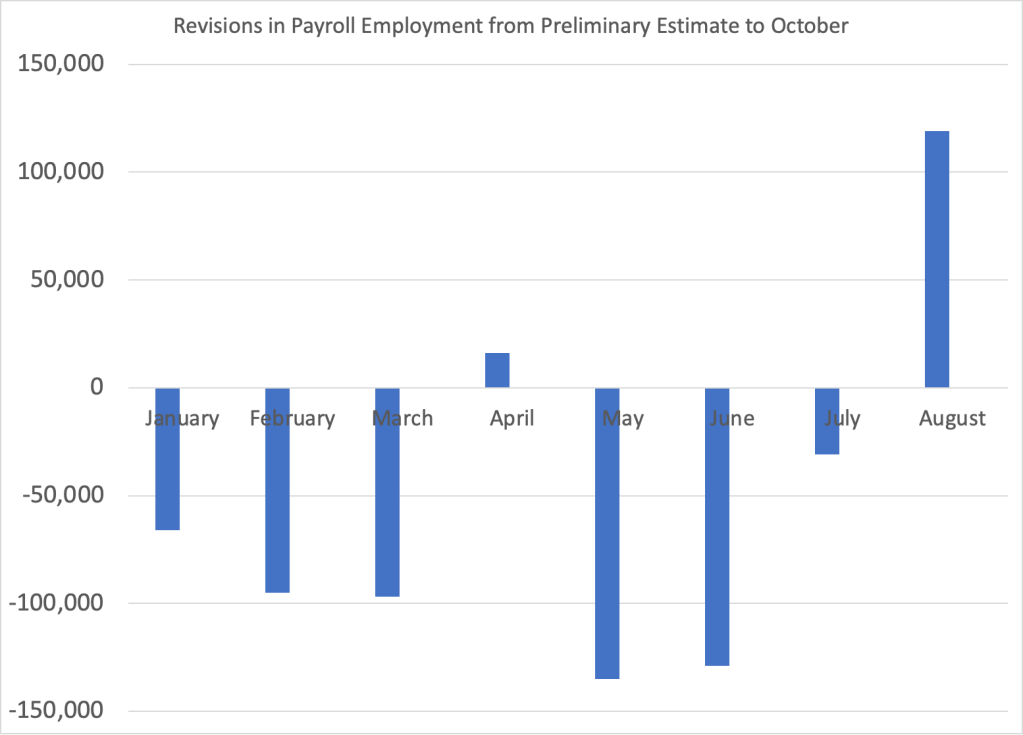
The previous month’s report included a surprisingly strong net increase of 336,000 jobs during September. Economists surveyed by the Wall Street Journal last week forecast that the net increase in jobs in October would decline to 170,000. The number came in at 150,000, slightly below that estimate. In addition, the BLS revised down the initial estimates of employment growth in August and September by a 101,000 jobs. The figure below shows the net gain in jobs for each month of 2023.

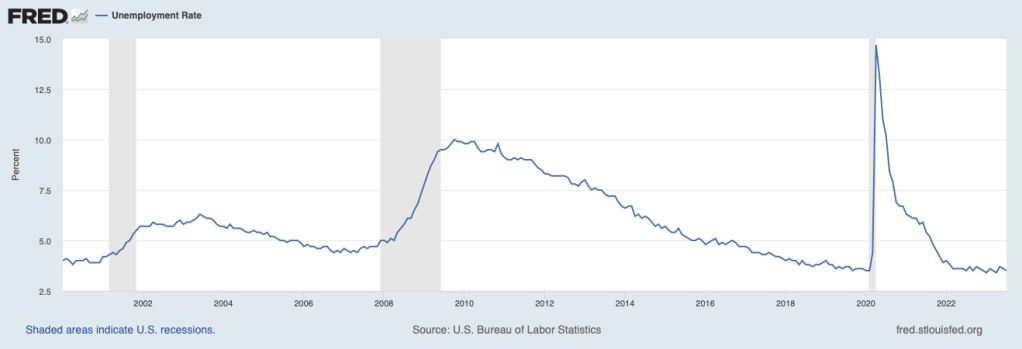
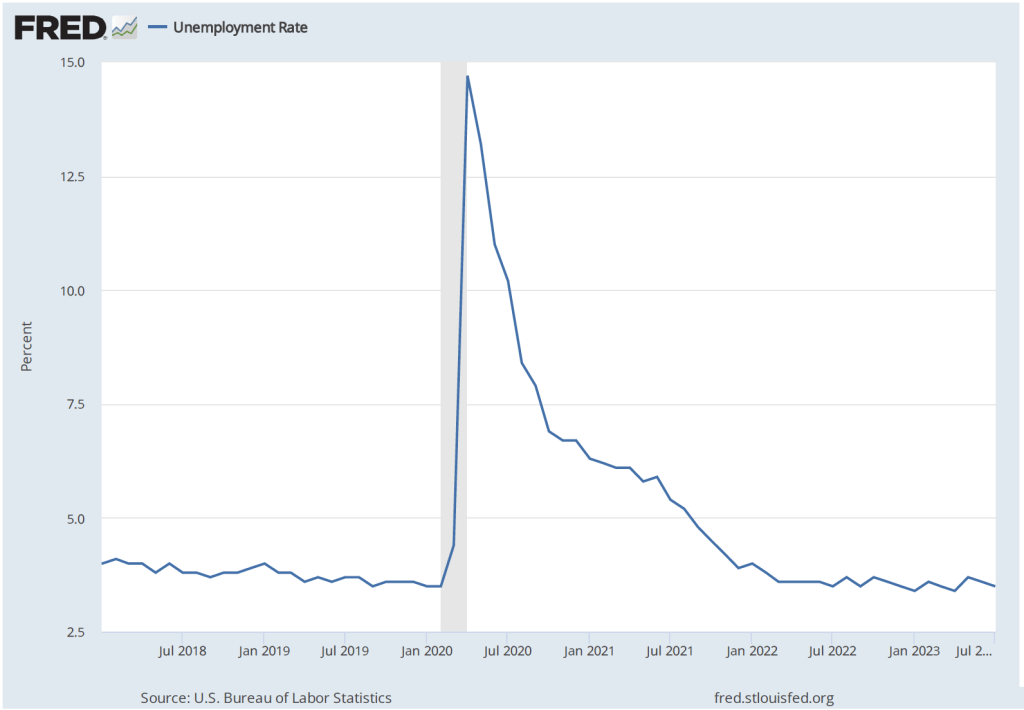
Although there are substantial fluctuations, employment increases have slowed in the second half of the year. The average increase in employment from January to June was 256,667. From July to October the average increase declined to 212,000. In the household survey, the unemployment rate ticked up from 3.8 percent in September to 3.9 percent in October. The unemployment rate has now increased by 0.5 percentage points from its low of 3.4 percent in April of this year.
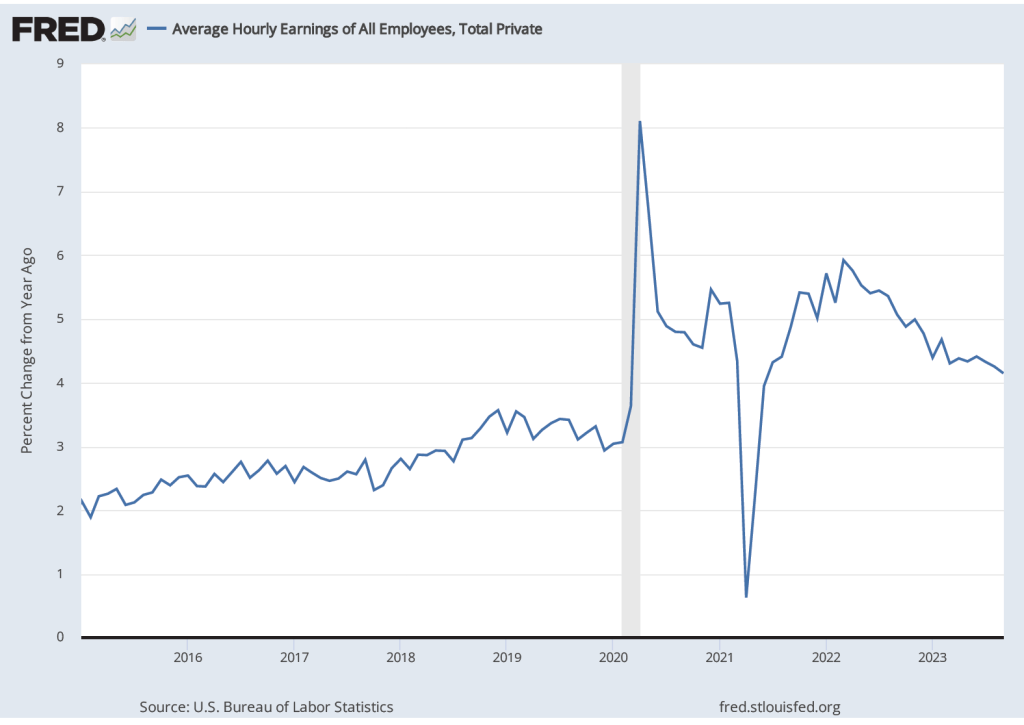
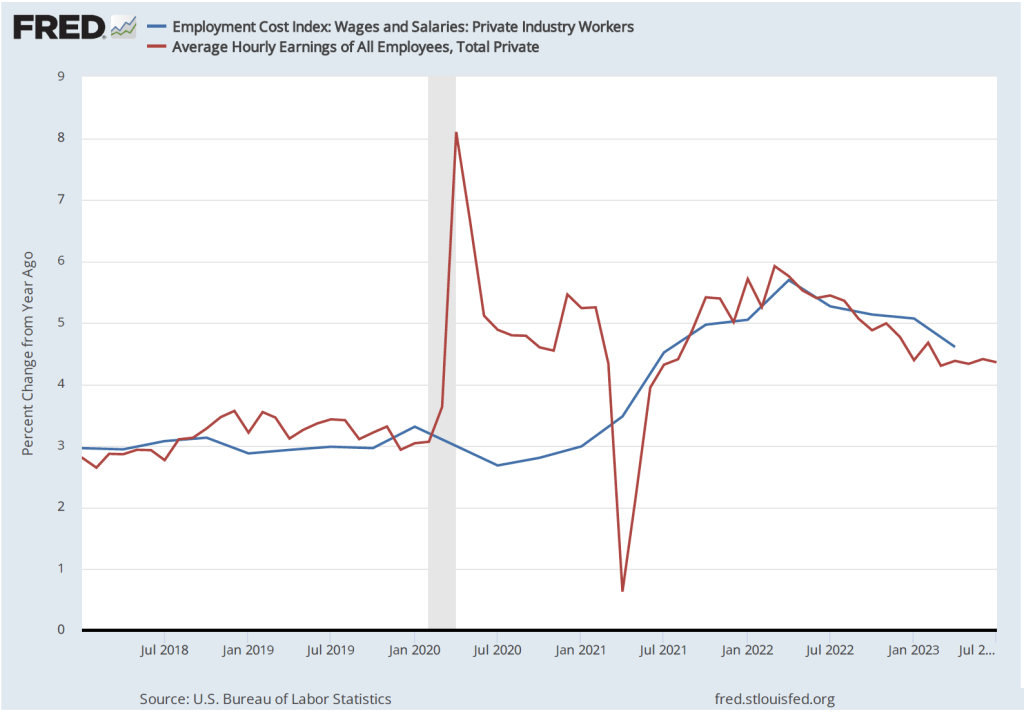
Finally, data in the employment report provides some evidence of a slowing in wage growth. The following figure shows wage inflation as measured by the percentage increase in average hourly earnings (AHE) from the same month in the previous year. The increase in October was 4.1 percent, continuing a generally downward trend since March 2022, although still somewhat above wage inflation during the pre-2020 period.

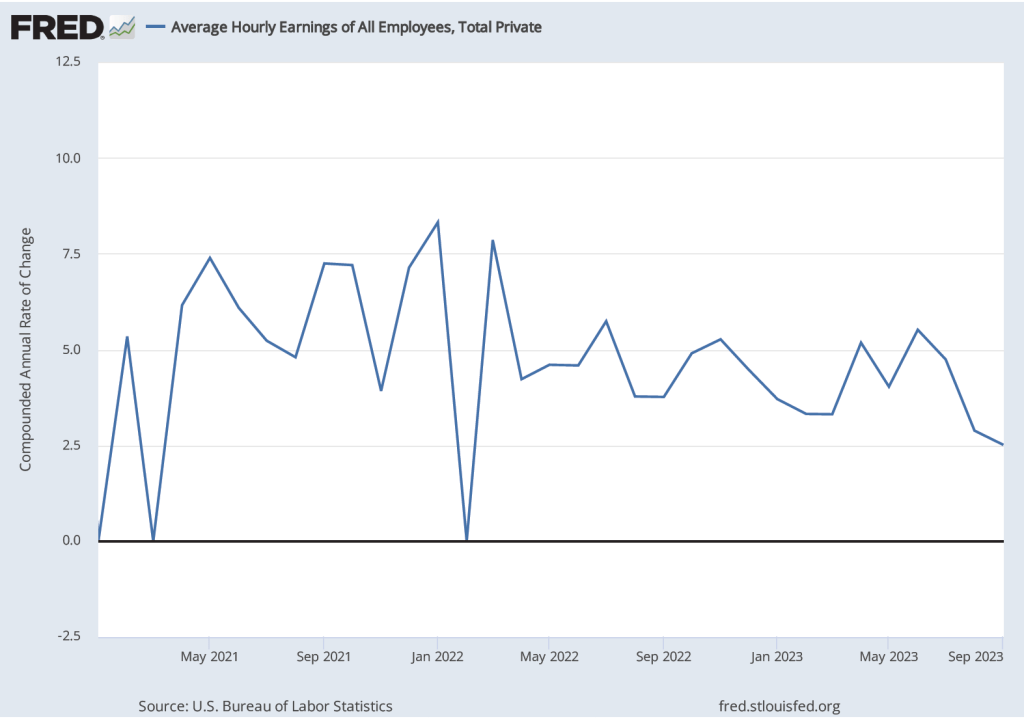
As the following figure shows, September growth in average hourly earnings measured as a compound annual growth rate was 2.5 percent, which—if sustained—would be consistent with a rate of price inflation in the range of the Fed’s 2 percent target. (The figure shows only the months since January 2021 to avoid obscuring the values for recent months by including the very large monthly increases and decreases during 2020.)

Job Openings and Labor Turnover Survey (JOLTS)
On November 1, the BLS released its Job Openings and Labor Turnover Survey (JOLTS) report for September 2023. (The full report can be found here.) The report indicated that the number of unfilled job openings was 9.5 million, well below the peak of 11.8 million job openings in December 2021 but—as shown in the following figure—well above prepandemic levels.

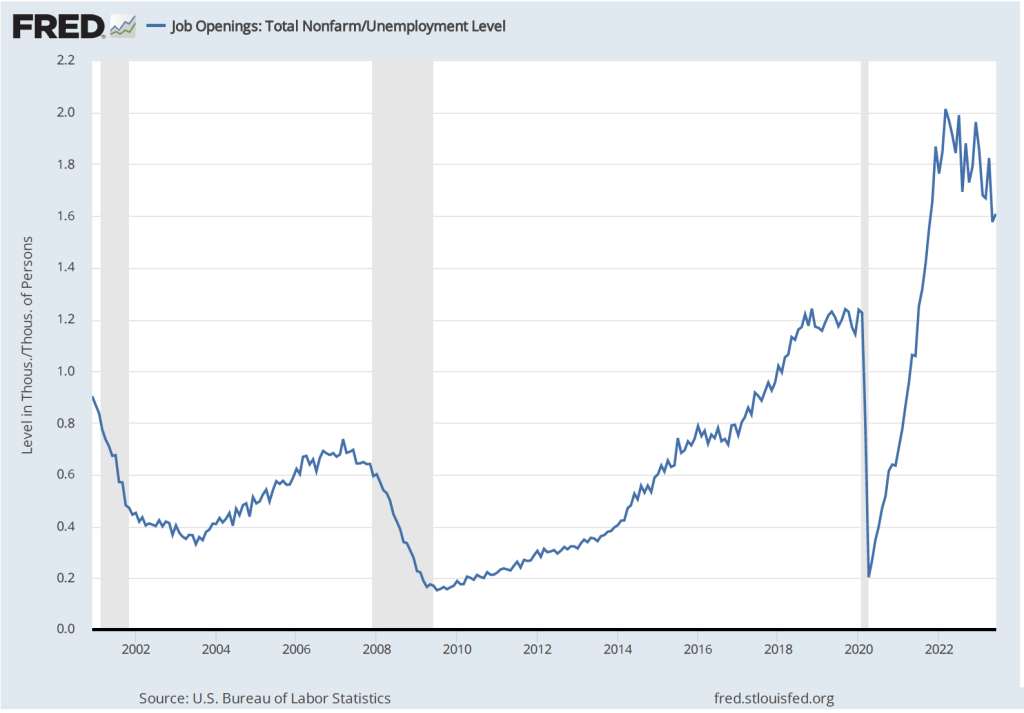
The following figure shows the ratio of the number of job opening to the number of unemployed people. The figure shows that, after peaking at 2.0 job openings per unemployed person in in March 2022, the ratio has decline to 1.5 job opening per unemployed person in September 2022. While high, that ratio was much closer to the ratio of 1.2 that prevailed during the year before the pandemic. In other words, while the labor market still appears to be strong, it has weakened somewhat in recent months.

Employment Cost Index
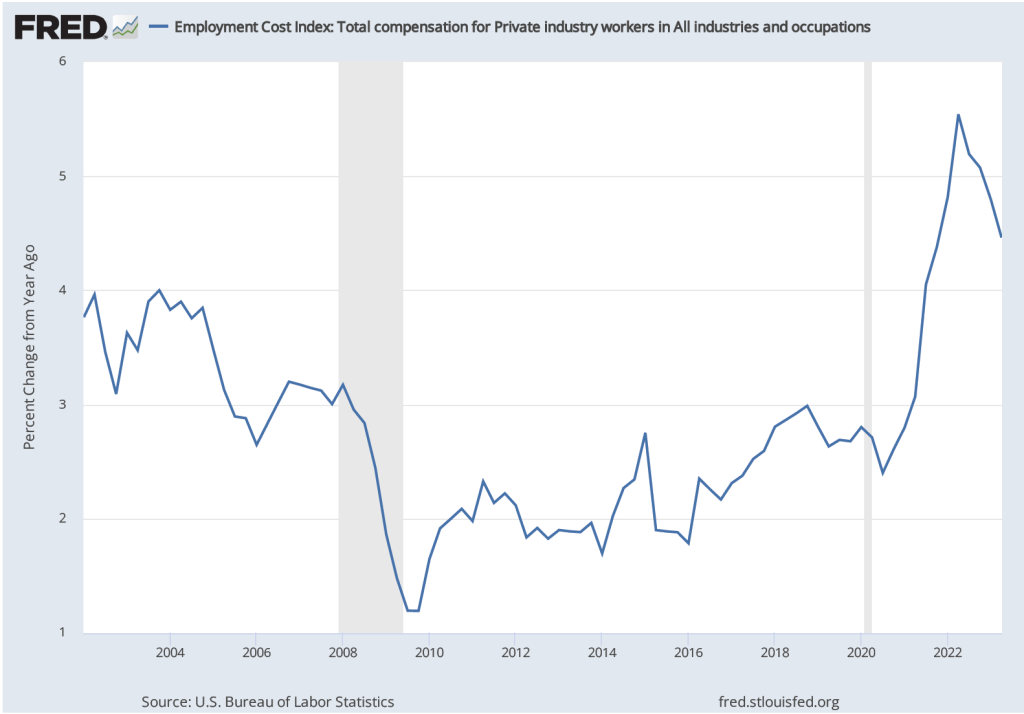
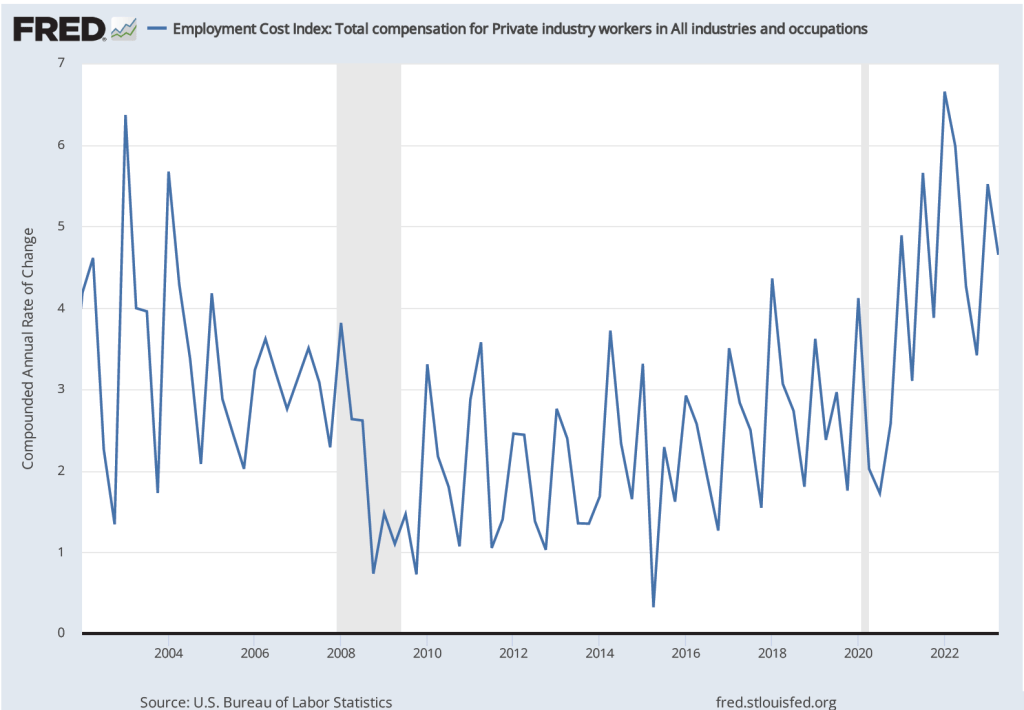
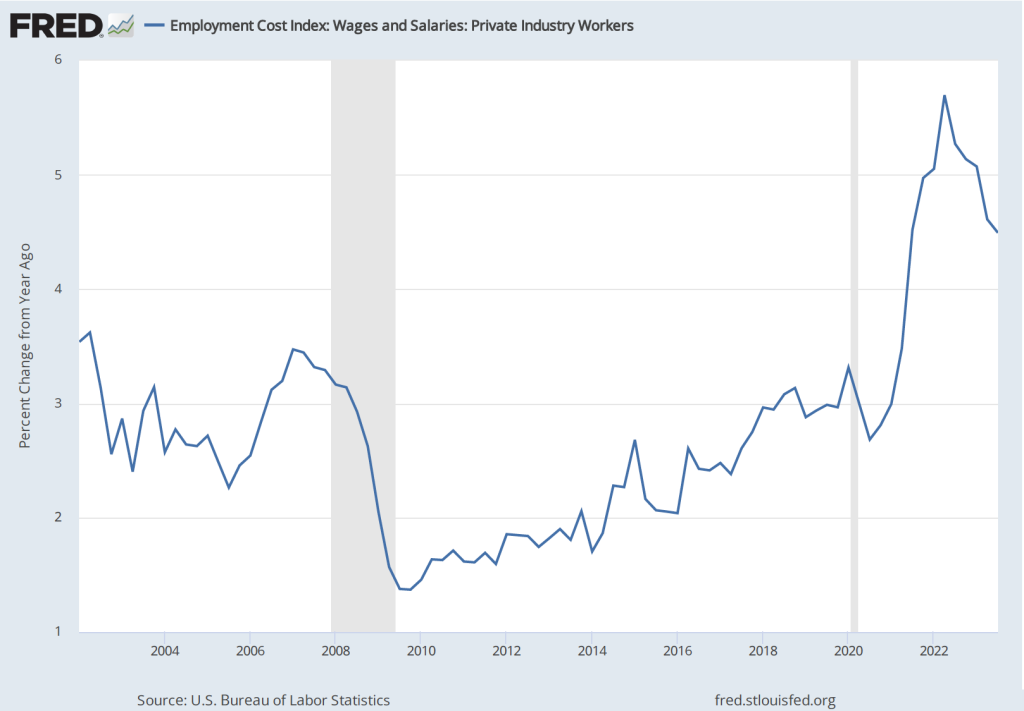
As we note in this blog post, the employment cost index (ECI), published quarterly by the BLS, measures the cost to employers per employee hour worked and can be a better measure than AHE of the labor costs employers face. The BLS released its most recent report on October 31. (The report can be found here.) The first figure shows the percentage change in ECI from the same quarter in the previous year. The second figure shows the compound annual growth rate of the ECI. Both measures show a general downward trend in the growth of labor costs, although compound annual rate of change shows an uptick in the third quarter of 2023. (We look at wages and salaries rather than total compensation because non-wage and salary compensation can be subject to fluctuations unrelated to underlying trends in labor costs.)

The Federal Open Market Committee’s October 31-November 1 Meeting
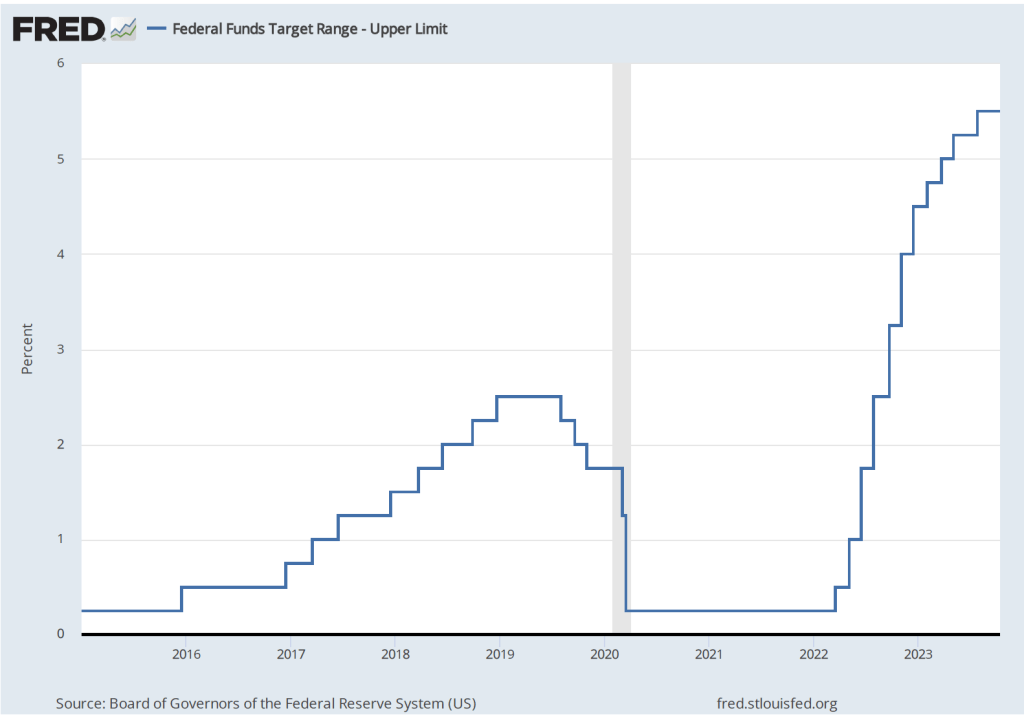
As was widely expected from indications in recent statements by committee members, the Federal Open Market Committee voted at its most recent meeting to hold constant its targe range for the federal funds rate at 5.25 percent to 5.50 percent. (The FOMC’s statement can be found here.)
At a press conference following the meeting, Fed Chair Jerome Powell remarks made it seem unlikely that the FOMC would raise its target for the federal funds rate at its December 14-15 meeting—the last meeting of 2023. But Powell also noted that the committee was unlikely to reduce its target for the federal funds rate in the near future (as some economists and financial jounalists had speculated): “The fact is the Committee is not thinking about rate cuts right now at all. We’re not talking about rate cuts, we’re still very focused on the first question, which is: have we achieved a stance of monetary policy that’s sufficiently restrictive to bring inflation down to 2 percent over time, sustainably?” (The transcript of Powell’s press conference can be found here.)
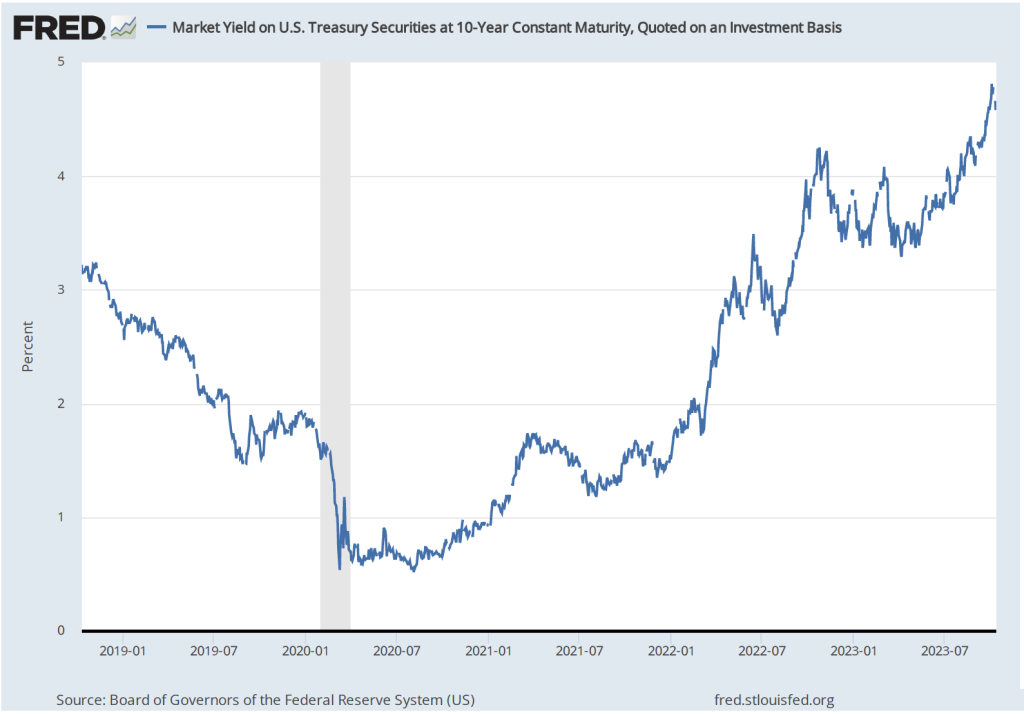
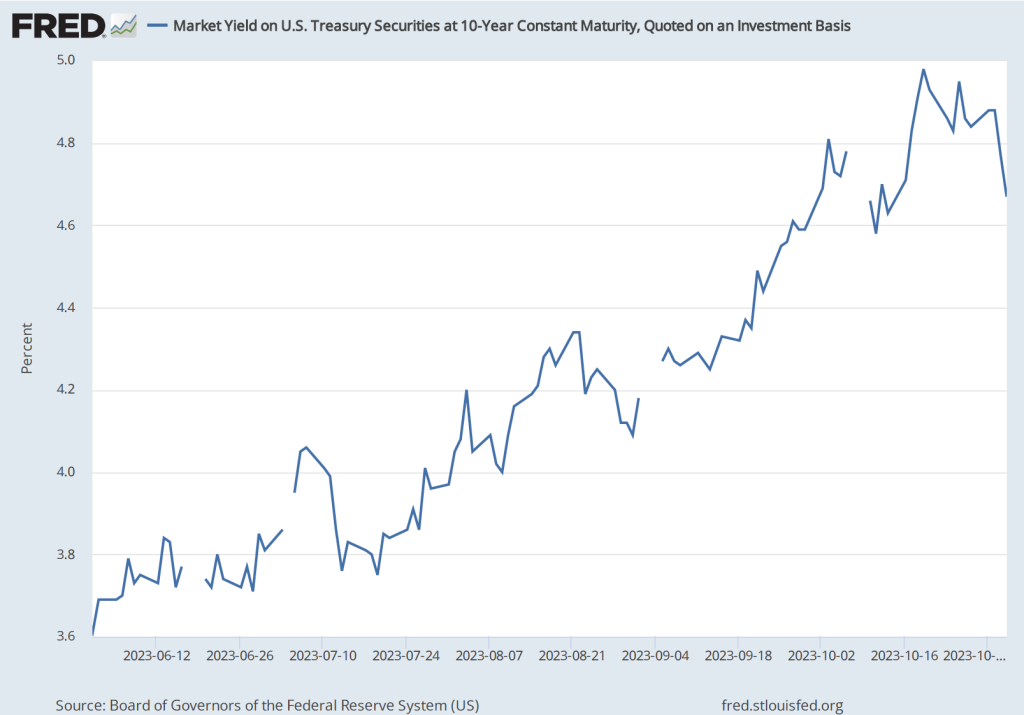
Investors in the bond market reacted to Powell’s press conference by pushing down the interest rate on the 10-year Treasury note, as shown in the following figure. (Note that the figure gives daily values with the gaps representing days on which the bond market was closed) The interest rate on the Treasury note reflects investors expectations of future short-term interest rates (as well as other factors). Investors interpreted Powell’s remarks as indicating that short-term rates may be somewhat lower than they had previously expected.
Real GDP and the Atlanta Fed’s Real GDPNow Estimate for the Fourth Quarter
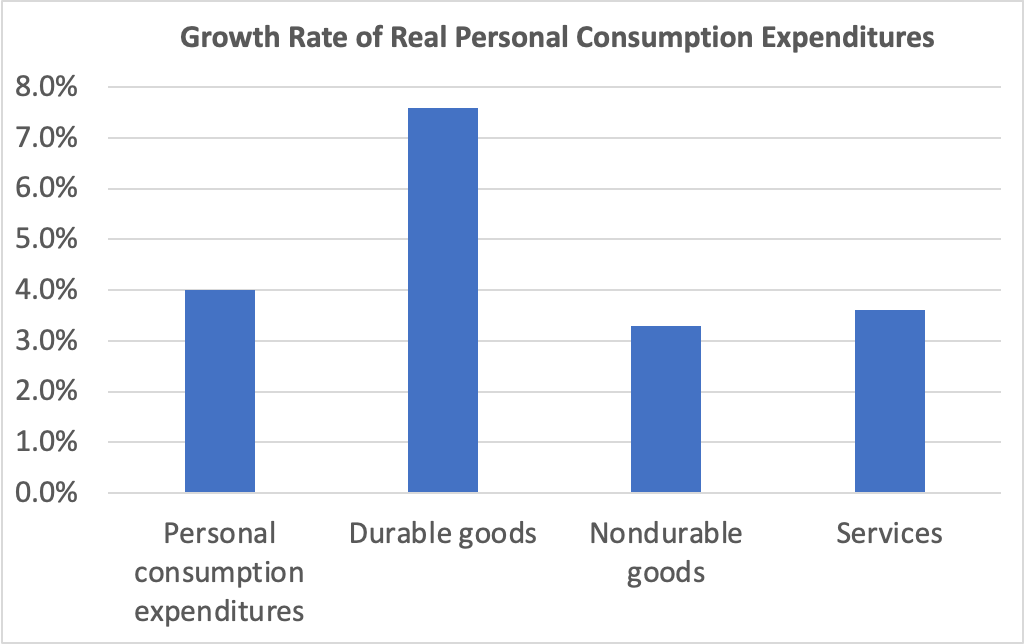
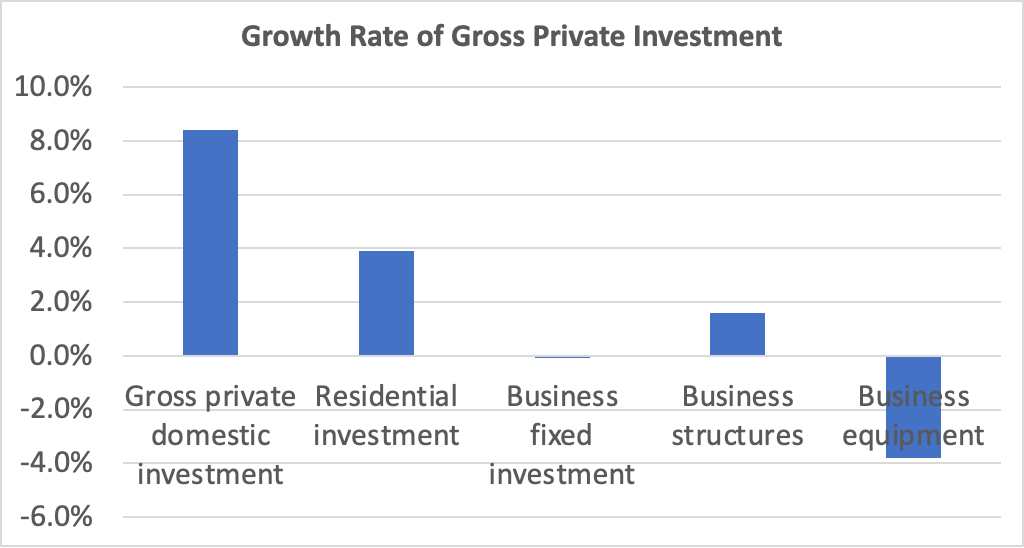
On October 26, the Bureau of Economic Analysis (BEA) released its advance estimate of real GDP for the third quarter of 2023. (The full report can be found here.) We discussed the report in this recent blog post. Although, as we note in that post, the estimated increase in real GDP of 4.9 percent is quite strong, there are indications that real GDP may be growing significantly more slowly during the current (fourth) quarter.
The Federal Reserve Bank of Atlanta compiles a forecast of real GDP called GDPNow. The GDPNow forecast uses data that are released monthly on 13 components of GDP. This method allows economists at the Atlanta Fed to issue forecasts of real GDP well in advance of the BEA’s estimates. On November 1, the GDPNow forecast was that real GDP in the fourth quarter of 2023 would increase at a slow rate of 1.2 percent. If this preliminary estimate proves to be accurate, the growth rate of the U.S. economy will have sharply declined from the third to the fourth quarter.
Fed Chair Powell has indicated that economic growth will likely need to slow if the inflation rate is to fall back to the target rate of 2 percent. The hope, of course, is that contractionary monetary policy doesn’t cause aggregate demand growth to slow to the point that the economy slips into a recession.