The Price Elasticity of Demand for Subway and Bus Rides

Supports: Microeconomics, Chapter 6, Section 6.3, Economics, Chapter 6, Section 6.3, and Essentials of Economics, Chapter 7, Section 7.7.
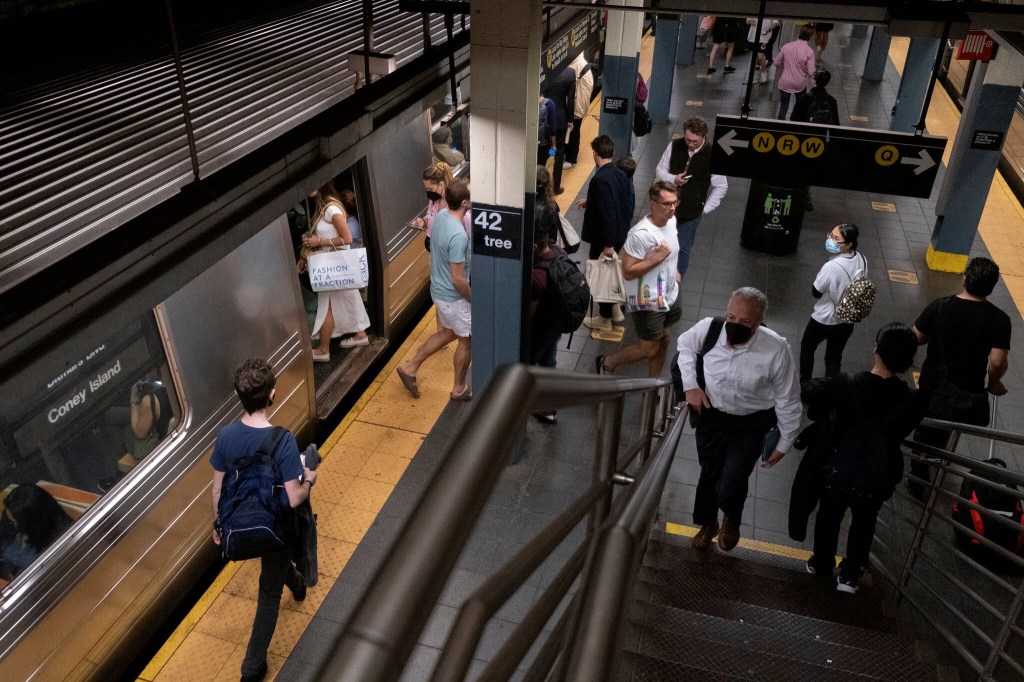
New York City subway. (Photo from the New York Times.)

An article on Crain’s New York Business noted that the Metropolitan Transit Authority (MTA), which runs New York City’s public transportation system was increasing the fare for a bus or subway ride from $2.75 to $2.90. The article noted that: “Revenue generated by the fare increase is expected to cover the [MTA’s] operating expenses and help keep up with inflation.”

a.  What is the MTA assuming about the price elasticity of demand for subway and bus rides in New York City? How plausible do you find this assumption? Briefly explain.

b. What is the largest percentage decline in subway and bus rides that the MTA can experience and still meet its revenue expectations?

Solving the Problem

Step 1:  Review the chapter material. This problem is about the relationship between a price increase on quantity demanded and revenue, so you may want to review the section “The Relationship between Price Elasticity of Demand and Total Revenue.”

Step 2:  Answer part (a) by explaining what the MTA is assuming about the price elasticity of demand for subway and bus rides, and comment on the plausibility of this assumption. If the MTA is expecting that an increase in the price of a subway and bus ride will increase the total revenue it earns from these rides, it must be assuming that the demand for subway and bus rides is price inelastic. If the demand were price elastic, the MTA would earn less revenue following the price increase.

 As we saw in Chapter 6, Section 6.2, the most important determinant of elasticity is the existence of substitutes. In a big city, the most important substitutes to taking public transportation are: (1) people walking, (2) people driving their own cars, or (3) people using a ride-hailing service, such as Uber and Lyft.  People who live close to their destination and who were indifferent between walking and taking public transportation before the price increase, are likely to switch to walking. Given the size of a city like New York, we might expect the number of these people to be relatively small. Driving your own car in a big city has the drawback that heavy traffic may mean it takes longer to drive than to take the bus or subway and paying for parking can be expensive. Using Uber or Lyft is also much more expensive than taking public transportation and may also be slow. It seems likely that current users of public transportation in New York City don’t see these alternatives as close substitutes for the bus or subway. So, it’s plausible for the MTA to assume that the demand for subway and bus rides is price inelastic. 

Step 3:  Answer part (b) by calculating the largest percentage decline in bus and subway rides that the MTA can experience and still meet its revenue expectations. The MTA is increasing the price of subway and bus rides from $2.75 to $2.90 per ride. That is a ($0.15/$2.75) × 100 = 5.5 percent increase. (Note that we would get a somewhat different result if we used the midpoint formula described in Section 6.1.) For the MTA’s revenue to increase as a result of the price increase, the percentage decrease in the quantity demanded of subway rides must be less than the percentage increase in the price. Therefore, the price increase can’t result in a decline of more than 5.5 percent. 

Source:  Caroline Spivak, “Subway and Bus Fares Will Increase Starting Sunday,” crainesnewyork.com, August 18, 2023.

The Fortune Magazine Global 500

Photo of a Walmart store from the Associated Press via the Wall Street Journal.

Many people are familiar with Fortune magazine’s list of the 500 largest U.S.-based firms, measured by their revenue in 2022. (Note: It’s easy to confuse the Fortune 500 with the S&P 500. Firms are included in the S&P 500 on the basis of their market capitalization—the value of all of their outstanding shares of stock—rather than on the basis of their revenue. The S&P 500 is used to compute the most widely followed stock market index. See Microeconomics and Economics, Chapter 8, Section 8.2, and Macroeconomics and Essentials of Economics, Chapter 6, Section 6.2.) 

Fortune also compiles a global 500 list, which includes firms based anywhere in the world. The table below shows the top 10 firms on this Fortune list. With more than $600 billion in revenue in 2022, Walmart tops the list. Five of the ten largest firms are in the oil industry. The three firms based in China are owned by the Chinese government. The Saudi government owns more than half of Saudi Aramco. 

FirmIndustryCountry
WalmartRetailingUnited States
Saudi AramcoOilSaudi Arabia
State GridPublic utilityChina
AmazonRetailingUnited States
China National PetroleumOilChina
Sinopec GroupOilChina
Exxon MobilOilUnited States
AppleConsumer electronicsUnited States
ShellOilUnited Kingdom
UnitedHealth GroupHealth insuranceUnited States

The following table shows how many firms among the top 100 are headquartered in the listed countries. All countries that have more than one firm located in them are included. Far more of these large firms are located in the United States and China than in any of the other countries. Germany, Japan, France, and South Korea are the only other countries that are the headquarters for more than two firms.

CountryNumber of firms
United States38
China30
Germany7
Japan5
France4
South Korea3
India2
United Kingdom2
Italy2

The Fortune article can be found here.

The Price Elasticity of Demand for Disney+

Supports: Microeconomics, Chapter 6, Section 6.3, Economics, Chapter 6, Section 6.3, and Essentials of Economics, Chapter 7, Section 7.7

The Walt Disney Studios in Burbank, California (Photo from reuters.com)

On August 9, Disney released its earnings for the third quarter of its fiscal year. In a conference call with investors, Disney CEO Bob Iger announced that the price for a subscription to the Disney+ streaming service would increase from $10.99 per month to $13.99. An article in the Wall Street Journal quoted Iger as saying that the company had been more uncertain about pricing Disney+ than rival Netflix was about pricing its streaming service “because we’re new at all this.” According to the article, Iger had also said that “there was room to raise prices further [for Disney+] without reducing demand.” A column in the New York Times made the following observation: “The strategy now is to extract more money from subscribers via hefty price increases for Disney+, and hoping that those efforts don’t drive them away.”

a.  What is Disney assuming about the price elasticity of demand for Disney+? Briefly explain.

b. Assuming that Disney is only concerned with the total revenue it earns from Disney+, what is the largest percentage of subscribers Disney can afford to “drive away” as a result of its price increase?

c.  Why would Iger point out that Disney was new at selling streaming services when discussing the large price increase they were implementing?

d.  According to the Wall Street Journal’s account of Iger’s remarks, did he use the phrase “reducing demand” as an economist would? Briefly explain. 

Solving the Problem

Step 1:  Review the chapter material. This problem is about the effect of a price change on a firm’s revenue, so you may want to review the section “The Relationship between Price Elasticity of Demand and Total Revenue.”

Step 2:  Answer part (a) by explaining what Disney is assuming about the price elasticity of demand for Disney+.Disney must be assuming that the demand for Disney+ is price inelastic because they expect that the price increase will increase the revenue they earn from the service. If the demand were price elastic, they would earn less revenue following the price increase. 

Step 3:  Answer part (b) by calculating the largest percentage of subscribers that Disney can drive away with the price increase. Disney is increasing the price of Disney+ by $3 per month, from $10.99 to $13.99. That is a ($3/$10.99) × 100 = 27.3 percent increase. (Note that we would get a somewhat different result if we used the midpoint formula described in Section 6.1.)  For the price increase to increase Disney’s revenue from Disney+, the percentage decrease in the quantity demanded must be less than the percentage increase in the price. Therefore, the price increase can’t drive away more than 27.3 percent of Disney+ subscribers. 

Step 4:  Answer part (c) by explaining why Iger mentioned that Disney was new to streaming when discussing the Disney+ price increase. Firms sometimes attempt to statistically estimate their demand curves to determine the price elasticity. But particularly when a firm has only recently started selling a product, it often searches for the profit maximizing price through a process of trial and error. Iger contrasted Disney’s relative lack of experience in selling streaming services with Netflix’s much longer experience. In that context, it’s plausible that Disney had been substantially overestimating the price elasticity of demand for Disney+ (that is, Disney had thought that in absolute value, the price elasticity was larger than it actually was). So, the profit maximizing price might be significantly higher than the company had initially thought.

Step 5:  Answer part (d) by explaining whether Iger used the phrase “reducing demand” as an economist would. Following a price increase, Disney will experience a reduction in the quantity demanded of Disney+ subscriptions—a movement along the demand curve for subscriptions. For Disney to experience reduced demand for Disney+ subscriptions—a shift of the demand curve—a change in some variable other than price would have to cause consumers to reduce their willingness to buy subscriptions at every price.

Sources:  Robbie Whelan, “Disney to Significantly Raise Prices of Disney+, Hulu Streaming Services,” Wall Street Journal, August 9, 2023; and Andrew Ross Sorkin, Ravi Mattu, Sarah Kessler, Michael J. de la Merced, and Ephrat Livni, “Bob Iger Tweaks Disney’s Strategy on Streaming,” New York Times, August 10, 2023.

Think the Concept of Price Elasticity is Hard? Just Ask Bob Iger.

The Magic Kingdom in Walt Disney World in Florida. Photo by the AP via the Wall Street Journal.

Elasticity is near the top of the list of topics that students struggle with in the principles course. Some students struggle with the arithmetic of calculating elasticities, while others have difficulty understanding the basic concept. The importance and difficulty of elasticity led us to devote an entire chapter to it: Chapter 6 in both Microeconomics and Economics. (We include a briefer discussion in Chapter 7, Sections 7.5 and 7.6 in Essentials of Economics.)

When the Walt Disney Company released its 2023 second quarter earnings report on May 10, it turned out that Disney CEO Bob Iger is also a little shaky on the concept of price elasticity. During Iger’s previous time as Disney CEO he had started the Disney+ subscription streaming service. Like some other streaming services during the past year, Disney+ has struggled to earn a profit. Disney’s announcement in November 2022 that Disney+ had lost $1.47 billion during the previous quarter contributed to Bob Chapek, Iger’s predecessor as CEO, being fired by Disney’s board of directors.

For this quarter, Iger was able to announce that losses at Disney+ had been reduced to $659 million, although skepticism among investors about whether the service would turn a profit by next year as Iger indicated contributed to a sharp decline in Disney’s stock price. The smaller loss at Disney+ was largely the result of Disney having raised the price of the service in December 2022 from $7.99 per month to $10.99 per month. According to an article in the Wall Street Journal, Iger noted that the price increase had caused only a very small decline in subscribers. Iger was quoted as concluding: “That leads us to believe that we, in fact, have pricing elasticity” with respect to Disney+.

Taken literally, Iger has the concept of elasticity backwards. If “having pricing elasticity” means having price elastic demand, then Disney would have experienced a large loss of Disney+ subscribers after the price increase, not a small loss. To use the concept correctly, Iger should have said something like “we have price inelastic demand.” If we give Iger the benefit of the doubt and assume that he knows the definitions of price elastic and price inelastic, then we can interpret what he said as meaning “we have favorable price elasticity.” Favorable in this case would mean demand is price inelastic.

In any case, this episode is a good example of why many students–and CEOs!–can struggle with the concept of price elasticity.

4/29/23 Podcast – Authors Glenn Hubbard & Tony O’Brien discuss a hard vs. soft landing, the debt ceiling, and an economics view of the CHIPS act passed in 2022.

Join authors Glenn Hubbard & Tony O’Brien as they discuss the state of the landing the economy will achieve – hard vs. soft – or “no landing”. Also, they address the debt ceiling and the barriers it might present to a recovery. We also delve into the Chips Act and what economics has to say about the subsidy of a particular industry. Gain insights into today’s economy through our final podcast of the 2022-2023 academic year! Our discussion covers these points but you can also check for updates on our blog post that can be found HERE .

The Effect on a Firm’s Costs of Using a Generative AI Program

Supports: Microeconomics, Chapter 11, Section 11.5; Economics, Chapter 11, Section 11.5; and Essentials of Economics, Chapter 8, Section 8.5

Photo from the Wall Street Journal.

Imani owns a firm that sells payroll services to companies in the Atlanta area. Her largest cost is for labor. She employs workers who use software to prepare payroll reports and to handle texts and calls from client firms. She decides to begin using a generative AI program, like ChatGPT, which is capable of quickly composing thorough answers to many questions and write computer code. She will use the program to write the additional computer code needed to adapt the payroll software to individual client’s needs and to respond to clients seeking advice on payroll questions. Once the AI program is in place, she will need only half as many workers. The number of additional workers she needs to hire for every 20 additional firms that buy her service will fall from 5 to 1. She will have to pay a flat monthly licensing fee for the AI program; the fee will not change with the number of firms she sells her services to. Imani determines that making these changes will reduce her total cost of providing services to her current 2,000 clients from $2,000,000 per month to $1,600,000 per month

In answering the following questions, assume that, apart from the number of workers, none of the other inputs—such as the size of her firm’s office, the number of computers, or other software—change as a result of her leasing the AI program.

a. Briefly explain whether each of the following statements about the cost situation at Imani’s firm after she begins using the AI program is correct or incorrect.

  1. Her firm’s average total cost, average variable cost, and average fixed cost curves will shift down, while her firm’s marginal cost curve will shift up.
  2. Her firm’s average total cost, average variable cost, average fixed cost and marginal cost curves will all shift up.
  3. Her firm’s average total cost, average variable cost, and marginal cost curves will shift down, while her average fixed cost curve will shift up.
  4. Her firm’s average total cost, average variable cost, average fixed cost, and marginal cost curves will all shift down.
  5. Her firm’s average fixed cost curve will shift up, but her other cost curves will be unchanged.

b. Draw a graph illustrating your answer to part a. Be sure to show the original average total cost, average variable cost, average fixed cost, and marginal cost curves. Also show the shifts—if any—in the curves after Imani begins using the AI program.

Solving the Problem

Step 1:  Review the chapter material. This problem requires you to understand definitions of costs, so you may want to review the sections “The Difference between Fixed Costs and Variable Costs,” “Marginal Costs,” and “Graphing Cost Curves”

Step 2:  Answer part (a) by explaining whether each of the five listed statements is correct or incorrect. The cost of the AI program is fixed because it doesn’t change with the quantity of her services that Imani sells. Her firm will have greater fixed costs after licensing the AI program but she will have lower variable costs because she is able to produce the same level of output with fewer workers. Her marginal cost will also decline because she needs to hire fewer workers as the quantity of services she sells increases. We know that the average total cost per month of providing her service to 2,000 clients has decreased because we are given the information that it changed from ($2,000,000/2,000) = $1,000 to ($1,600,000/2,000) = $800.

  1. This statement is incorrect because her average fixed cost curve will shift up as a result of her total fixed cost having increased by the amount of the AI program license and because her marginal cost curve will shift down, not up.
  2. This statement is incorrect because all of her cost curves, except for average fixed cost, will shift down, not up.
  3. This statement is correct because it describes the actual shifts in her cost curves. 
  4. This statement is incorrect because her average fixed cost curve will shift up, not down.
  5. This statement is incorrect because her rather than being unaffected, her average total cost, average variable cost, and marginal cost curves will shift down.

Step 3:  Answer part (b) by drawing the cost curves for Imani’s firm before and after she begins using the AI program. Your graph should look like the following, where the curves representing the firm’s costs before Imani begins leasing the AI program are in blue and the costs after leasing the program are in red. 

Mark Zuckerberg … All Alone in the Metaverse?

In October 2021, Facebook founder Mark Zuckerberg did something unusual–he changed the name of the company from Facebook, Inc. to Meta Platforms, Inc. According to Zuckerberg, he did so because he said, “Over time I hope our company will be seen as a metaverse company.” What is the metaverse? Definitions differ, but it typically refers to software programs that allow people to access either augmented reality (AR) or virtual reality (VR) images and information.  

 In both AR and VR, people wear headsets, goggles, or glasses to see images and information displayed. In VR, you wear goggles and have to remain stationary because your whole field of vision is a digital projection, so if you walk around you run the risk of tripping over furniture or other obstacles. With AR, you can walk through the physical world because your goggles display only limited amounts of information.

For example, Peggy Johnson, CEO of Magic Leap describes the device her firm sells this way: “You wear it over your eyes. You can actually think of it as a computer on your eyes. And you still see your physical world around you, but we place digital content very smartly in that physical world.” Among other uses, Magic Leap’s device can help to train a worker to use a new piece of equipment by overlaying a virtual version of the equipment over the actual piece of equipment. The virtual version would place instructions in the worker’s field of view. That worker would be in the metaverse.

While Meta has been selling Oculus AR headsets, Zuckerberg has focused more on VR than on AR.  An article in the Wall Street Journal described the VR metaverse that Zuckerberg is hoping to help build: “Eventually, the idea is that people will be able to do almost anything in the metaverse: go shopping, attend school, participate in work meetings.”  They would do these things while sitting at their desk or armchair. Meta’s first significant VR product was Horizon Worlds. On Horizon, after choosing an avatar, or virtual figure that represents you, you can shop, play games, or hang out with other people. You enter Horizon by using Meta’s Quest VR headset, which has a price of $400 to $700, depending on the headset’s configuration. Meta set a goal of having 500,000 monthly users of Horizon by the end of 2022 but ended the year with only around 200,000 active users. 

Horizon’s main problem seems to have been that the app was subject to large network externalities. As we discuss in Chapter 10, Section 10.3 of Economics and Microeconomics, network externalities describe the situation in which the usefulness of a product increases with the number of consumers who use it. The Horizon app is enjoyable to use only if many other people are using it. But because few people regularly use the app, many new users don’t find it enjoyable and soon stop using it. According to an article in the Wall Street Journal, in late 2022, “Most visitors to Horizon generally don’t return to the app after the first month … there are rarely any girls in the Hot Girl Summer Rooftop Pool Party, and in Murder Village there is often no one to kill. Even the company’s showcase worlds… are mostly barren of users.” Reality Labs, the division of Meta in charge of Horizon, the Quest headset, and other metaverse projects, had total losses of $27 billion by the end of 2022. The losses were partly the result of Meta selling Quest headsets for a price below the cost of producing them in an attempt to get more people to use Horizon.  

Zuckerberg peisists in believing that the firm’s future lies with the metaverse and continues to spend billions on metaverse projects. Investors aren’t convinced that this strategy will work because, as an article on economist.com put it in early 2023: “Few people are burning to migrate to the metaverse.” As investors’ became more skeptical of Zuckerberg’s strategy, Meta’s stock price declined by more than half between the fall of 2021 and early 2023.  To be successful in its metaverse strategy, Meta will eventually have to attract enough buyers of its Quest headsets and users of its Horizon app to begin taking advantage of network externalities. 

Source: Dylan Croll, “Magic Leap CEO Peggy Johnson on the AR revolution,” news.yahoo. com, January 4, 2023; “Things Are Looking Up for Meta,” economist.com, February 3, 2023; “How Much Trouble Is Mark Zuckerberg In?” economist.com, October 16, 2022; Jeff Horwitz, Salvador Rodriguez, and Meghan Bobrowsky, “Company Documents Show Meta’s Flagship Metaverse Falling Short,” Wall Street Journal, October 15, 2022; Sarah E. Needleman, “Facebook Changes Company Name to Meta in Focus on Metaverse,” Wall Street Journal, October 28, 2021; Meghan Bobrowsky and Sarah E. Needleman, “What is the Metaverse? The Future Vision for the Internet,” Wall Street Journal, April 28, 2022.

If You Have Some Cash to Spare ….

you can bid for Paul Samuelson’s Nobel Prize Medal here. Note that at the time of posting the minimum bid required was $495,000.

You can read a brief biography of Samuelson on the Nobel site here. You can read the lecture Samuelson delivered on the occasion of being awarded the price here. (Note that the lecture contains technical material.)

What Caused the Plunge in Sales at Bed Bath & Beyond?

Photo from the Wall Street Journal.

In the Apply the Concept “Trying to Use the Apple Approach to Save J.C. Penney” in Chapter 10, Section 10.4 in both Microeconomics and Economics, we discussed how Ron Johnson had been successful as head of Apple’s retail stores but failed when he was hired as CEO of J. C. Penney.  Insights from behavioral economics indicate that Johnson made a mistake in eliminating Penney’s previous strategy of keeping prices high but running frequent sales. Although Penney’s “every day prices” under Johnson were lower than they had been under the previous management, many consumers failed to recognize that fact and began shopping elsewhere. 

            Johnson’s experience may indicate the dangers of changing a firm’s long-standing business model. Customers at brick-and-mortar retail stores fall into several categories: Some people shop in a number of stores, depending on which store has the lowest price on the particular product they’re looking for; some shop only for products such as televisions or appliances that they hesitate to buy from Amazon or other online sites; while others shop primarily in the store that typically meets their needs with respect to location, selection of products, and pricing. It’s the last category of customer that was most likely to stop shopping at Penney because of Johnson’s new pricing policy because they were accustomed to primarily buying products that were on sale.

            Bed Bath & Beyond was founded in 1971 by Warren Eisenberg and Leonard Feinstein. As the name indicates, it has focused on selling household goods—sometimes called “home goods”—such as small appliances, towels, and sheets. It was perhaps best known for mailing massive numbers of 20 percent off coupons, printed on thin blue cardboard and nicknamed Big Blue, to households nationwide. Although by 2019, the firm was operating more than 1,500 stores in the United States, some investors were concerned that Bed Bath & Beyond could be run more profitably. In March 2019, the firm’s board of directors replaced the current CEO with Mark Tritton who had helped make Target stores very profitable.

            In an approach similar to the one Ron Johnson had used at J.C. Penney, Tritton cut back on the number of coupons sent out, reorganized the stores to reduce the number of different products available for sale, and replaced some name brand goods with so-called private-label brands produced by Bed Bath & Beyond. Unfortunately, Tritton’s strategy was a failure and the firm, which had been profitable in 2018, suffered losses each year between 2019 and 2022. The losses totaled almost $1.5 billion. In June 2022, the firm’s board of directors replaced Tritton with Sue Grove who had been serving on the board.

            Why did Tritton’s strategy fail? Partly because in March 2020, the effects of the Covid-19 pandemic forced the closure of many Bed Bath & Beyond stores. Unlike some other chains, Bed Bath & Beyond’s web site struggled to fulfill online orders. The firm also never developed a system that would have made it easy for customers to order goods online and pick them up at the curb of their retail stores. That approach helped many competitors maintain sales during the pandemic. Covid-19 also disrupted the supply chains that Tritton was depending on to produce the private-label brands he was hoping to sell in large quantities.

            But the larger problems with Tritton’s strategy would likely have hurt Bed Bath & Beyond even if there had been no pandemic. Tritton thought the stores were too cluttered, particularly in comparison with Target stores, so he reduced the number of products for sale. It turned out, though, that many of Bed Bath & Beyond’s most loyal customers liked searching through the piles of goods on the shelves. One customer was quoted as saying, “I used to find so many things that I didn’t need, that I’d end up buying anyway, like July 4th-themed corn holders.” Customers who preferred to shop in less cluttered stores were likely to already be shopping elsewhere. And it turned out that many Bed Bath & Beyond customers preferred national brands and switched to shopping elsewhere when Tritton replaced those brands with private-label brands. Finally, many customers were accustomed to shopping at Bed Bath & Beyond shortly after receiving a Big Blue 20 percent off coupon. Sending out fewer coupons meant fewer trips to Bed Bath & Beyond by those customers.

            In a manner similar to what happened to Johnson in his overhaul of the Penney department stores, Tritton’s changes to Bed Bath & Beyond’s business model caused many existing customer to shop elsewhere while attracting relatively few new customers. An article in the Wall Street Journal quoted an industry analyst as concluding: “Mark Tritton entered the business and ripped up its playbook. But the strategy he replaced it with was not tested and nowhere near sharp enough to compensate for the loss of traditional customers.”

Sources:   Jeanette Neumann, “Bed Bath & Beyond Traced an Erratic Path to Its Current Crisis,” bloomberg.com, September 29, 2022;  Kelly Tyko, “What to expect at Bed Bath & Beyond closing store sales,” axios.com September 22, 2022; Inti Pacheco and Jodi Xu Klein, “Bed Bath & Beyond to Close 150 Stores, Cut Staff, Sell Shares to Raise Cash,” Wall Street Journal, August 31, 2022; Suzanne Kapner and Dean Seal, “Bed Bath & Beyond CEO Mark Tritton Exits as Sales Plunge,” Wall Street Journal, June 29, 2022; Suzanne Kapner, “Bed Bath & Beyond Followed a Winning Playbook—and Lost,” Wall Street Journal, July 23, 2022; and Ron Lieber, “An Oral History of the World’s Biggest Coupon,” New York Times, November 3, 2021. 

U.S. Carbon Dioxide Emissions in a Global Context

Photo from the New York Times.

As we discuss in Microeconomics and Economics, Chapter 5, Section 5.3, carbon dioxide (CO2) emissions contribute to climate change, including the increases in temperatures that have been experienced worldwide. We’ve found that students are interested in seeing U.S. CO2 emissions in a global context.  

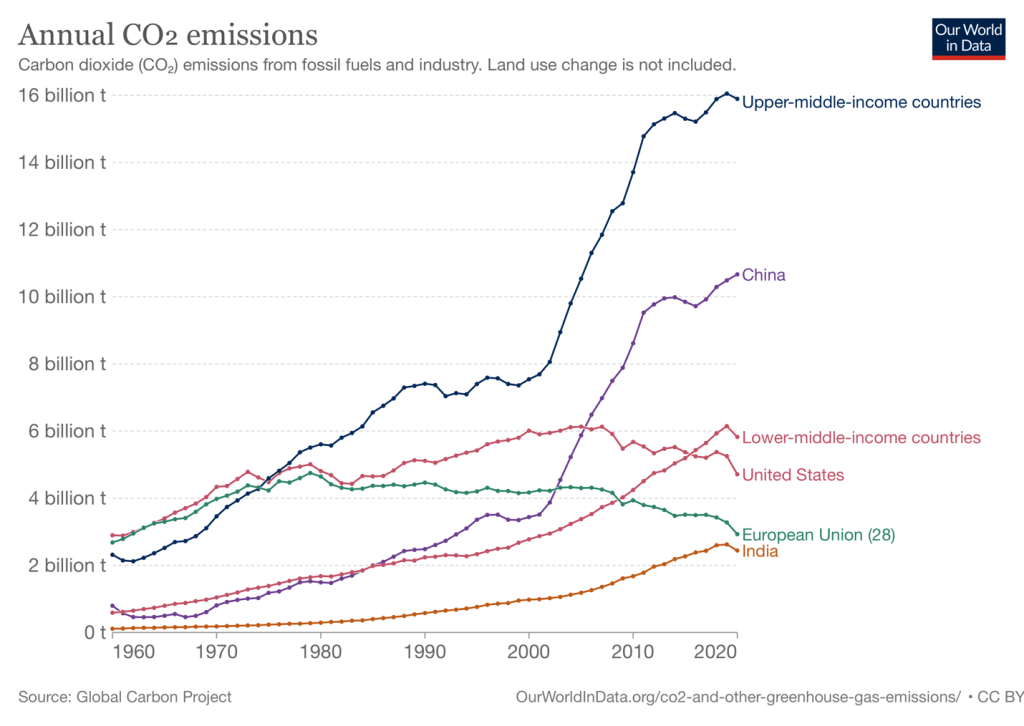
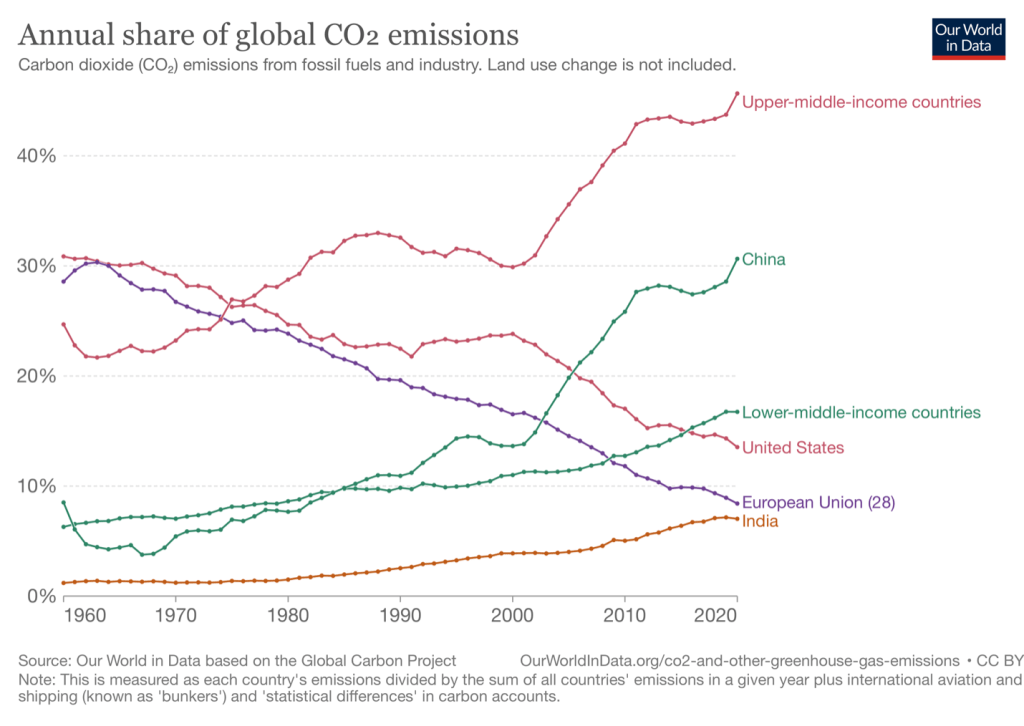
The first of the following figures shows for the years 1960 to 2020, the total amount of CO2 emissions by the United States, China, India, the 28 countries in the European Union, lower-middle-income countries (including India, Nigeria, and Vietnam), and upper-middle-income countries (including China, Brazil, and Argentina). The second of the figures shows the percentage of total world CO2 accounted for by each of the three individual countries and by the indicated groups of countries. in the United States and in the countries of the European Union both total emissions and the percentage of total world emissions have been declining over the past 15 years. Emissions have been increasing in China, India, and in middle-income countries. The figures are from the Our World in Data website (ourworldindata.org). (Note that the reductions in emissions during 2020 largely reflect the effects of the slowdown in economic activity as a result of the Covid-19 pandemic rather than long-term trends in emissions.)

Governments in many countries have attempted to slow the pace of climate change by enacting policies to reduce CO2emissions. (According to estimates by the U.S. Environmental Protection Agency, CO2 accounts for about 76 percent of all emissions worldwide of greenhouse gases that contribute to climate change. Methane and nitrous oxide, mainly from agricultural activity, make up most of the rest of greenhouse gas emissions.) In August 2022, Congress and President Biden enacted additional measures aimed at slowing climate change. Included among these measures were government subsidies to firms and households to use renewable energy such as rooftop solar panels, tax rebates for some buyers of certain electric vehicles, and funds for utilities to develop power sources such as wind and solar that don’t emit CO2. The measures have been estimated to reduce U.S. greenhouse gas emissions by somewhere between 6 percent and 15 percent. Because the United States is responsible for only about 14 percent of annual global greenhouse gas emissions, the measures would likely reduce global emissions by only about 2 percent.

The figures shown above make this result unsurprising. Because the United States is the source of only a relatively small percentage of global greenhouse emissions, reductions in U.S. emissions can result in only small reductions in global emissions. Although many policymakers and economists believe that the marginal benefit from these reductions in U.S. emissions exceed their marginal cost, the reductions can’t by themselves do more than slow the rate of climate change. A key reason that India, China, and other middle income countries have accounted for increasing quantities of greenhouse gases is that they rely much more heavily on burning coal than do the United States, the countries in the European Union, and other high-income countries. Utilities switching to generating electricity by burning coal rather than by burning natural gas has been a key source of reductions in greenhouse gas emissions in the United States.

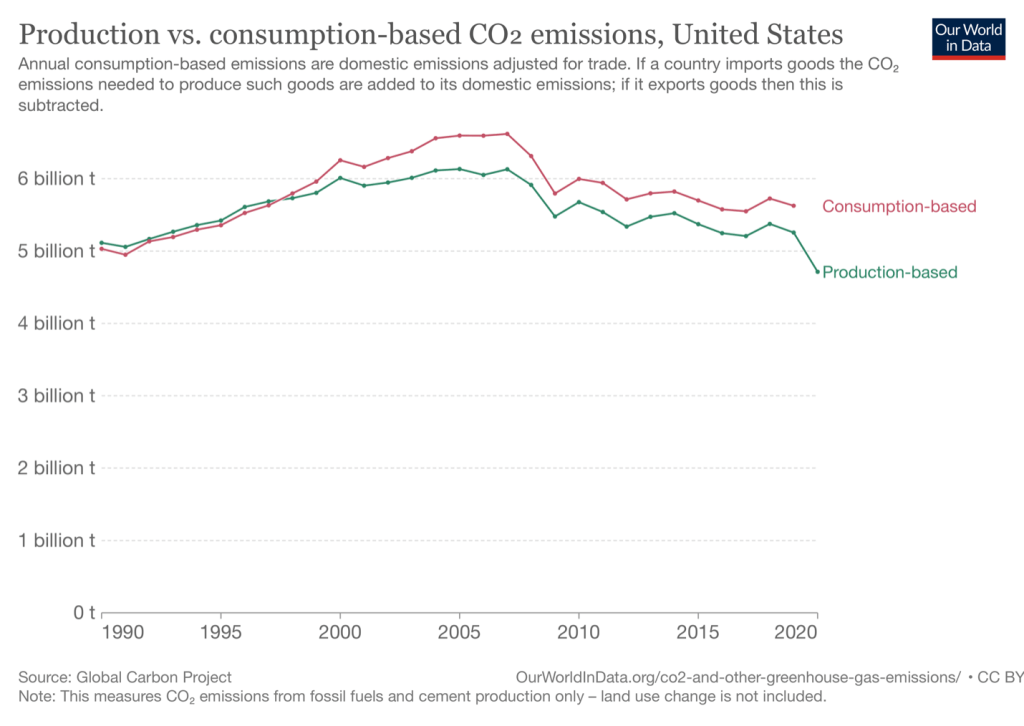
The two figures above measure a country’s contribution to CO2 emissions by looking at the quantity of emissions generated by production within the country. But suppose instead that we look at the quantity of CO2 emitted during the production of the goods consumed within the country? In that case, we would allocate to the United States CO2 emitted during the product of a good, such as a television or a shirt, that was produced in China or another foreign country but consumed in the United States.

For the United States, as the following figure shows it makes only a small difference whether we measure CO2emissions on the basis of production of goods and services or on the basis of consumption of goods and services.  U.S. emissions of CO2 are about 7 percent higher when measured on a consumption basis rather than on a production basis. By both measures, U.S. emissions of CO2 have been generally declining since about 2007. (1990 is the first year that these two measures are available.)

Sources: Hannah Ritchie, Max Roser and Pablo Rosado, “CO₂ and Greenhouse Gas Emissions,” OurWorldInData.org, https://ourworldindata.org/co2-and-other-greenhouse-gas-emissions; Greg Ip, “Inflation Reduction Act’s Real Climate Impact Is a Decade Away,” Wall Street Journal, August 24, 2022; Lisa Friedman, “Democrats Designed the Climate Law to Be a Game Changer. Here’s How,” New York Times, August 22, 2022; Hannah Ritchie, “How Do CO2 Emissions Compare When We Adjust for Trade?” ourworldindata.org, October 7, 2019; and United States Environmental Protection Agency, “Global Greenhouse Gas Emissions Data,” epa.gov, February 22, 2022.