An article in the Washington Post discussed a debate among President Biden’s economic advisers. The debate was over “over whether the White House should blame corporate consolidation and monopoly power for price hikes.” Some members of the National Economic Council supported the view that the increase in inflation that began in the spring of 2021 was the result of a decline in competition in the U.S. economy.
Some Democratic members of Congress have also supported this view. For instance, Massachusetts Senator Elizabeth Warren argued on Twitter that: “One clear explanation for higher inflation? Giant corporations are exploiting their market power to further raise prices. And corporate executives are bragging about their higher profits.” Or, as Vermont Senator Bernie Sanders put it: “The problem is not inflation. The problem is corporate greed, collusion & profiteering.”
But according to the article, Cecilia Rouse, chair of the President’s Council of Economic Advisers (CEA), and other members of the CEA are skeptical that a lack of competition are the main reason for the increase in inflation, arguing that very expansionary monetary and fiscal policies, along with disruptions to supply chains, have been more important.
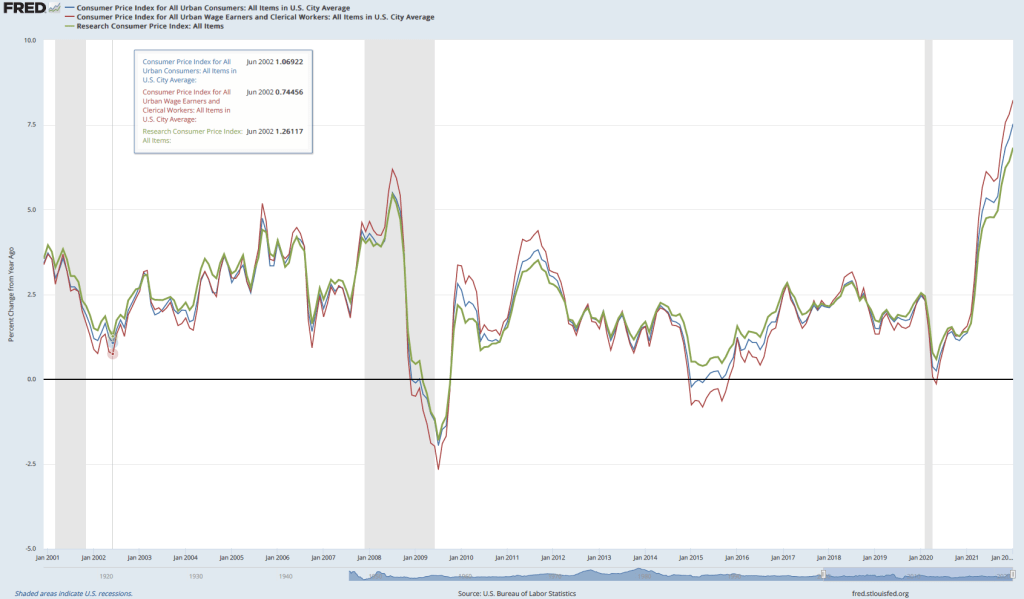
In an earlier blog post (found here), we noted that a large majority of more than 40 well-known academic economists surveyed by the Booth School of Business at the University of Chicago disagreed with the statement: “A significant factor behind today’s higher US inflation is dominant corporations in uncompetitive markets taking advantage of their market power to raise prices in order to increase their profit margins.”
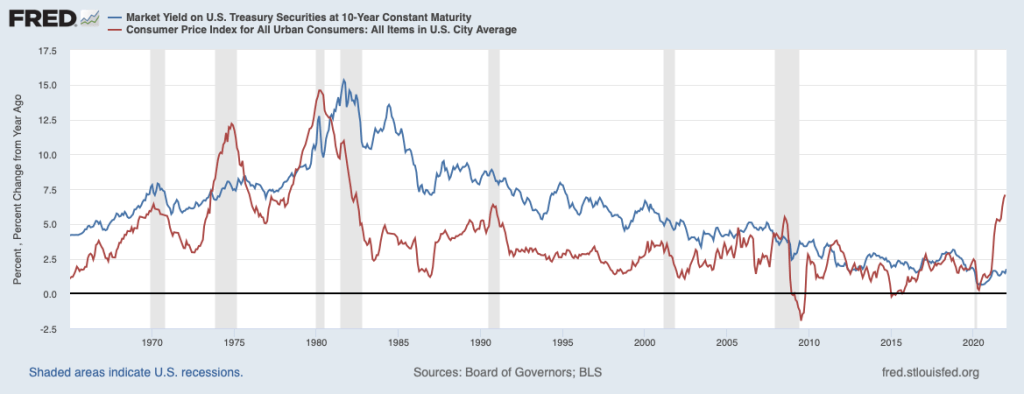
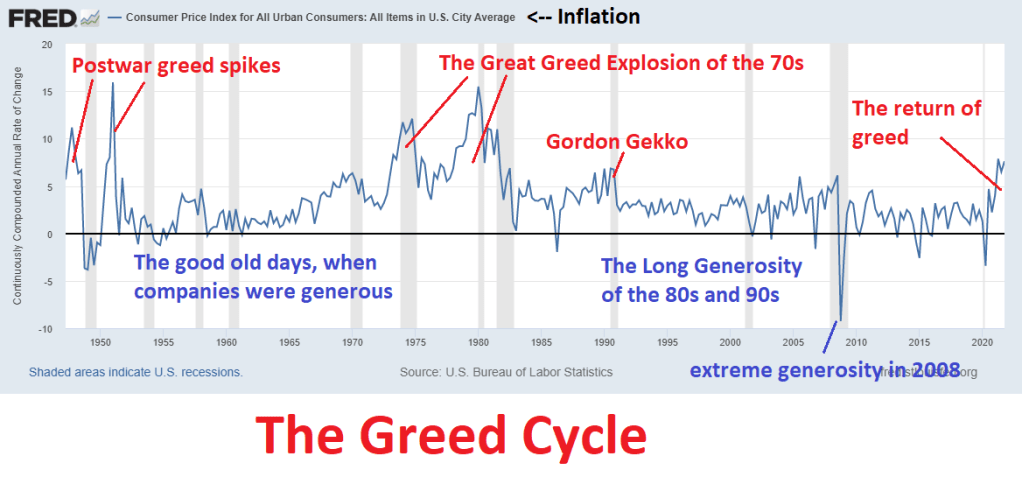
One difficulty with the argument that the sharp increase in inflation since mid-2021 was due to corporate greed is that there is no particular reason to believe that corporations suddenly became more greedy than they had been when inflation was much lower. If inflation were mainly due to corporate greed, then greed must fluctuate over time, just as inflation does. Economic writer and blogger Noah Smith poked fun at this idea in the following graph.
It’s worth noting that “greed” is one way of characterizing the self-interested behavior that underlies the assumption that firms maximize profits and individual maximize utility. (We discuss profit maximization in Microeconomics, Chapter 12, Section 12.2, and utility maximization in Chapter 10, Section 10.1.) When economists discuss self-interested behavior, they are not making a normative statement that it’s good for people to be self-interested. Instead, they are making a positive statement that economic models that assume that businesses maximize profit and consumers maximize utility have been successful in analyzing and predicting the behavior of businesses and households.
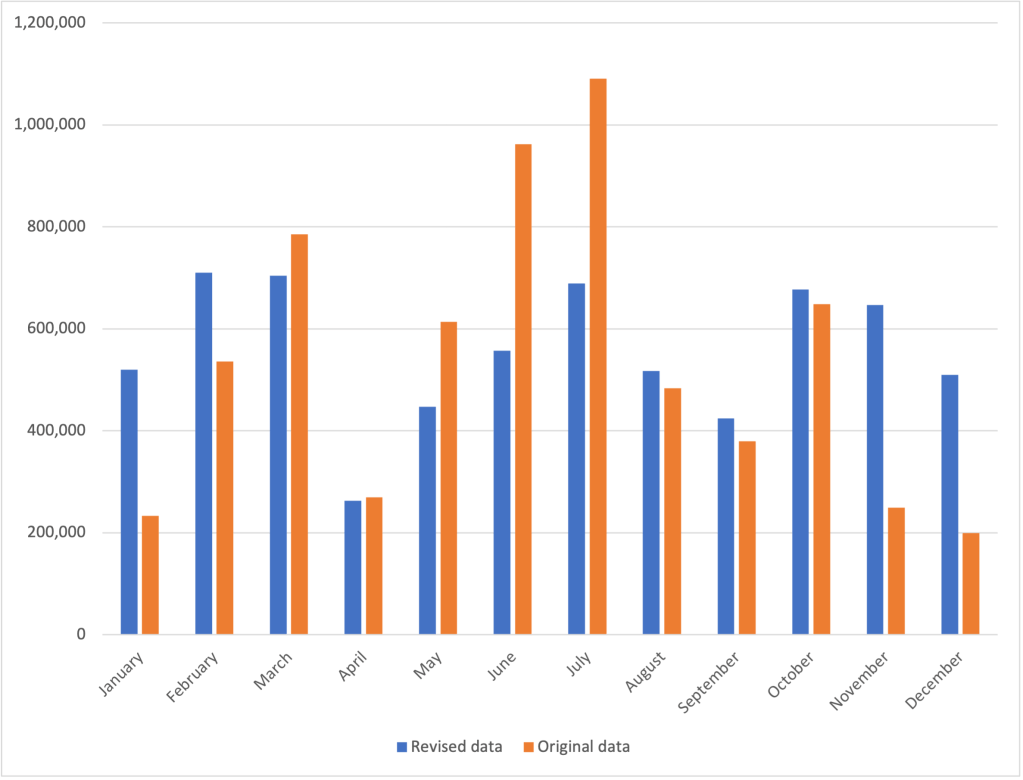
Corporate profits increased from $1.95 trillion in the first quarter of 2021 to $2.40 trillion in third quarter of 2021 (the most recent quarter for which data are available). Using another measure of profit, during the same period, corporate profits increased from about 16 percent of value added by nonfinancial corporate businesses to about 18 percent. (Value added measures the market value a firm adds to a product. We discuss calculating value added in Macroeconomics, Chapter 8, Section 8.1.)
There have been mergers in some industries that may have contributed to an increase in profits—the Biden Administration has singled out mergers in the meatpacking industry as having led to higher beef and chicken prices. At this point, though, it’s not possible to gauge the extent to which mergers have been responsible for higher prices, even in the meatpacking industry.
An increase in profit is not by itself an indication that firms have increased their market power. We would expect that even in a perfectly competitive industry, an increase in demand will lead in the short run to an increase in the economic profit earned by firms in the industry. But in the long run we expect economic profit to be competed away either by existing firms expanding their production or by new firms entering the industry.
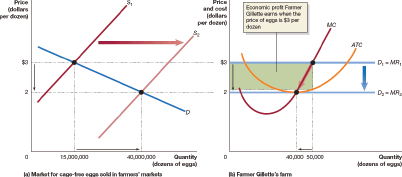
In Chapter 12, we use Figure 12.8 to illustrate the effects of entry in the market for cage-free eggs. Panel (a) shows the market for cage-free eggs, made up of all the egg sellers and egg buyers. Panel (b) shows the situation facing one farmer producing cage-free eggs. (Note the very different scales of the horizontal axes in the two panels.) At $3 per dozen eggs, the typical egg farmer is earning an economic profit, shown by the green rectangle in panel (b). That economic profit attracts new entrants to the market—perhaps, in this case, egg farmers who convert to using cage-free methods. The result of entry is a movement down the demand curve to a new equilibrium price of $2 per dozen. At that price, the typical egg farmer is no longer earning an economic profit.
A few last observations:
- The recent increase in profits may also be short-lived if it reflects a temporary increase in demand for some durable goods, such as furniture and appliances, raising their prices and increasing the profits of firms that produce them. The increase in spending on goods, and reduced spending on services, appears to have resulted from: (1) Households having additional funds to spend as a result of the payments they received from fiscal policy actions in 2020 and early 2021, and (2) a reluctance of households to spend on some services, such as restaurant meals and movie theater tickets, due to the effects of the Covid-19 pandemic.
- The increase in profits in some industries may also be due to a reduction in supply in those industries having forced up prices. For instance, a shortage of semiconductors has reduced the supply of automobiles, raising car prices and the profits of automobile manufacturers. Over time, supply in these industries should increase, bringing down both prices and profits.
- If some changes in consumer demand persist over time, we would expect that the economic profits firms are earning in the affected industries will attract the entry of new firms—a process we illustrated above. In early 2022, this process is far from complete because it takes time for new firms to enter an industry.
Source: Jeff Stein, “White House economists push back against pressure to blame corporations for inflation,” Washington Post, February 17, 2022; Mike Dorning, “Biden Launches Plan to Fight Meatpacker Giants on Inflation,” bloomberg.com, January 3, 2022; and U.S. Bureau of Economic Analysis.ec