Soft Landing, Hard Landing … or No Landing?

During the recovery from the Covid–19 pandemic, inflation as measured by the personal consumption expenditures (PCEprice index, first rose above the Federal Reserve’s target annual inflation rate of 2 percent in March 2021. Many economists inside and outside of the Fed believed the increase in inflation would be transitory because it was thought to be mainly the result of supply chain problems and an initial burst of spending as business lockdowns were ended or mitigated in most areas.

Accordingly, the Federal Open Market Committee (FOMC) kept its target for the federal funds rate at effectively zero (a range of 0 to 0.25 percent) until March 2022 and continued its quantitative easing (QE) program of buying long-term Treasury bonds and mortgage-backed securities (MBS) until that same month.

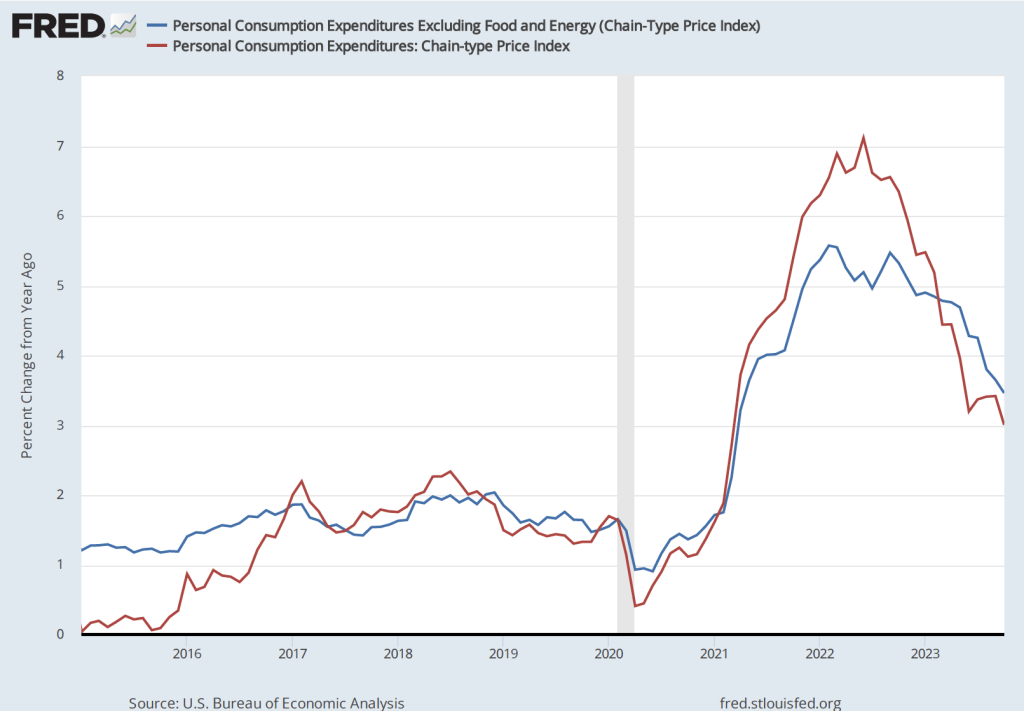
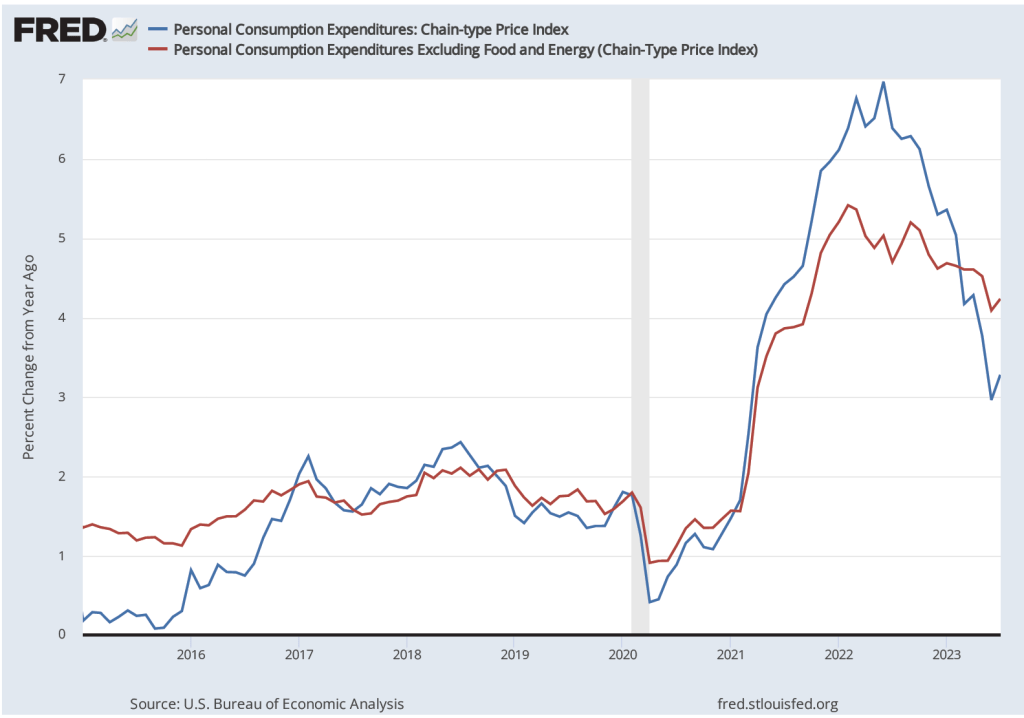
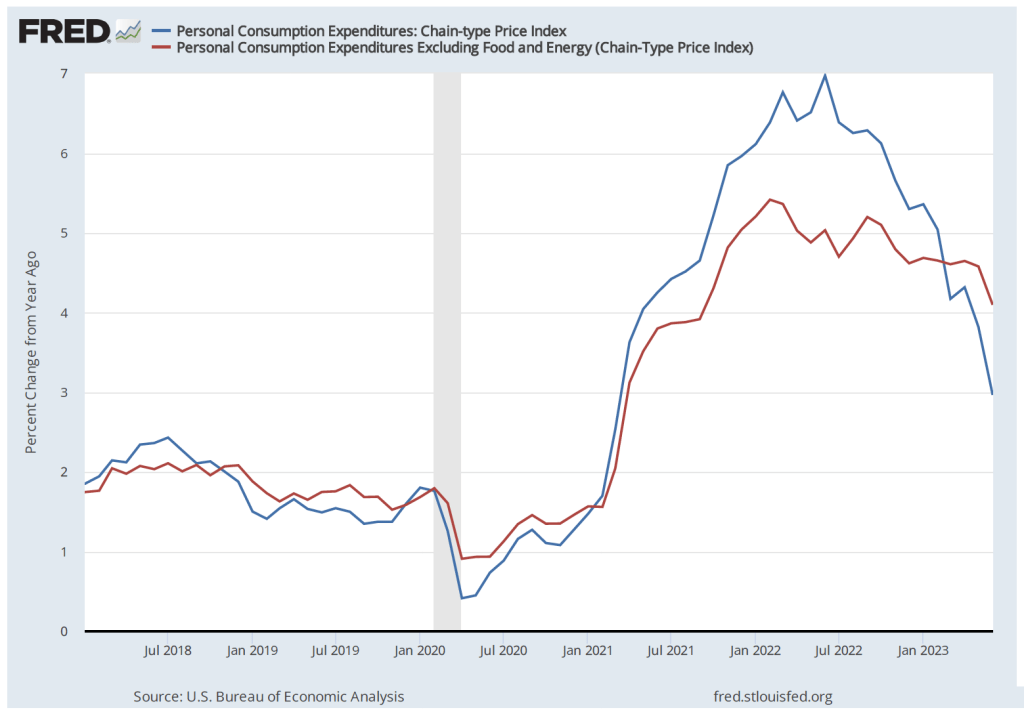
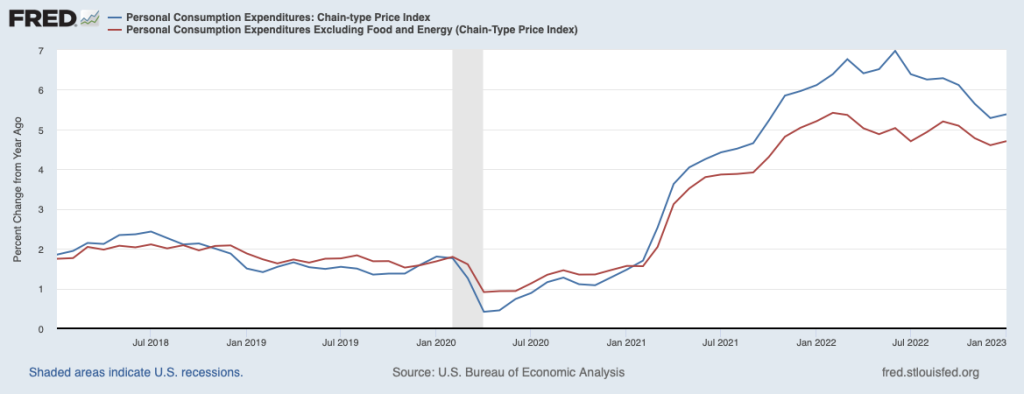
As the following figure shows, by March 2022 inflation had been well above the FOMC’s target for a year. The Fed responded by raising its target for the federal funds rate and switched from QE to quantitative tightening (QT). Although some supply chain problems were still contributing to the high inflation rate during the spring of 2022, the main driver appeared to be very expansionary monetary and fiscal policies. (This blog post from May 2021 has links to contributions to the debate over macro policy at the time. Glenn’s interview that month with the Financial Times can be found here. In November 2022, Glenn argued that overly expansionary fiscal policy was the main driver of inflation in this op-ed in the Financial Times (subscription or registration may be required).We discuss inconsistencies in the Fed’s forecasts of unemployment and inflation here. And in this post we discuss the question of whether the Fed made a mistake in not attempting to preempt inflation before it accelerated.)

Since March 2022, the FOMC has raised its target for the federal funds rate multiple times. In February 2023, the target was a range of 4.50 to 4.75 percent. Longer-term interest rates have also increased. In particular, the average interest rate on residential mortgage loans increased from 3 percent in March 2022 to 7 percent in November 2022, before falling back to around 6 percent in February 2023.  In the fall of 2022, there was optimism among some economists that the Fed had succeeded in slowing the economy enough to put inflation on a path back to its 2 percent target. Although many economists had expected that inflation would only return to the target if the U.S. economy experienced a recession—labeled a hard landing—the probability that inflation could be reduced without a recession—labeled a soft landing—appeared to be increasing. 

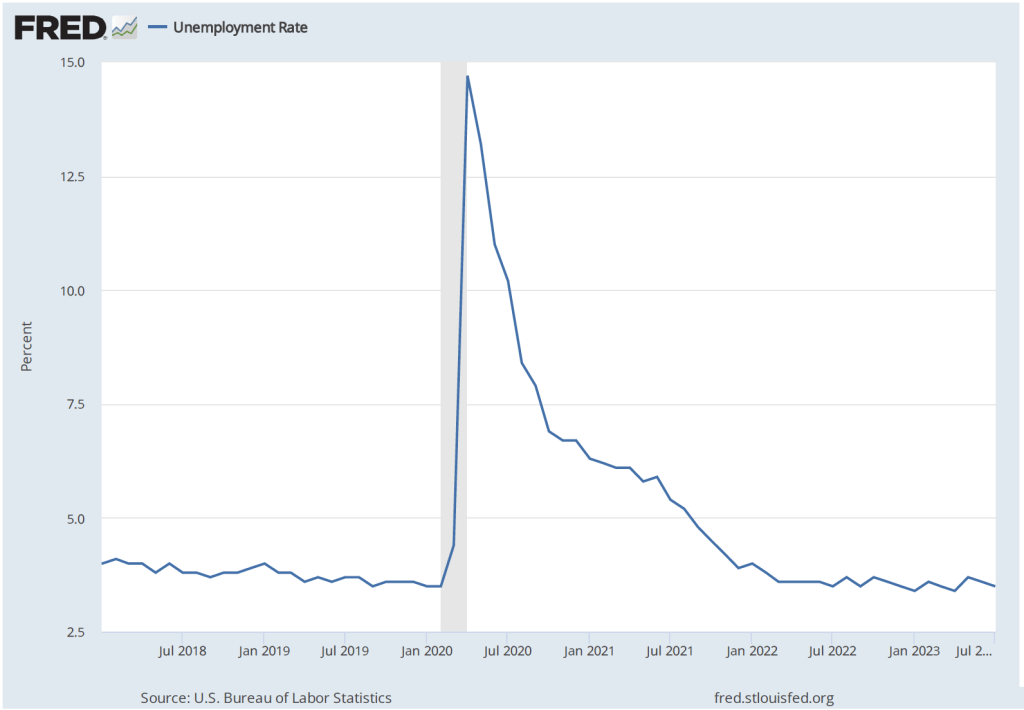
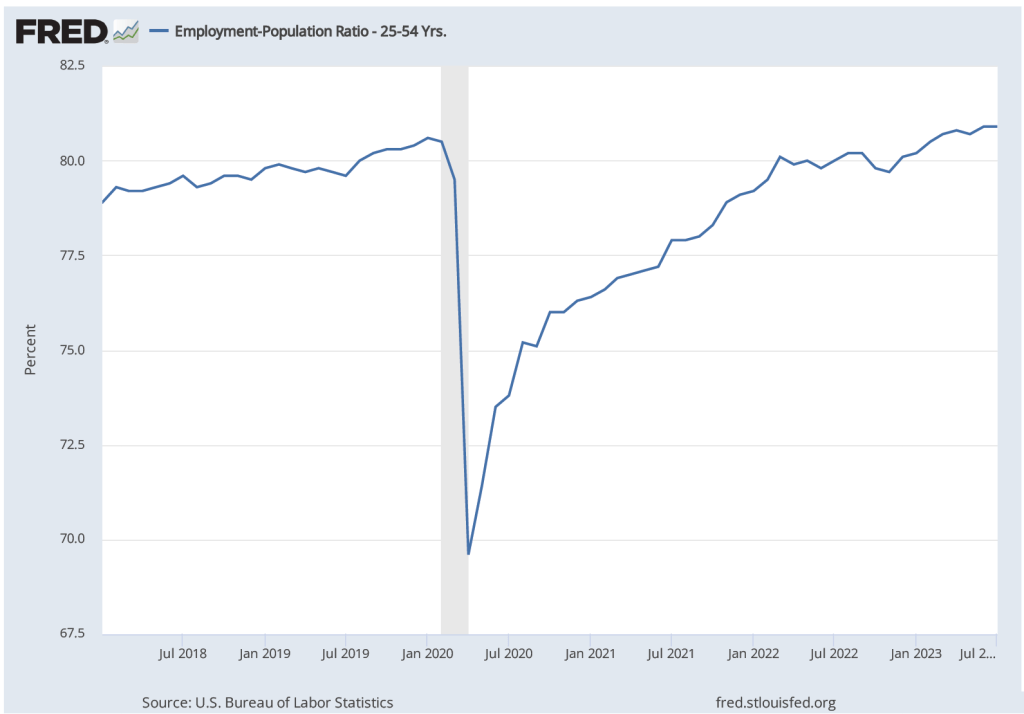
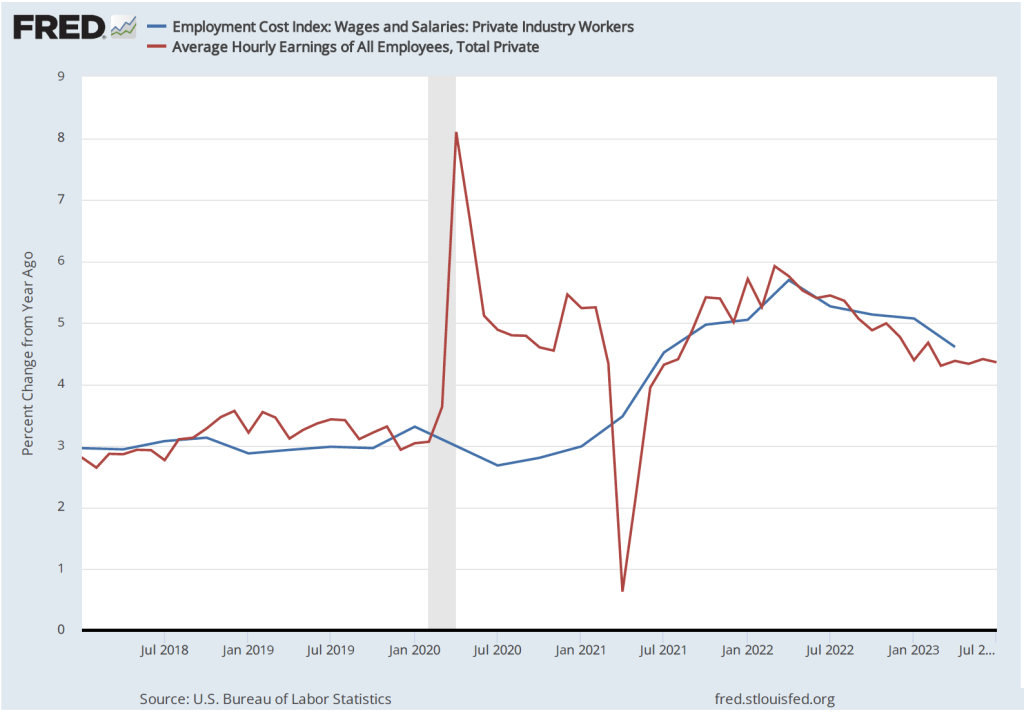
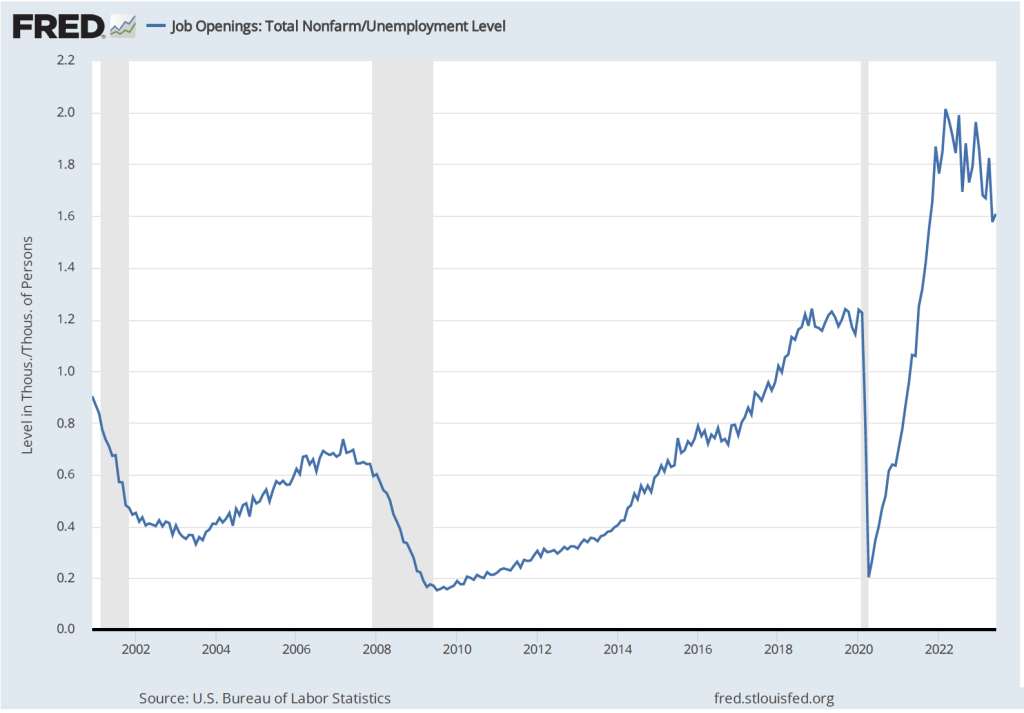
Economic data for January 2023 made a soft landing seem less likely. Consumer spending remained above its trend from before the pandemic, employment increases were unexpectedly high, and inflation reversed its downward trend. A continuation of low rates of unemployment and high rates of inflation wasn’t consistent with either a hard landing or a soft landing. Some observers, particularly in Wall Street financial firms, began describing the situation as no landing. But given the Fed’s strong commitment to returning to its 2 percent target, the no landing scenario couldn’t persist indefinitely.

Many investors had anticipated that the FOMC would end its increases in the federal funds target by mid-2023 and would have made one or more cuts to the target by the end of the year, but that outcome now seems unlikely. The FOMC had increased the federal funds target by only 0.25 percent at its February meeting but many economists now expected that it would announce a 0.50 percent increase at its next meeting on March 21 and 22. Unfortunately, the odds of a hard landing seem to be increasing.

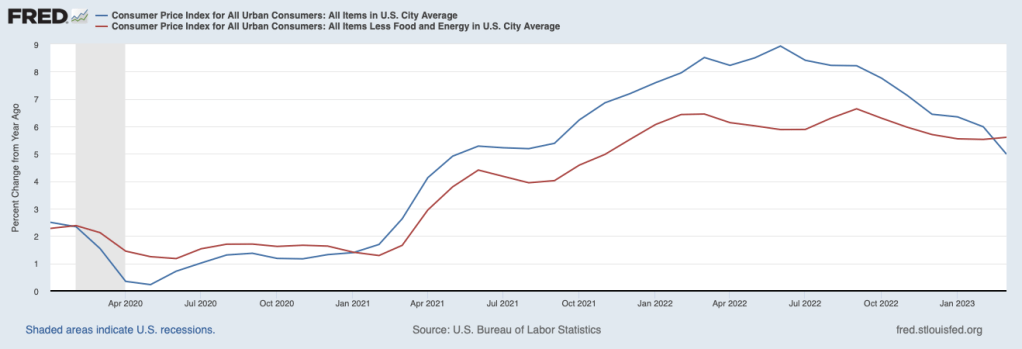
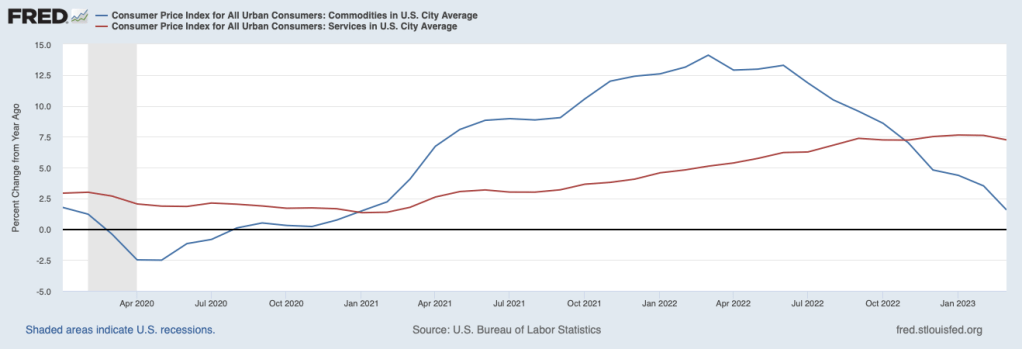
A couple of notes: Although there are multiple ways of measuring inflation, the percentage increase in the PCE is the formal way in which the FOMC determines whether it is hitting its inflation target. To judge what the underlying inflation is—in other words, the inflation rate likely to persist in at least the near future—many economists look at core inflation. In the earlier figure we show movements in core inflation as measured by the PCE excluding prices of food and energy. Note that over the period shown PCE and core PCE follow the same pattern, although core PCE inflation begins to moderate earlier than does core PCE.

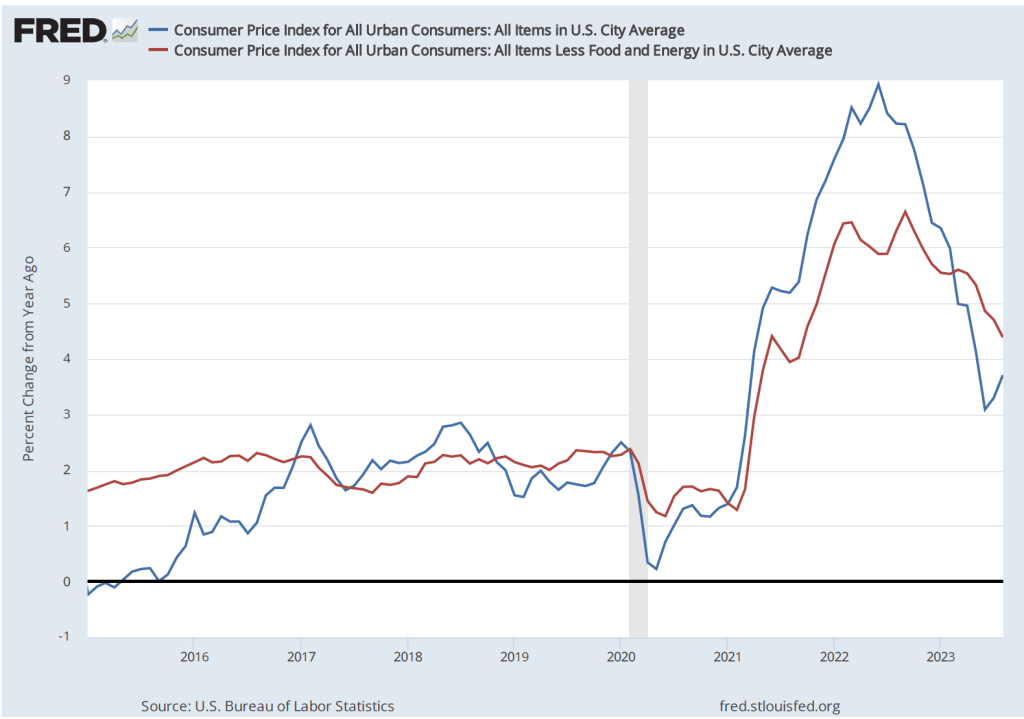
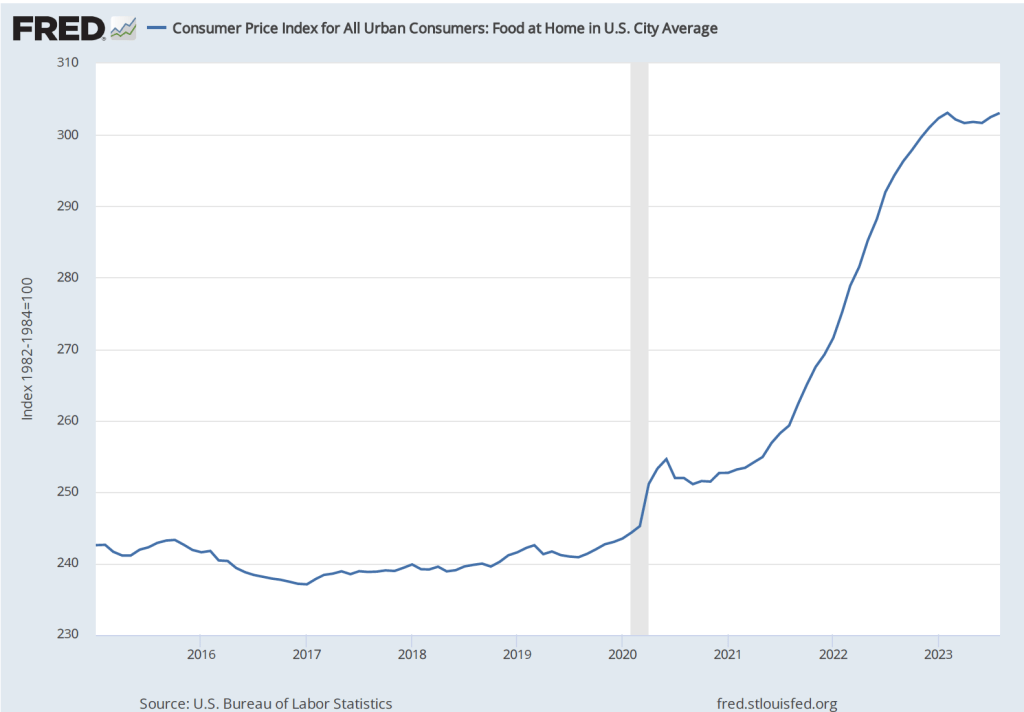
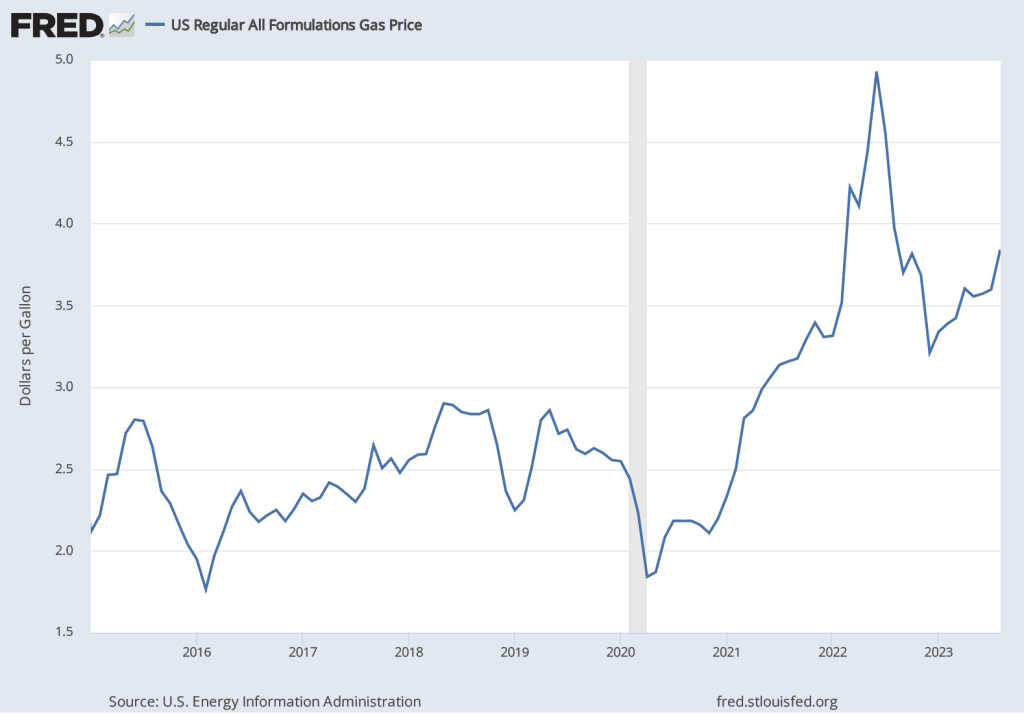
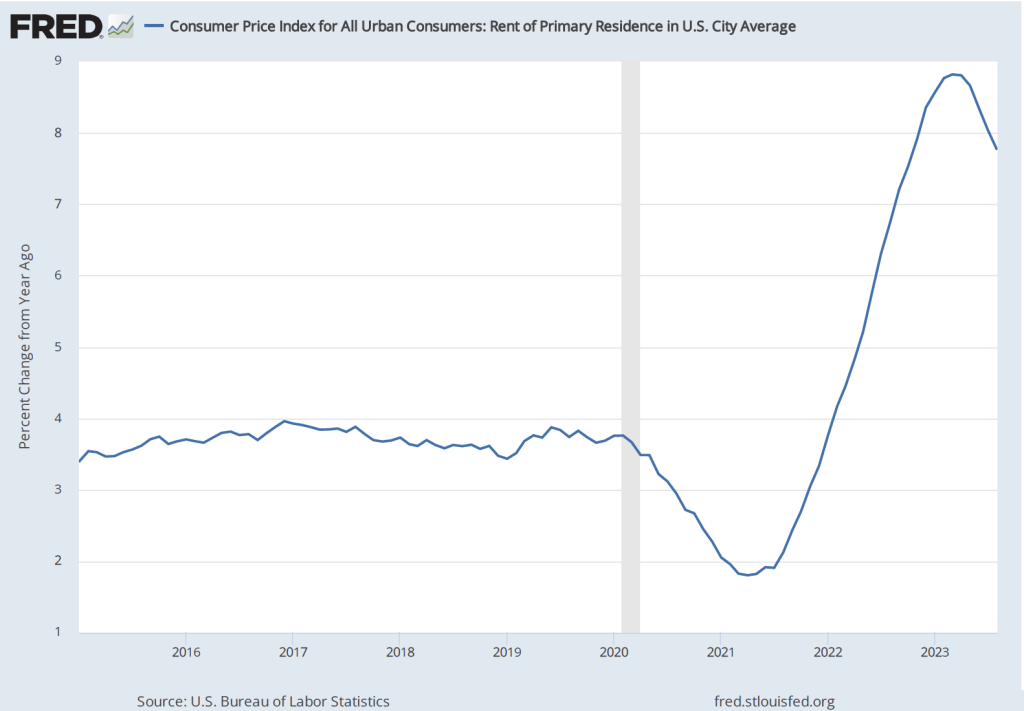
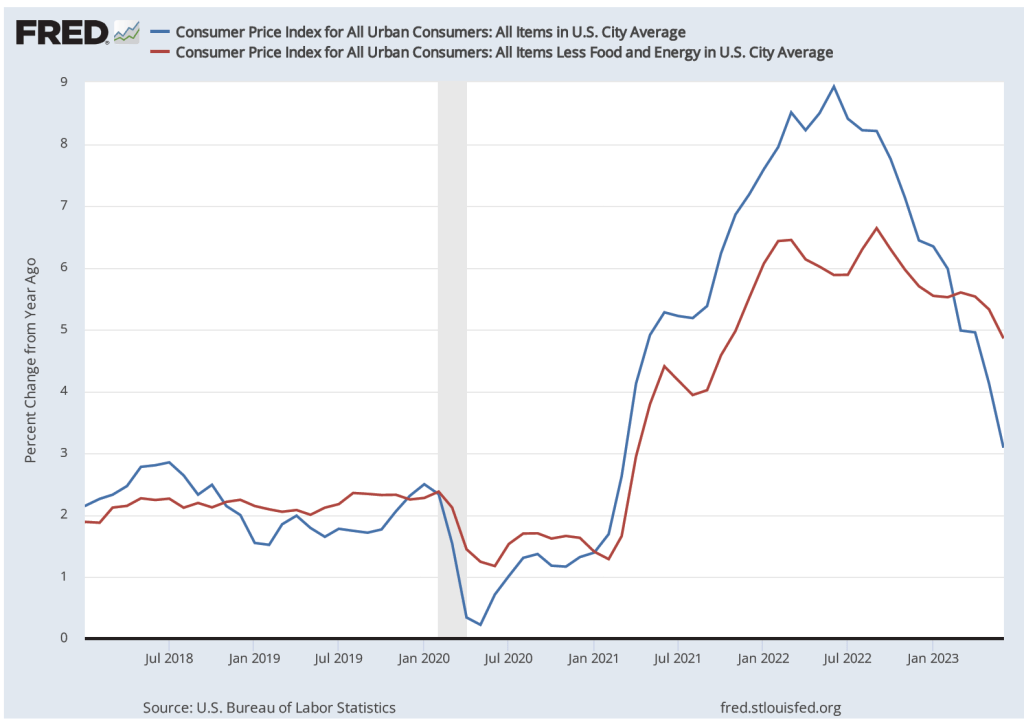
Some economists use other adjustments to PCE or to the consumer price index (CPI) in an attempt to better measure underlying inflation. For instance, housing rents and new and used car prices have been particularly volatile since early 2020, so some economists calculate PCE or CPI excluding those prices, as well as food and energy prices. As we discuss in this blog post from last September some economists prefer median CPI as the best measure of underlying inflation. (We discuss some of the alternative ways of measuring inflation in Macroeconomics, Chapter 15, Section 15.5 and Economics, Chapter 25, Section 25.5.) Nearly all these alternative measures of inflation indicated that the moderation in inflation that began in the summer of 2022 had ended in January 2023. So, choosing among measures of underlying inflation wasn’t critical to understanding the current path of inflation. 

Finally, the inflation, employment, and output measures that in January seemed to show that the U.S. economy was still in a strong expansion and that the inflation rate may have ticked up are all seasonally adjusted. Seasonal adjustment factors are applied to the raw (unadjusted) data to account for regular seasonal fluctuations in the series. For instance, unadjusted employment declined in January as measured by both the household and establishment series. Applying the seasonal adjustment factors to the data resulted in the actual decline in employment from December to January turning into an adjusted increase. In other words, employment declined by less than it typically does, so on a seasonally adjusted basis, the Bureau of Labor Statistics reported that it had increased. Seasonal adjustments for the holiday season may be distorted, however, because the 2020–2021 and 2021–2022 holiday seasons occurred during upsurges in Covid. Whether the reported data for January 2023 will be subject to significant revisions when the seasonal adjustments factors are subsequently revised remains to be seen.  The latest BLS employment report, showing seasonally adjusted and not seasonally adjusted data, can be found here.

How Should We Measure Inflation?

Image from the Wall Street Journal.

In the textbook, we discuss several measures of inflation. In Macroeconomics, Chapter 8, Section 8.4 (Economics, Chapter 18, Section 18.4) we discuss the GDP deflator as a measure of the price level and the percentage change in the GDP deflator as a measure of inflation. In Chapter 9, Section 9.4, we discuss the consumer price index (CPI) as a measure of the price level and the percentage change in the CPI as the most widely used measure of inflation. 

            In Chapter 15, Section 15.5 we examine the reasons that the Federal Reserve often looks at the core inflation rate—the inflation rate excluding the prices of food and energy—as a better measure of the underlying rate of inflation. Finally, in that section we note that the Fed uses the percentage change in the personal consumption expenditures (PCEprice index to assess  of whether it’s achieving its goal of a 2 percent inflation rate.

            In this blog post, we’ll discuss two other aspects of measuring inflation that we don’t cover in the textbook. First, the Bureau of Labor Statistics (BLS) publishes two versions of the CPI:  (1) The familiar CPI for all urban consumers (or CPI–U), which includes prices of goods and services purchased by households in urban areas, and (2) the less familiar CPI for urban wage earners and clerical workers (or CPI–W), which includes the same prices included in the CPI–U. The two versions of the CPI give slightly different measures of the inflation rate—despite including the same prices—because each version applies different weights to the prices when constructing the index.

            As we explain in Chapter 9, Section 9.4, the weights in the CPI–U (the only version of the CPI we discuss in the chapter) are determined by a survey of 36,000 households nationwide on their spending habits. The more the households surveyed spend on a good or service, the larger the weight the price of the good or service receives in the CPI–U. To calculate the weights in the CPI–W the BLS uses only expenditures by households in which at least half of the household’s income comes from a clerical or wage occupation and in which at least one member of the household has worked 37 or more weeks during the previous year.  The BLS estimates that the sample of households used in calculating the CPI–U includes about 93 percent of the population of the United States, while the households included in the CPI–W include only about 29 percent of the population. 

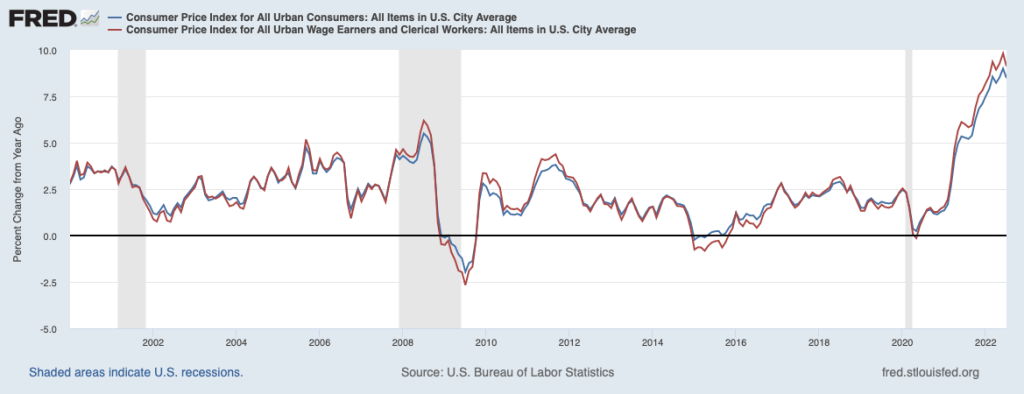
            Because the percentage of the population covered by the CPI–U is so much larger than the percentage of the population covered by the CPI–W, it’s not surprising that most media coverage of inflation focuses on the CPI–U. As the following figure shows, the measures of inflation from the two versions of the CPI aren’t greatly different, although inflation as measured by the CPI–W—the red line—tends to be higher during economic expansions and lower during economic recessions than inflation measured by the CPI–U—the blue line. 

One important use of the CPI–W is in calculating cost-of-living adjustments (COLAs) applied to Social Security payments retired and disabled people receive. Each year, the federal government’s Social Security Administration (SSA) calculates the average for the CPI–W during June, July, and August in the current year and in the previous year and then measures the inflation rate as the percentage increase between the two averages. The SSA then increases Social Security payments by that inflation rate. Because the increase in CPI–W is often—although not always—larger than the increase in CPI–U, using CPI–W to calculate Social Security COLAs increases the payments recipients of Social Security receive. 

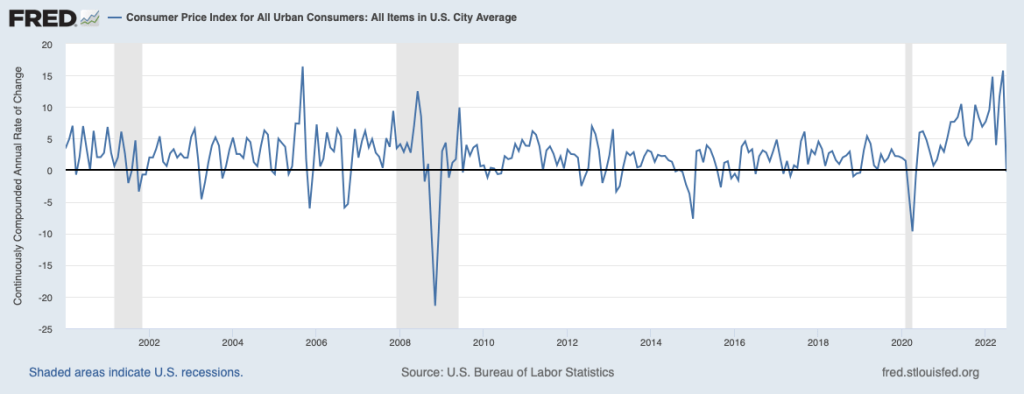
            A second aspect of measuring inflation that we don’t mention in the textbook was the subject of discussion following the release of the July 2022 CPI data. In June 2022, the value for the CPI–U was 295.3. In July 2022, the value for the CPI–U was also 295.3. So, was there no inflation during July—an inflation rate of 0 percent? You can certainly make that argument, but typically, as we note in the textbook (for instance, see our display of the inflation rate in Chapter 10, Figure 10.7) we measure the inflation rate in a particular month as the percentage change in the CPI from the same month in the previous year. Using that approach to measuring inflation, the inflation rate in July 2022 was the percentage change in the CPI from its value in July 2021, or 8.5 percent.  Note that you could calculate an annual inflation rate using the increase in the CPI from one month to the next by compounding that rate over 12 months. In this case, because the CPI was unchanged from June to July 2022, the inflation rate calculated as a compound annual rate would be 0 percent.  

            During periods of moderate inflation rates—which includes most of the decades prior to 2021—the difference between inflation calculated in these two ways was typically much smaller. Focusing on just the change in the CPI for one month has the advantage that you are using only the most recent data. But if the CPI in that month turns out to be untypical of what is happening to inflation over a longer period, then focusing on that month can be misleading. Note also that inflation rate calculated as the compound annual change in the CPI each month results in very large fluctuations in the inflation rate, as shown in the following figure.

Sources: Anne Tergesen, “Social Security Benefits Are Heading for the Biggest Increase in 40 Years,” Wall Street Journal, August 10, 2022; Neil Irwin, “Inflation Drops to Zero in July Due to Falling Gas Prices,” axios.com, August 10, 2022; “Consumer Price Index Frequently Asked Questions,” bls.gov, March 23, 2022; Stephen B. Reed and Kenneth J. Stewart, “Why Does BLS Provide Both the CPI–W and CPI–U?” U.S. Bureau of Labor Statistics, Beyond the Numbers, Vol. 3, No. 5, February 2014; “Latest Cost of Living Adjustment,” ssa.gov; and Federal Reserve Bank of St. Louis.