The Latest PCE Report and PCE Inflation v. CPI Inflation

Photo courtesy of Lena Buonanno.

Wall Street Journal columnist Justin Lahart notes that when the Bureau of Labor Statistics (BLS) releases its monthly report on the consumer price index (CPI), the report “generates headlines, features in politicians’ speeches and moves markets.” When the Bureau of Economic Analysis (BEA) releases its monthly report “Personal Income and Outlays,” which includes data on the personal consumption expenditures (PCE) price index, there is much less notice in the business press or, often, less effect on financial markets. (You can see the difference in press coverage by comparing the front page of today’s online edition of the Wall Street Journal after the BEA released the latest PCE data with the paper’s front page on February 13 when the BLS released the latest CPI data.)

This difference in the weight given to the two inflation reports seems curious because the Federal Reserve uses the PCE, not the CPI, to determine whether it is achieving its 2 percent annual inflation target. When a new monthly measure of inflation is released much of the discussion in the media is about the effect the new data will have on the Federal Open Market Committee’s (FOMC) decision on whether to change its target for the federal funds rate. You might think the result would be greater media coverage of the PCE than the CPI. (The PCE includes the prices of all the goods and services included in the consumption component of GDP. Because the PCE includes the prices of more goods and services than does the CPI, it’s a broader measure of inflation, which is the key reason that the Fed prefers it.)

That CPI inflation data receive more media discussion than PCE inflation data is likely due to three factors:

  1. The CPI is more familiar to most people than the PCE. It is also the measure that politicians and political commentators tend to focus on. The media are more likely to highlight a measure of inflation that the average reader easily understands rather than a less familiar measure that would require an explanation. 
  2. The monthly report on the CPI is typically released about two weeks before the monthly report on the PCE. Therefore, if the CPI measure of inflation turns out to be higher or lower than expected, the stock and bond markets will react to this new information on the value of inflation in the previous month. If the PCE measure is roughly consistent with the CPI measure, then the release of new data on the PCE measure contains less new information and, therefore, has a smaller effect on stock and bond prices.
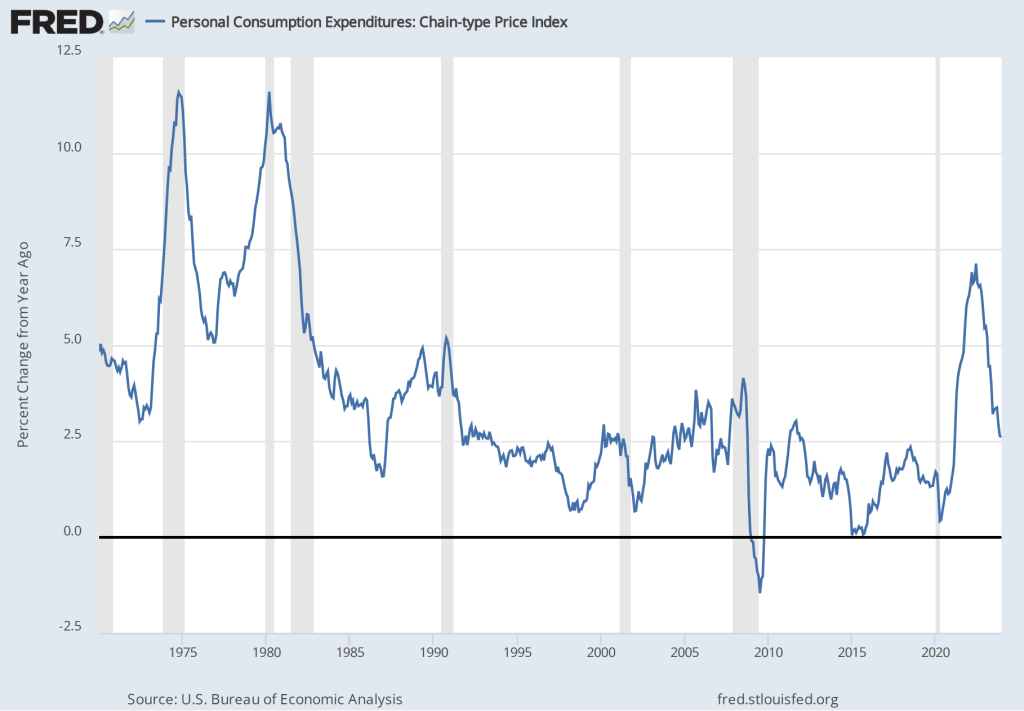
  3. Over longer periods, the two measures of inflation often move fairly closely together as the following figure shows, although CPI inflation tends to be somewhat higher than PCE inflation. The values of both series are the percentage change in the index from the same month in the previous year.

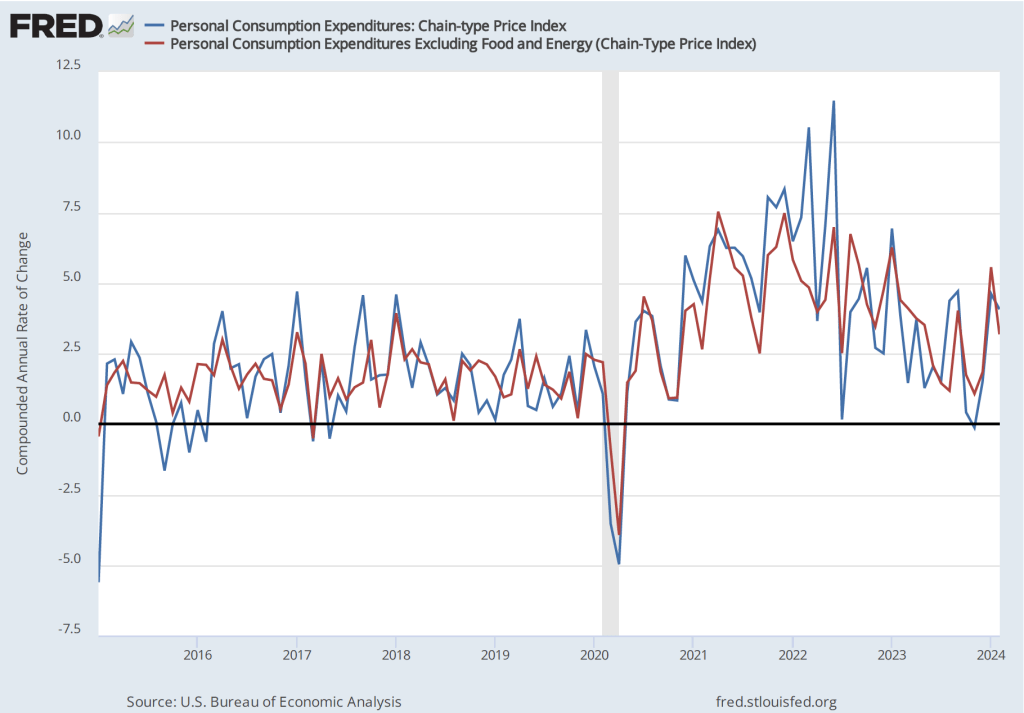
Turning to the PCE data for January released in the BEA’s latest “Personal Income and Outlays” report, the PCE inflation data were broadly consistent with the CPI data: Inflation in January increased somewhat from December. The first of the following figures shows PCE inflation and core PCE inflation—which excludes energy and food prices—for the period since January 2015 with inflation measured as the change in PCE from the same month in the previous year.  The second figure shows PCE inflation and core PCE inflation measured as the inflation rate calculated by compounding the current month’s rate over an entire year. (The first figure shows what is sometimes called 12-month inflation and the second figure shows 1-month inflation.)

The two inflation measures are telling markedly different stories: 12-month inflation shows a continuation in the decline in inflation that began in 2022. Twelve-month PCE inflation fell from 2.6 percent in December to 2.4 percent in January. Twelve-month core PCE inflation fell from 2.9 percent in December to 2.8 percent in December. So, by this measure, inflation continues to approach the Fed’s 2 percent inflation target.

One-month PCE and core PCE inflation both show sharp increases from December to January: From 1.4 percent in December to 4.2 percent for 1-month PCE inflation and from 1.8 percent in December to 5.1 percent in January for 1-month core PCE inflation.

The one-month inflation data are bad news in that they may indicate that inflation accelerated in January and that the Fed is, therefore, further away than it seemed in December from hitting its 2 percent inflation target. But it’s important not to overinterpret a single month’s data. Although 1-month inflation is more volatile than 12-month inflation, the broad trend in 1-month inflation had been downwards from mid-2022 through December 2023. It will take at least a more months of data to assess whether this trend has been broken.

Fed officials didn’t appear to be particularly concerned by the news. For instance, according to an article on bloomberg.com, Federal Reserve Bank of Atlanta President Raphael Bostic noted that: “The last few inflation readings—one came out today—have shown that this is not going to be an inexorable march that gets you immediately to 2%, but that rather there are going to be some bumps along the way.” Investors appear to continue to expect that the Fed will cut its target for the federal funds rate at its meeting on June 11-12.

Surprisingly Strong CPI Report

Photo courtesy of Lena Buonanno.

As we’ve discussed in several blog posts (for instance, here and here), recent macro data have been consistent with the Federal Reserve being close to achieving a soft landing. The Fed’s increases in its target for the federal funds rate have slowed the growth of aggregate demand sufficiently to bring inflation closer to the Fed’s 2 percent target, but haven’t, to this point, slowed the growth of aggregate demand so much that the U.S. economy has been pushed into a recession.

By January 2024, many investors in financial markets and some economists were expecting that at its meeting on March 19-20, the Fed’s Federal Open Market Committee would be cutting its target for the federal funds. However, members of the committee—notably, Chair Jerome Powell—have been cautious about assuming prematurely that inflation had, in fact, been brought under control. In fact, in his press conference on January 31, following the committee’s most recent meeting, Powell made clear that the committee was unlikely to reduce its target for the federal funds rate at its March meeting. Powell noted that “inflation is still too high, ongoing progress in bringing it down is not assured, and the path forward is uncertain.”

Powell’s caution seemed justified when, on February 2, the Bureau of Labor Statistics (BLS) released its most recent “Employment Situation Report” (discussed in this post). The report’s data on growth in employment and growth in wages, as measured by the change in average hourly earnings, might be indicating that aggregate demand is growing too rapidly for inflation to continue to decline.

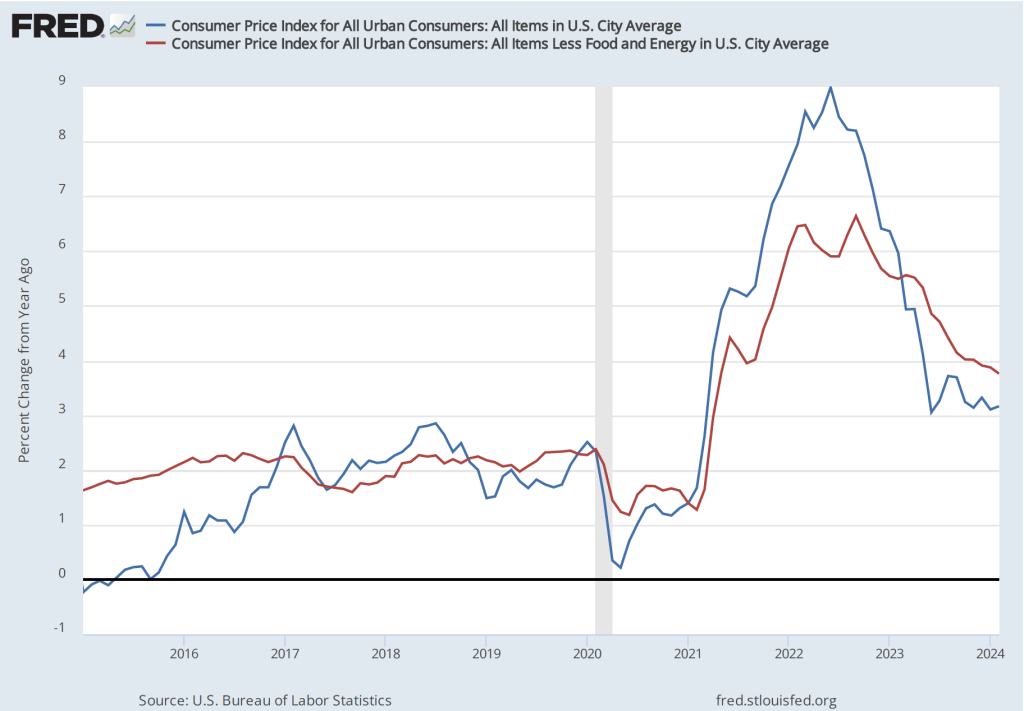
The BLS’s release today (February 13) of its report on the consumer price index (CPI) (found here) for January provided additional evidence that the Fed may not yet have put inflation on a firm path back to its 2 percent target. The average forecast of economists surveyed before the release of the report was that the increase in the version of the CPI that includes the prices of all goods and services in the market basket—often called headline inflation—would be 2.9 percent. (We discuss how the BLS constructs the CPI in Macroeconomics, Chapter 9, Section 19.4, Economics, Chapter 19, Section 19.4, and Essentials of Economics, Chapter 3, Section 13.4.) As the following figure shows, headline inflation for January was higher than expected at 3.1 percent (measured by the percentage change from the same month in the previous year), while core inflation—which excludes the prices of food and energy—was 3.9 percent. Headline inflation was lower than in December 2023, while core inflation was almost unchanged.

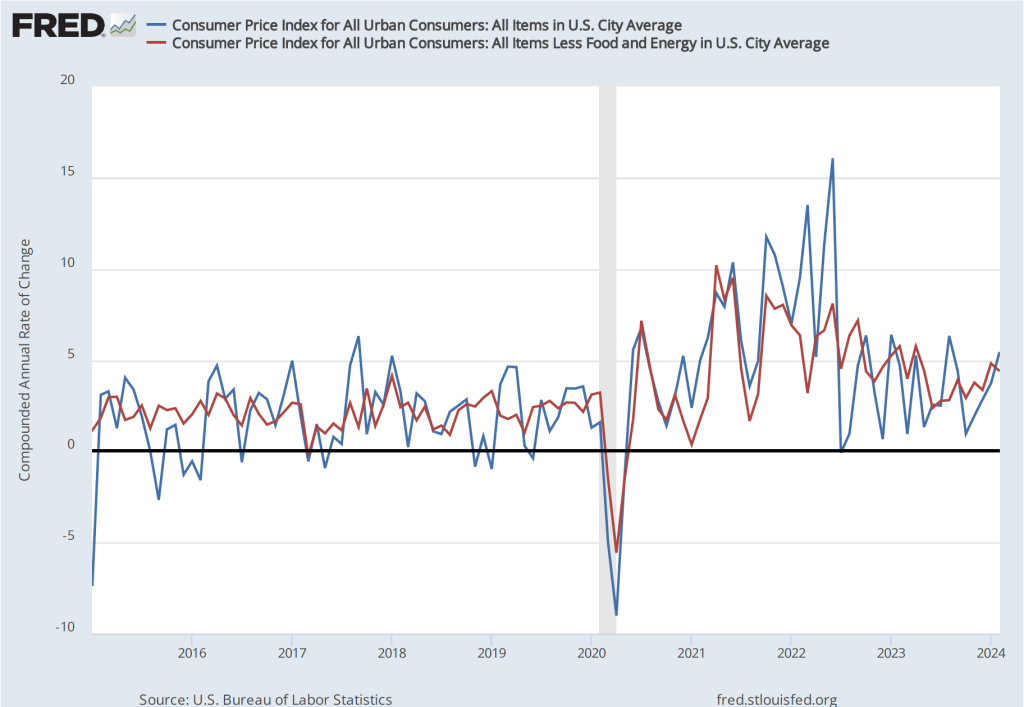
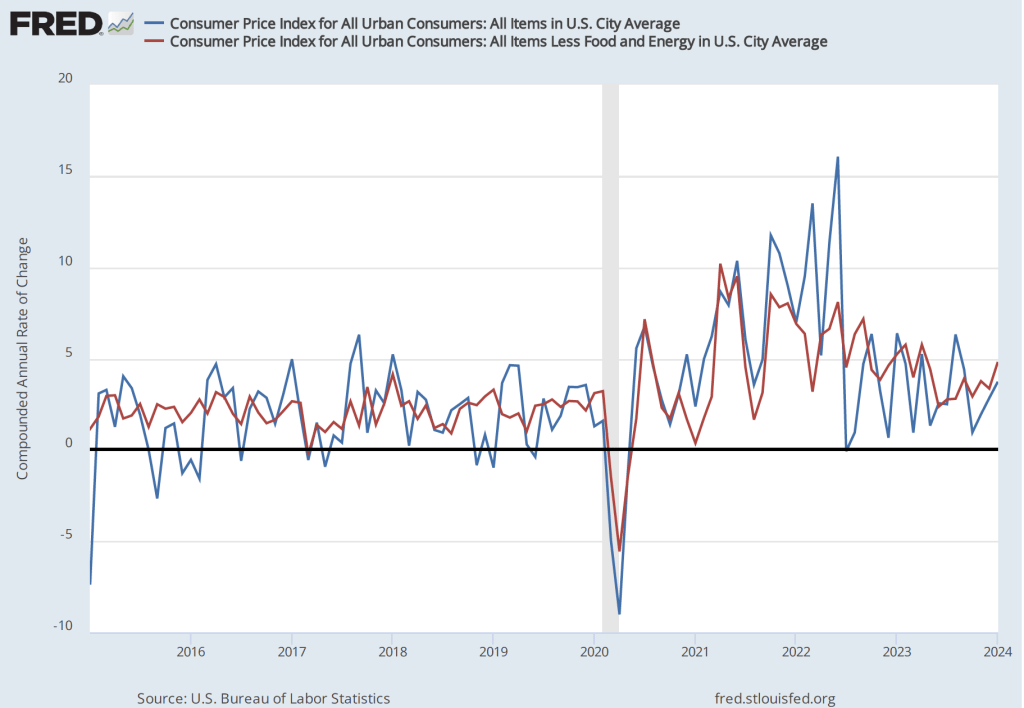
Although the values for January might seem consistent with a gradual decline in inflation, that conclusion may be misleading. Headline inflation in January 2023 had been surprisingly high at 6.4 percent. Hence, the comparision between the value of the CPI in January 2024 with the value in January 2023 may be making the annual CPI inflation rate seem artificially low. If we look at the 1-month inflation rate for headline and core inflation—that is the annual inflation rate calculated by compounding the current month’s rate over an entire year—the values are more concerning, as indicated in the following figure. Headline CPI inflation is 3.7 percent and core CPI inflation is 4.8 percent.

Even more concerning is the path of inflation in the prices of services. Chair Powell has emphasized that as supply chain problems have gradually been resolved, inflation in the prices of goods has been rapidly declining. But inflaion in services hasn’t declined nearly as much. Last summer he stated the point this way:

“Part of the reason for the modest decline of nonhousing services inflation so far is that many of these services were less affected by global supply chain bottlenecks and are generally thought to be less interest sensitive than other sectors such as housing or durable goods. Production of these services is also relatively labor intensive, and the labor market remains tight. Given the size of this sector, some further progress here will be essential to restoring price stability.”

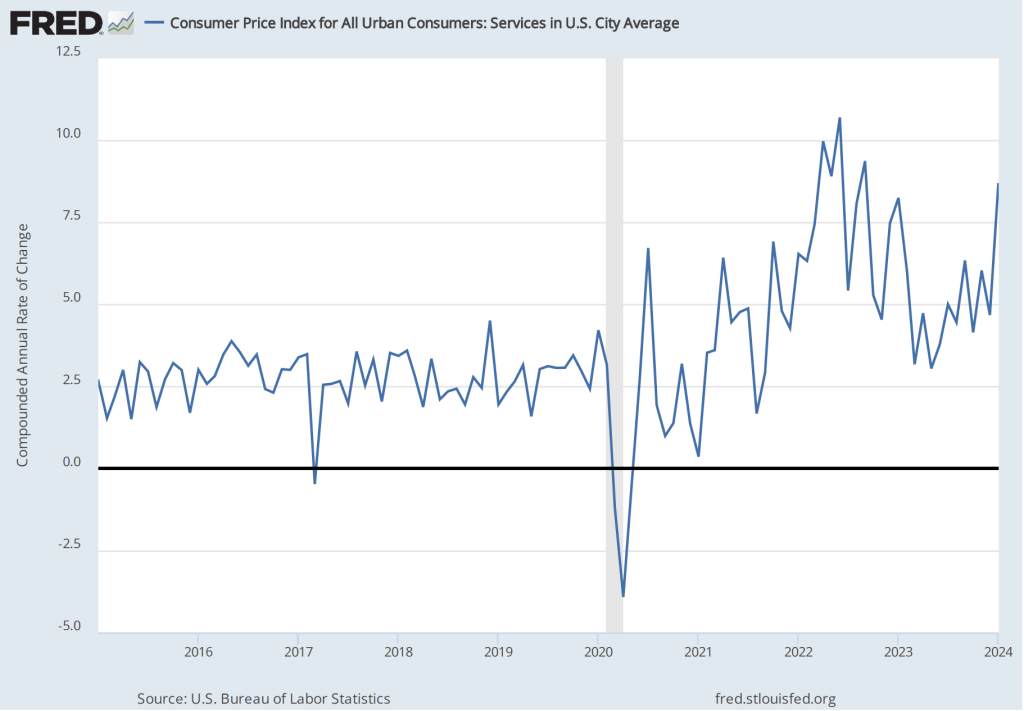
The following figure shows the 1-month inflation rate in services prices. The figure shows that inflation in services has been above 4 percent in every month since July 2023. Inflation in services was a very high 8.7 percent in January. Clearly such large increases in the prices of services aren’t consistent with the Fed meeting its 2 percent inflation target.

How should we interpret the latest CPI report? First, it’s worth bearing in mind that a single month’s report shouldn’t be relied on too heavily. There can be a lot of volatility in the data month-to-month. For instance, inflation in the prices of services jumped from 4.7 percent in December to 8.7 percent in January. It seems unlikely that inflation in the prices of services will continue to be over 8 percent.

Second, housing prices are a large component of service prices and housing prices can be difficult to measure accurately. Notably, the BLS includes in its measure the implicit rental price that someone who owns his or her own home pays. The BLS calculates that implict rental price by asking consumers who own their own homes the following question: “If someone were to rent your home today, how much do you think it would rent for monthly, unfurnished and without utilities?” (The BLS discusses how it measures the price of housing services here.) In practice, it may be difficult for consumers to accurately answer the question if very few houses similar to theirs are currently for rent in their neighborhood.

Third, the Fed uses the personal consumption expenditures (PCE) price index, not the CPI, to gauge whether it is achieving its 2 percent inflation target. The Bureau of Economic Analysis (BEA) includes the prices of more goods and services in the PCE than the BLS includes in the CPI and measures housing services using a different approach than that used by the BLS. Although inflation as measured by changes in the CPI and as measured by changes in the PCE move roughly together over long periods, the two measures can differ significantly over a period of a few months. The difference between the two inflation measures is another reason not to rely too heavily on a single month’s CPI data.

Despite these points, investors on Wall Street clearly interpreted the CPI report as bad news. Investors have been expecting that the Fed will soon cut its target for the federal funds rate, which should lead to declines in other key interest rates. If inflation continues to run well above the Fed’s 2 percent target, it seems likely that the Fed will keep its federal funds target at its current level for longer, thereby slowing the growth of aggregate demand and raising the risk of a recession later this year. Accordingly, the Dow Jones Industrial Average declined by more than 500 points today (February 13) and the interest rate on the 10-year Treasury note rose above 4.3 percent.

The FOMC has more than a month before its next meeting to consider the implications of the latest CPI report and the additional macro data that will be released in the meantime.

FOMC Meeting: Steady as She Goes

Federal Reserve Chair Jerome Powell (Photo from the New York Times.)

This afternoon, Wednesday, January 31, the Federal Reserve’s Federal Open Market Committee (FOMC) held the first of its eight scheduled meetings during 2024. As we noted in a recent post, macroeconomic data have been indicating that the Fed is close to achieving its goal of bringing the U.S. economy in for a soft landing—reducing inflation down to the Fed’s 2 percent target without pushing the economy into a recession. But as we also noted in that post, it was unlikely that at this meeting Fed Chair Jerome Powell and the other members of the FOMC would declare victory in their fight to reduce inflation from the high levels it reached during 2022.

In fact, in Powell’s press conference following the meeting, when asked directly by a reporter whether he believed that the economy had made a safe landing, Powell said that he wasn’t yet willing to draw that conclusion. Accordingly, the committee kept its target range for the federal funds rate unchanged at 5.25 percent to 5.50 percent. This was the fifth meeting in a row at which the FOMC had left the target unchanged. Although some policy analysts expect that the FOMC might reduce its federal funds rate target at its next meeting in March, the committee’s policy statement made that seem unlikely:

“In considering any adjustments to the target range for the federal funds rate, the Committee will carefully assess incoming data, the evolving outlook, and the balance of risks. The Committee does not expect it will be appropriate to reduce the target range until it has gained greater confidence that inflation is moving sustainably toward 2 percent.”

Powell reinforced the point during his press conference by stating it was unlikely that the committee would cut the target rate at the next meeting. He noted that:

“The economy has surprised forecasters in many ways since the pandemic, and ongoing progress toward our 2 percent inflation objective is not assured. The economic outlook is uncertain, and we remain highly attentive to inflation risks. We are prepared to maintain the current target range for the federal funds rate for longer, if appropriate.”

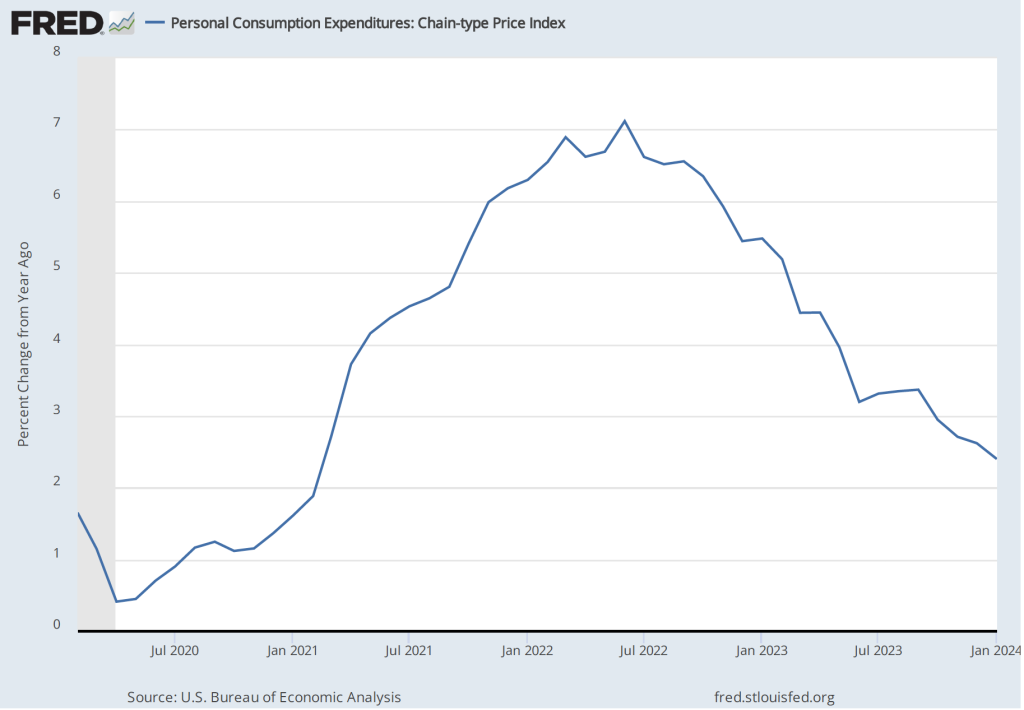
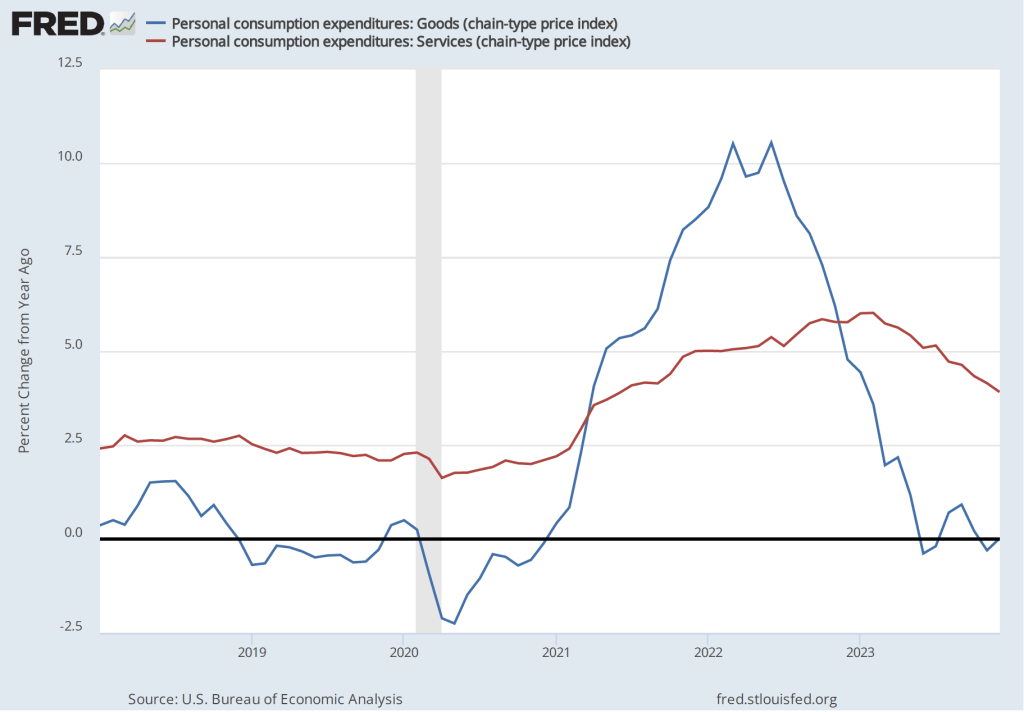
Powell highlighted a couple of areas of potential concern. The Fed gauges its progress towards achieving its 2 percent inflation goal using the percentage change in the personal consumption expenditures (PCE) price index. As we noted in a recent post, PCE inflation has declined from a high of 7.1 percent in June 2022 to 2.9 percent in December 2023. But Powell noted that PCE inflation in goods has followed a different path from PCE inflation in services, as the following figure shows.

Inflation during 2022 was much greater in the prices of goods than in the prices of services, reflecting the fact that supply chain disruptions caused by the pandemic had a greater effect on goods than on services. Inflation in goods has been less than 1 percent every month since June 2023 and has been negative in three of those months. Inflation in services peaked in February 2023 at 6.0 percent and has been declining since, but was still 3.9 percent in December. Powell noted that the very low rates of inflation in the prices of goods probably aren’t sustainable. If inflation in the prices of goods increases, the Fed may have difficulty achieving its 2 percent inflation target unless inflation in the prices of services slows.

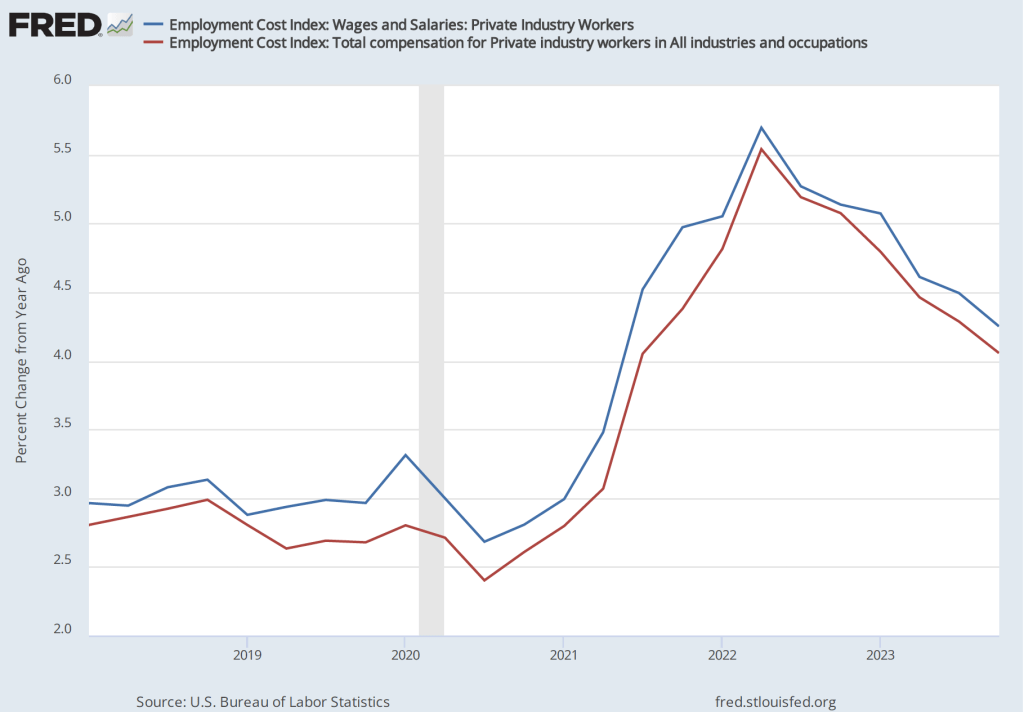
Powell also noted that the most recent data on the employment cost index (ECI) had been released the morning of the meeting. The ECI is compiled by the Bureau of Labor Statistics and is published quarterly. It measures the cost to employers per employee hour worked. The BLS publishes data that includes only wages and salaries and data that includes, in addition to wages and salaries, non-wage benefits—such as contributions to retirement accounts or health insurance—that firms pay workers. The figure below shows the percentage change from the same month in the previous year for the ECI including just wages and salaries (blue line) and for the ECI including all compensation (red line). Although ECI inflation has declined significantly from its peak in he second quarter of 2022, in the fourth quarter of 2023, both measures of ECI inflation were above 4 percent. Wages increasing at that pace may not be consistent with a 2 percent rate of price inflation.

Powell’s tone at his news conference (which can be watched here) was one of cautious optimism. He and the other committee members expect to be able to cut the target for the federal funds rate later this year but remain on guard for any indications that the inflation rate is increasing again.

Has the Federal Reserve Achieved a Soft Landing?

The Federal Reserve building in Washington, DC. (Photo from the New York Times.)

Since inflation began to increase rapidly in the late spring of 2021, the key macroeconomic question has been whether the Fed would be able to achieve a soft landing—pushing inflation back to its 2 percent target without causing a recession. The majority of the members of the Fed’s Federal Open Market Committee (FOMC) believed that increases in inflation during 2021 were largely caused by problems with supply chains resulting from the effects of the Covid–19 pandemic. 

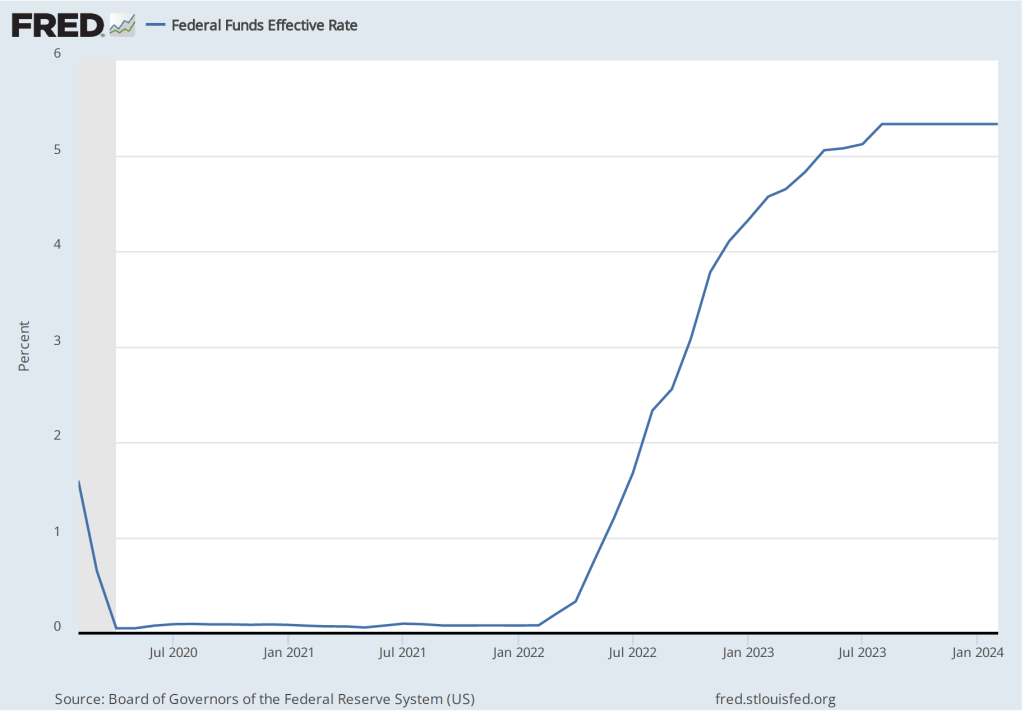
These committee members believed that once supply chains returned to normal, the increase in he inflation rate would prove to have been transitory—meaning that the inflation rate would decline without the need for the FOMC to pursue a contractionary monetary by substantially raising its target range for the federal funds rate. Accordingly, the FOMC left its target range unchanged at 0 to 0.25 percent until March 2022. As the following figure shows, by that time the inflation rate had increased to 6.9 percent, the highest it had been since January 1982. (Note that the figure shows inflation as measured by the percentage change from the same month in the previous year in the personal consumption expenditures (PCE) price index. Inflation as measured by the PCE is the gauge the Fed uses to determine whether it is achieving its goal of 2 percent inflation.)

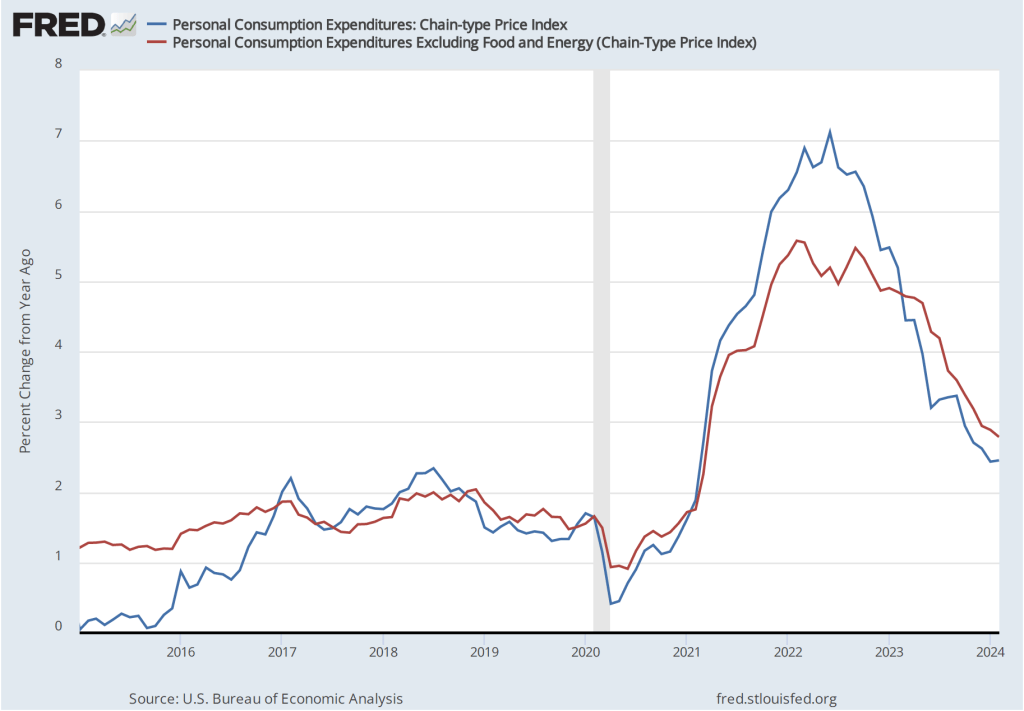
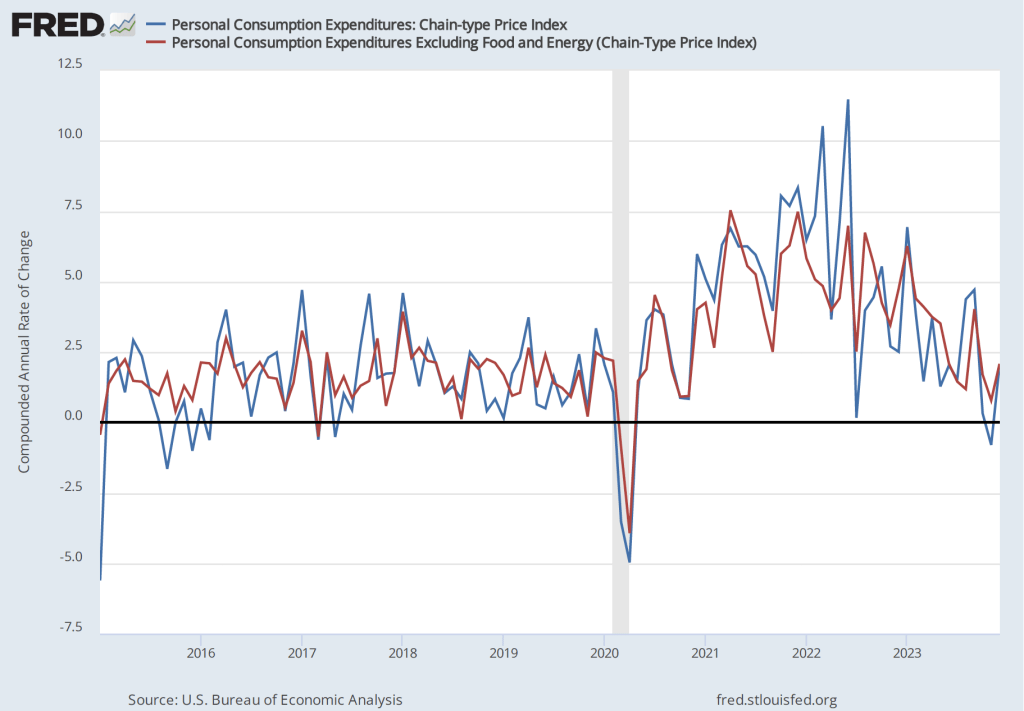
By the time inflation reached its peak in mid-2022, many economists believed that the FOMC’s decision to delay increasing the federal funds rate until March 2022 had made it unlikely that the Fed could return inflation to 2 percent without causing a recession.  But the latest macroeconomic data indicate that—contrary to that expectation—the Fed does appear to have come very close to achieving a soft landing.  On January 26, the Bureau of Economic Analysis (BEA) released data on the PCE for December 2023. The following figure shows for the period since 2015, inflation as measured by the percentage change in the PCE from the same month in the previous year (the blue line) and as measured by the percentage change in the core PCE, which excludes the prices of food and energy (the red line).  

The figure shows that PCE inflation continued its decline, falling slightly in December to 2.6 percent. Core PCE inflation also declined in December to 2.9 percent from 3.2 percent in November. Note that both measures remained somewhat above the Fed’s inflation target of 2 percent.

If we look at the 1-month inflation rate—that is the annual inflation rate calculated by compounding the current month’s rate over an entire year—inflation is closer to Fed’s target, as the following figure shows. The 1-month PCE inflation rate has moved somewhat erratically, but has generally trended down since mid-2022. In December, PCE inflation increased from from –0.8 percent in November (which acutally indicates that deflation occurred that month) to 2.0 percent in December. The 1-month core PCE inflation rate has moved less erratically, also trending down since mid-2022. In December, the 1-month core PCE inflation increased from 0.8 percent in November to 2.1 percent in December. In other words, the December reading on inflation indicates that inflation is very close to the Fed’s target.

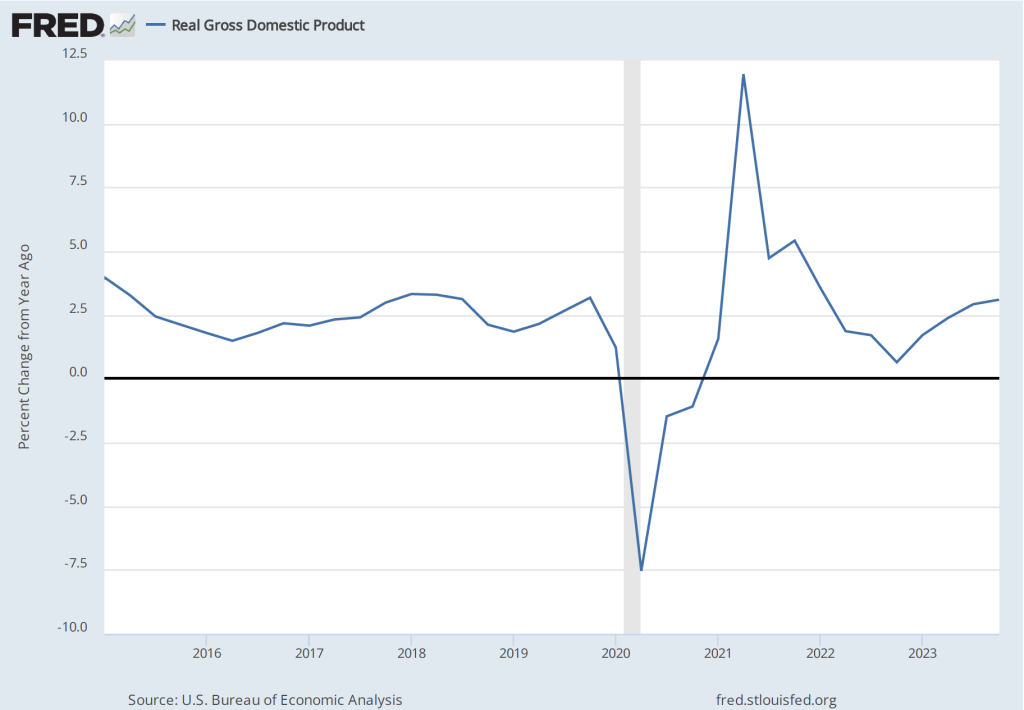
The following figure shows for each quarter since the beginning of 2015, the growth rate of real GDP measured as the percentage change from the same quarter in the previous year. The figure indicates that although real GDP growth dropped to below 1 percent in the fourth quarter of 2022, the growth rate rose during each quarter of 2023. The growth rate of 3.1 percent in the fourth quarter of 2023 remained well above the FOMC’s 1.8 percent estimate of long-run economic growth. (The average of the members of the FOMC’s estimates of the long-run growth rate of real GDP can be found here.) To this point, there is no indication from the GDP data that the U.S. economy is in danger of experiencing a recession in the near future.

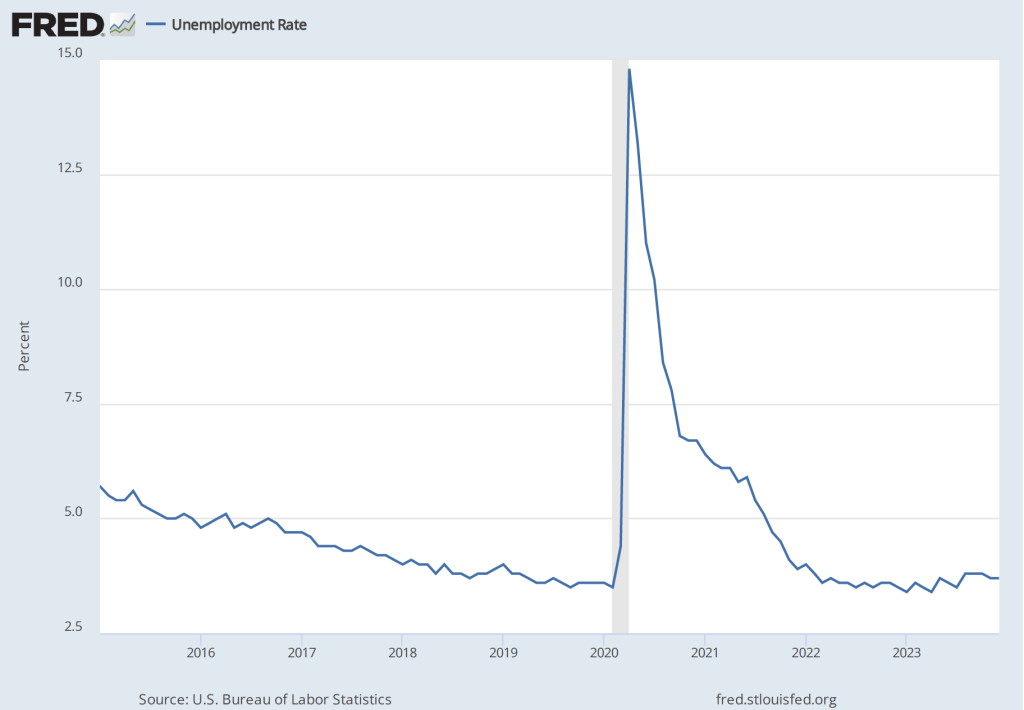
The labor market also shows few signs of a recession, as indicated by the following figure, which shows the unemployment rate in the months since January 2015. The unemployment rate has remained below 4 percent in each month since December 2021. The unemployment rate was 3.7 percent in December 2023, below the FOMC’s projection of a long-run unemployment rate of 4.1 percent.

The FOMC’s next meeting is on Tuesday and Wednesday of this week (February 1-2). Should we expect that at that meeting Fed Chair Jerome Powell will declare that the Fed has succeeded in achieving a soft landing? That seems unlikely. Powell and the other members of the committee have made clear that they will be cautious in interpreting the most recent macroeconomic data. With the growth rate of real GDP remaining above its long run trend and the unemployment rate remaining below most estimates of the natural rate of unemployment, there is still the potential that aggregate demand will increase at a rate that might cause the inflation rate to once again rise.

In a speech at the Brookings Institution on January 16, Fed Governor Christopher Waller echoed what appear to be the views of most members of the FOMC:

“Time will tell whether inflation can be sustained on its recent path and allow us to conclude that we have achieved the FOMC’s price-stability goal. Time will tell if this can happen while the labor market still performs above expectations. The data we have received the last few months is allowing the Committee to consider cutting the policy rate in 2024. However, concerns about the sustainability of these data trends requires changes in the path of policy to be carefully calibrated and not rushed. In the end, I am feeling more confident that the economy can continue along its current trajectory.”

At his press conference on February 1, following the FOMC meeting, Chair Powell will likely provide more insight into the committee’s current thinking.

Another Middling Inflation Report

Photo courtsey of Lena Buonanno.

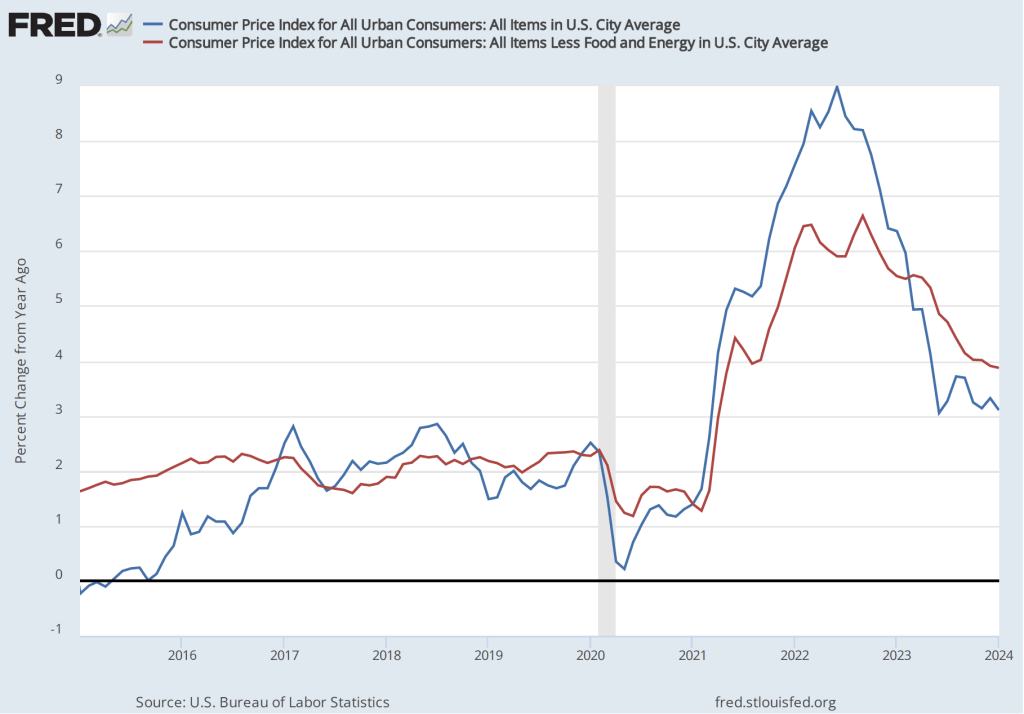
On the morning of January 11, 2024, the Bureau of Labor Statistics released its report on changes in consumer prices during December 2023. The report indicated that over the period from December 2022 to December 2023, the Consumer Price Index (CPI) increased by 3.4 percent (often referred to as year-over-year inflation). “Core” CPI, which excludes prices for food and energy, increased by 3.9 percent. The following figure shows the year-over-year inflation rate since Januar 2015, as measured using the CPI and core CPI.

This report was consistent with other recent reports on the CPI and on the personal consumption expenditures (PCE) price index—the measure the Fed uses to gauge whether it is achieving its target of 2 percent annual inflation—in showing that inflation has declined substantially from its peak in mid-2022 but is still above the Fed’s target.

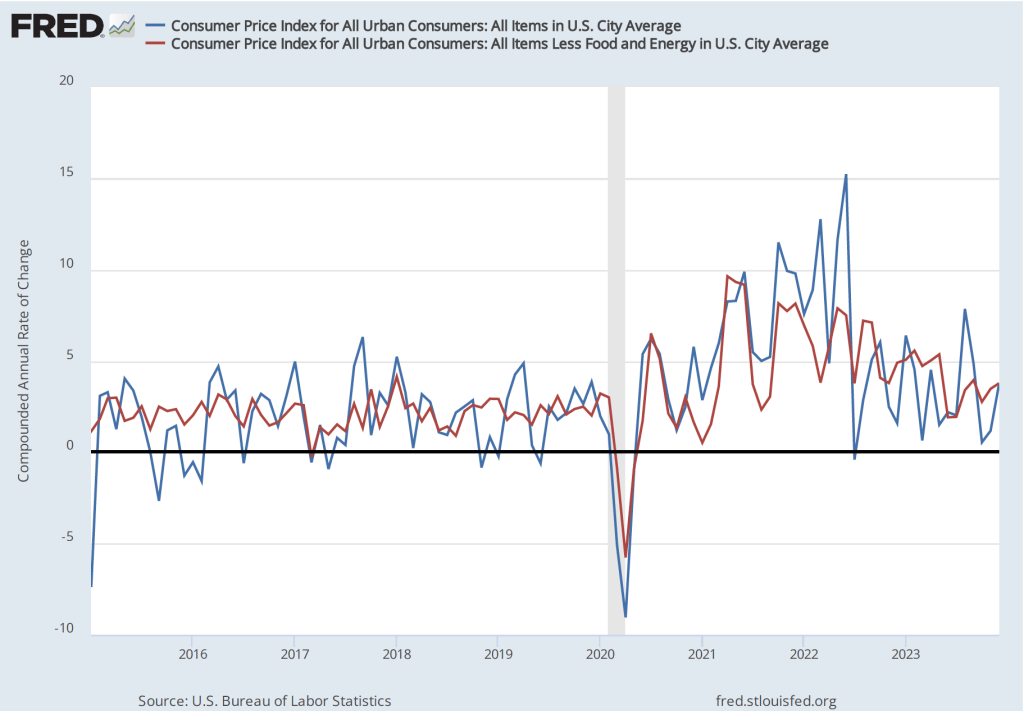
We get a similar result if we look at the 1-month inflation rate—that is the annual inflation rate calculated by compounding the current month’s rate over an entire year—as the following figure shows. The 1-month CPI inflation rate has moved erratically but has generally trended down. The 1-month core CPi inflation rate has moved less erratically, making the downward trend since mid-2022 clearer.

The headline on the Wall Street Journal article discussing this BLS report was: “Inflation Edged Up in December After Rapid Cooling Most of 2023.” The headline reflected the reaction of Wall Street investors who had hoped that the report would unambiguously show further slowing in inflation.
Overall, the report was middling: It didn’t show a significant acceleration in inflation at the end of 2023 but neither did it show a signficant slowing of inflation. At its next meeting on January 30-31, the Fed’s Federal Open Market Committee (FOMC) is expected to keep its target for the federal funds rate unchanged. There doesn’t appear to be anything in this inflation report that would be likely to affect the committee’s decision.
Can We Now Rule Out One of the Three Potential Monetary Policy Outcomes?

Federal Reserve Chair Jerome Powell (photo from bloomberg.com)

In a blog post from February of this year, we discussed three possible outcomes of the contractionary monetary policy that the Federal Reserve has been pursuing since March 2022, when the Federal Open Market Committee (FOMC) began raising its target range for the federal funds rate:

  1.  A soft landing. The Fed’s preferred outcome; inflation returns to the Fed’s target of 2 percent without the economy falling into recession.
  2. A hard landing. Inflation returns to the Fed’s 2 percent target, but the economy falls into a recession.
  3. No landing. At the beginning of 2023, the unemployment remained very low and inflation, as measured by the percentage change in the personal consumption expenditures (PCE) price index from the same month in the previous year, was still above 5 percent. So, some observers, particularly in Wall Street financial firms, began discussing the possibility that low unemployment and high inflation might persist indefinitely, resulting an outcome of no landing.

At the end of 2023, the economy appears to be slowing: Retail sales declined in October; real disposable personal income increased in October, but it has been trending down, as have real personal consumption expenditures; while the increase in third quarter real GDP was recently revised upward from 4.9 percent to 5.2 percent, forecasts of growth in real GDP during the fourth quarter show a marked slowing—for instance, GDPNow, compiled by the Atlanta Fed, estimates fourth quarter growth at 2.1 percent; and while employment continues to expand, average weekly hours have been slowly declining and initial claims for unemployment insurance have been increasing.

The slowing in the growth of output, income, and employment are reflected in a falling inflation rate. The following figure show the percentage change since the same month in the previous year in PCE price index, which is the measure the Fed uses to gauge whether it is hitting its 2 percent inflation target. (We discuss the reasons for the Fed preferring the PCE price index to the consumer price index (CPI) in Macroeconomics, Chapter 15, Section 15.5 and Economics, Chapter 25, Section 25.5.) The figure also shows core PCE, which excludes the prices of food and energy. Core PCE inflation typically gives a better measure of the underlying inflation rate than does PCE inflation.

PCE inflation declined from 3.4 percent in September to 3.0 percent in October. Core PCE inlation declined from 3.8 percent in September to 3.5 percent in September. Although inflation has been declining from its peak in mid-2022, both of these measures of inflation remain above the Fed’s 2 percent target.

But if we look at the 1-month inflation rate—that is the annual inflation rate calculated by compounding the current month’s rate over an entire year—we see a much sharper decline in inflation, as the following figure shows.

The 1-month inflation rate is naturally more volatile than the 12-month inflation rate. In this case, the 1-month rate shows a sharp decline in PCE inflation from 3.8 percent in September to 0.6 percent in October. Core PCE inflation declined less sharply from 3.9 percent in September to 2.0 percent in October.

The continuing decline in inflation has caused some economists and Wall Street analysts to predict that the FOMC will not implement further increases in its target for the federal funds rate and will likely begin cutting its target by mid-2024.

On December 1 in a speech at Spelman College in Atlanta, Fed Chair Jerome Powell urged caution in assuming that the Fed has succeeded in putting inflation on a course back to its 2 percent target:

“The FOMC is strongly committed to bringing inflation down to 2 percent over time, and to keeping policy restrictive until we are confident that inflation is on a path to that objective. It would be premature to conclude with confidence that we have achieved a sufficiently restrictive stance, or to speculate on when policy might ease. We are prepared to tighten policy further if it becomes appropriate to do so.”

In terms of the three policy outcomes listed at the beginning of this post, the third—no landing, with the unemployment rate remaining very low while the inflation rate remains above the Fed’s 2 percent target—now seems unlikely. The labor market appears to be weakening, which will likely result in increases in the unemployment rate. The next “Employment Report” from the Bureau of Labor Statistics, which will be released on December 8, will provide additional data on the state of the labor market.

Although we can’t entirely rule out the possibility of a no landing outcome, it seems more likely that the economy will either make a soft landing—if output and employment continue to increase, although at a slower rate, while inflation continues to decline—or a hard landing—if output and employment begin to fall as the economy enters a recession.  Although a consensus seems to be building among economists, policymakers, and Wall Street analysts that a soft landing is the likeliest outcome, Powell has provided a reminder that that outcome is far from certain.

Very Strong GDP Report

Photo from Lena Buonanno

This morning the Bureau of Economic Analysis (BEA) released its advance estimate of GDP for the third quarter of 2023. (The report can be found here.) The BEA estimates that real GDP increased by 4.9 percent at an annual rate in the third quarter—July through September. That was more than double the 2.1 percent increase in real GDP in the second quarter, and slightly higher than the 4.7 percent that economists surveyed by the Wall Street Journal last week had expected. The following figure shows the rates of GDP growth each quarter beginning in 2021.

Note that the BEA’s most recent estimates of real GDP during the first two quarters of 2022 still show a decline. The Federal Reserve’s Federal Open Market Committee only switched from a strongly expansionary monetary policy, with a target for the federal funds of effectively zero, to a contractionary monetary policy following its March 16, 2022 meeting. That real GDP was declining even before the Fed had pivoted to a contractionary monetary policy helps explain why, despite strong increases employment during this period, most economists were expecting that the U.S. economy would experience a recession at some point during 2022 or 2023. This expectation was reinforced when inflation soared during the summer of 2022 and it became clear that the FOMC would have to substantially raise its target for the federal funds rate.

Clearly, today’s data on real GDP growth, along with the strong September employment report (which we discuss in this blog post), indicates that the chances of the U.S. economy avoiding a recession in the future have increased and are much better than they seemed at this time last year.

Consumer spending was the largest contributor to third quarter GDP growth. The following figure shows growth rates of real personal consumption expenditures and the subcategories of expenditures on durable goods, nondurable goods, and services. There was strong growth in each component of consumption spending. The 7.6 percent increase in expenditures on durables was particularly strong, particularly given that spending on durables had fallen by 0.3 percent in the second quarter.

Investment spending and its components were a more mixed bag, as shown in the following figure. Overall, gross private domestic investment increased at a very strong rate of 8.4 percent—the highest rate since the fourth quarter of 2021. Residential investment increased 3.9 percent, which was particularly notable following nine consecutive quarters of decline and during a period of soaring mortgage interest rates. But business fixed investment was noticeably weak, falling by 0.1 percent. Spending on structures—such as factories and office buildings—increased by only 1.6 percent, while spending on equipment fell by 3.8 percent.

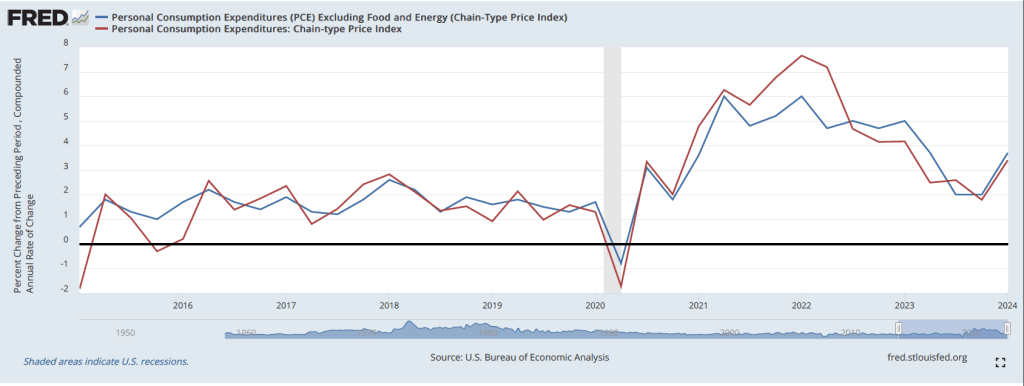
Today’s real GDP report also contained data on the private consumption expenditure (PCE) price index, which the FOMC uses tp determine whether it is achieving its goal of a 2 percent inflation rate. The following figure shows inflation as measured using the PCE and the core PCE—which excludes food and energy prices—since the beginning of 2015. (Note that these inflation rates are measured using quarterly data and as compound annual rates of change.) Despite the strong growth in real GDP and employment, inflation as measured by PCE increased only from 2.5 percent in the second quarter to 2.9 percent in the third quarter. Core PCE, which may be a better indicator of the likely course of inflation in the future, continued the long decline that began in first quarter of 2022 by failling from 3.7 percent to 2.9 percent.

The combination of strong growth in real GDP and declining inflation indicates that the Fed appears well on its way to a soft landing—achieving  a return to its 2 percent inflation target without pushing the economy into a recession. There are reasons to be cautious, however.

GDP, inflation, and employment data are all subject to—possibly substantial—revisions. So growth may have been significantly slower than today’s advance estimate of real GDP indicates. Even if the estimate of real GDP growth of 4.9 percent proves in the long run to have been accurate, there are reasons to doubt whether output growth can be maintained at near that level. Since 2000, annual growth in real GDP has average only 2.1 percent. For GDP to begin increasing at a rate substantially higher than that would require a significant expansion in the labor force and an increase in productivity. While either or both of those changes may occur, they don’t seem likely as of now.

In addition, the largest contributor to GDP growth in the third quarter was from consumption expenditures. As households continue to draw down the savings they built up as a result of the federal government’s response to the Covid recession of 2020, it seems unlikely that the current pace of consumer spending can be maintained. Finally, the lagged effects of monetary policy—particularly the effects of the interest rate on the 10-year Treasury note having risen to nearly 5 percent (which we discuss in our most recent podcast)—may substantially reduce growth in real GDP and employment in future quarters.

But those points shouldn’t distract from the fact that today’s GDP report was good news for the economy.

Inflation, Disinflation, Deflation, and Consumers’ Perceptions of Inflation

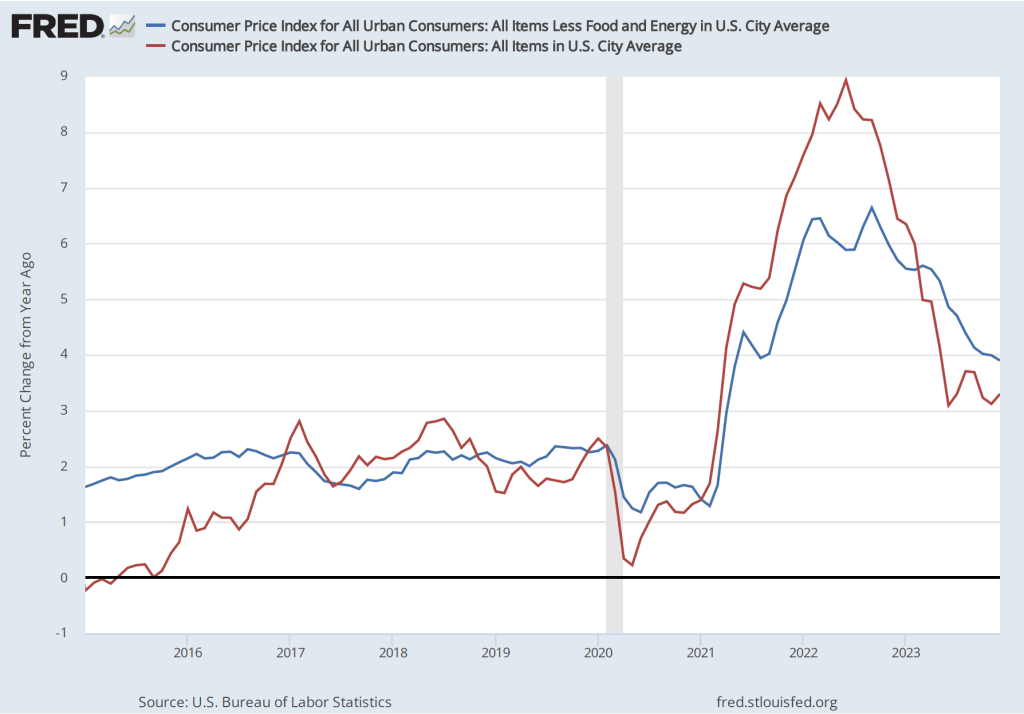
Inflation has declined, although many consumers are skeptical. What explains consumer skepticism? First we can look at what’s happened to inflation in the period since the beginning of 2015. The figure below shows inflation measured as the percentage change in the consumer price index (CPI) from the same month in the previous year. We show both so-called headline inflation, which includes the prices of all goods and services in the index, and core inflation, which excludes energy and food prices. Because energy and food prices can be volatile, most economists believe that the core inflation provides a better indication of underlying inflation. 

Both measures show inflation following a similar path. The inflation rate begins increasing rapidly in the spring of 2021, reaches a peak in the summer of 2022, and declines from there. Headline CPI peaks at 8.9 percent in June 2022 and declines to 3.7 percent in August 2023. Core inflation reaches a peak of 6.6 percent in September 2022 and declines to 4.4 percent in August 2022.

As we discuss in Macroeconomics, Chapter 15, Section 15.5 (Economics, Chapter 25, Section 25.5, and Essentials of Economics, Chapter 17, Section 17.5), the Fed’s inflation target is stated in terms of the personal consumption expenditure (PCE) price index, not the CPI. The PCE includes the prices of all the goods and services included in the consumption component of GDP. Because the PCE includes the prices of more goods and services than does the CPI, it’s a broader measure of inflation. The following figure shows inflation as measured by the PCE and by the core PCE, which excludes energy and food prices.

Inflation measured using the PCE or the core PCE shows the same pattern as inflation measured using the CPI: A sharp increase in inflation in the spring of 2021, a peak in the summer of 2022, and a decline thereafter.

Although it has yet to return to the Fed’s 2 percent target, the inflation rate has clearly fallen substantially during the past year. Yet surveys of consumers show that majorities are unconvinced that inflation has been declining. A Pew Research Center poll from June found that 65 percent of respondents believe that inflation is “a very big problem,” with another 27 percent believing that inflation is “a moderately big problem.” A Gallup poll from earlier in the year found that 67 percent of respondents thought that inflation would go up, while only 29 percent thought it would go down. Perhaps not too surprisingly, another Gallup poll found that only 4 percent of respondents had a “great deal” of confidence in Federal Reserve Chair Jerome Powell, with another 32 percent having a “fair amount” of confidence. Fifty-four percent had either “only a little” confidence in Powell or “almost none.”

There are a couple of reasons why most consumers might believe that the Fed is doing worse in its fight against inflation than the data indicate. First, few people follow the data releases as carefully as economists do. As a result, there can be a lag between developments in the economy—such as declining inflation—and when most people realize that the development has occurred.

Probably more important, though, is the fact that most people think of inflation as meaning “high prices” rather than “increasing prices.” Over the past year the U.S. economy has experienced disinflation—a decline in the inflation rate. But as long as the inflation rate is positive, the price level continues to increase. Only deflation—a declining price level—would lead to prices actually falling. And an inflation rate of 3 percent to 4 percent, although considerably lower than the rates in mid-2022, is still significantly higher than the inflation rates of 2 percent or below that prevailed during most of the time since 2008.

Although, core CPI and core PCE exclude energy and food prices, many consumers judge the state of inflation by what’s happening to gasoline prices and the price of food in supermarkets. These are products that consumers buy frequently, so they are particularly aware of their prices. The figure below shows the component of the CPI that represents the prices of food consumers buy in groceries or supermarkets and prepare at home. The price of food rose rapidly beginning in the spring of 2021. Althought increases in food prices leveled off beginning in early 2023, they were still about 24 percent higher than before the pandemic.

There is a similar story with respect to gasoline prices. Although the average price of gasoline in August 2023 at $3.84 per gallon is well below its peak of nearly $5.00 per gallon in June 2022, it is still well above average gasoline prices in the years leading up to the pandemic.

Finally, the figure below shows that while percentage increases in rent are below their peak, they are still well above the increases before and immediately after the recession of 2020. (Note that rents as included in the CPI include all rents, not just rental agreements that were entered into that month. Because many rental agreements, particularly for apartments in urban areas, are for one year or more, in any given month, rents as measured in the CPI may not accurately reflect what is currently happening in rental housing markets.)

Because consumers continue to pay prices that are much higher than the prices they were paying prior to the pandemic, many consider inflation to still be a problem. Which is to say, consumers appear to frequently equate inflation with high prices, even when the inflation rate has markedly declined and prices are increasing more slowly than they were.

Is the U.S. Economy Coming in for a Soft Landing?

The Federal Reserve building in Washington, DC. (Photo from Bloomberg News via the Wall Street Journal.)

The key macroeconomic question of the past two years is whether the Federal Reserve could bring down the high inflation rate without triggering a recession. In this blog post from back in February, we described the three likely macroeconomic outcomes as:

  1. A soft landing—inflation returns to the Fed’s 2 percent target without a recession occurring.
  2. A hard landing—inflation returns to the Fed’s 2 percent target with a recession occurring.
  3. No landing—inflation remains above the Fed’s 2 percent target but no recession occurs.

The following figure shows inflation measured as the percentage change in the personal consumption expenditures (PCE) price index and in the core PCE, which excludes food and energy prices. Recall that the Fed uses inflation as measured by the PCE to determine whether it is hitting its inflation target of 2 percent. Because food and energy prices tend to be volatile, many economists inside and outside of the Fed use the core PCE to better judge the underlying rate of inflation—in other words, the inflation rate likely to persist in at least the near future.

The figure shows that inflation first began to rise above the Fed’s target in March 2021. Most members of the Federal Open Market Committee (FOMC) believed that the inflation was caused by temporary disruptions to supply chains caused by the effects of the Covid–19 pandemic. Accordingly, the FOMC didn’t raise its target for the federal funds from 0 to 0.25 percent until March 2022. Since March 2022, the FOMC has raised its target for the federal funds rate in a series of steps until the target range reached 5.25 to 5.50 percent following the FOMC’s July 26, 2023 meeting.

PCE inflation peaked at 7.0 percent in June 2022 and had fallen to 2.9 percent in June 2023. Core PCE had a lower and earlier peak of 5.4 percent in February 2023, but had experienced a smaller decline—to 4.1 percent in June 2023. Inflation as measured by the consumer price index (CPI) followed a similar pattern, as shown in the following figure. Inflation measured by core CPI reached a lower peak than did inflation measured by the CPI and declined by less through June 2023.

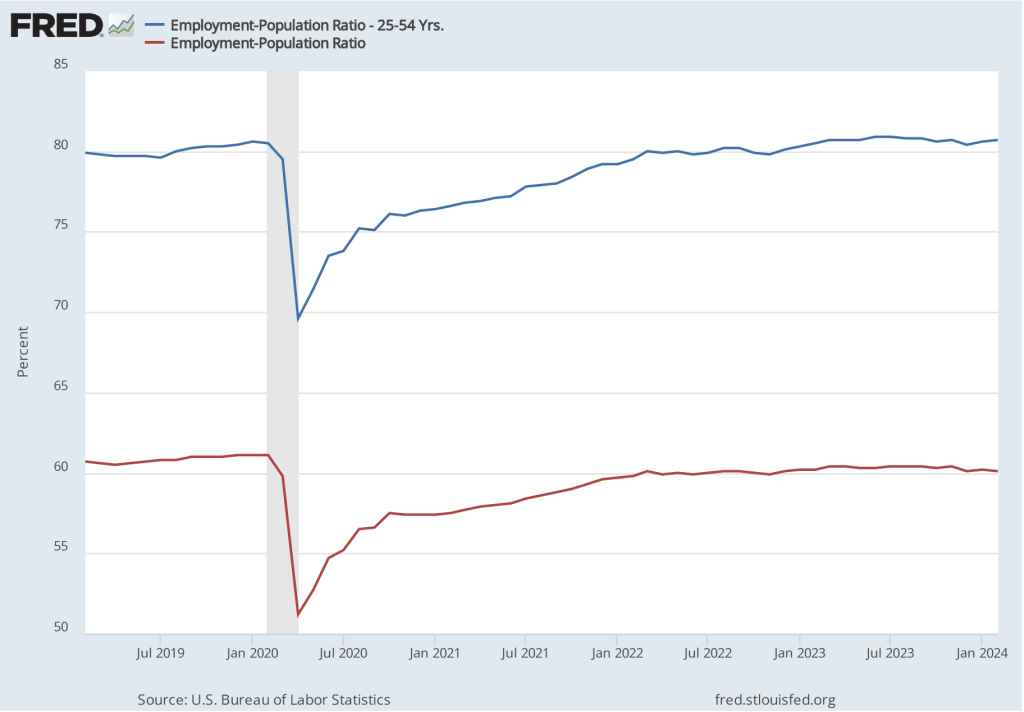
As inflation has been falling since mid-2022, , the unemployment rate has remained low and the employment-population ratio for prime-age workers (workers aged 25 to 54) has risen above its 2019 pre-pandemic peak, as the following two figures show.

So, the Fed seems to be well on its way to achieving a soft landing. But in the press conference following the July 26 FOMC meeting Chair Jerome Powell was cautious in summarizing the inflation situation:

“Inflation has moderated somewhat since the middle of last year. Nonetheless, the process of getting inflation back down to 2 percent has a long way to go. Despite elevated inflation, longer-term inflation expectations appear to remain well anchored, as reflected in a broad range of surveys of households, businesses, and forecasters, as well as measures from financial markets.”

By “longer-term expectations appear to remain well anchored,” Powell was referring to the fact that households, firms, and investors appear to be expecting that the inflation rate will decline over the following year to the Fed’s 2 percent target.

Those economists who still believe that there is a good chance of a recession occuring during the next year have tended to focus on the following three points:

1. As shown in the following two figures, the labor market remains tight, with wage increases remaining high—although slowing in recent months—and the ratio of job openings to the number of unemployed workers remaining at historic levels—although that ratio has also been declining in recent months. If the labor market remains very tight, wages may continue to rise at a rate that isn’t consistent with 2 percent inflation. In that case, the FOMC may have to persist in raising its target for the federal funds rate, increasing the chances for a recession.

2. The lagged effect of the Fed’s contractionary monetary policy over the past year—increases in the target for the federal funds rate and quantitative tightening (allowing the Fed’s holdings of Treasury securites and mortgage-backed securities to decline; a process of quantitative tightening (QT))—may have a significant negative effect on the growth of aggegate demand in the coming months. Economists disagree on the extent to which monetary policy has lagged effects on the economy. Some economists believe that lags in policy have been significantly reduced in recent years, while other economists believe the lags are still substantial. The lagged effects of monetary policy, if sufficiently large, may be enough to push the economy into a recession.

3. The economies of key trading partners, including the European Union, the United Kingdom, China, and Japan are either growing more slowly than in the previous year or are in recession. The result could be a decline in net exports, which have been contributing to the growth of aggregate demand since early 2021.

In summary, we can say that in early August 2023, the probability of the Fed bringing off a soft landing has increased compared with the situation in mid-2022 or even at the beginning of 2023. But problems can still arise before the plane is safely on the ground.

Is a Soft Landing More Likely Now?

Photo from the Wall Street Journal.

The Federal Reserve’s goal has been to end the current period of high inflation by bringing the economy in for a soft landing—reducing the inflation rate to closer to the Fed’s 2 percent target while avoiding a recession. Although Fed Chair Jerome Powell has said repeatedly during the last year that he expected the Fed would achieve a soft landing, many economists have been much more doubtful.

It’s possible to read recent economic data as indicating that it’s more likely that the economy is approaching a soft landing, but there is clearly still a great deal of uncertainty. On April 12, the Bureau of Labor Statistics released the latest CPI data. The figure below shows the inflation rate as measured by the CPI (blue line) and by core CPI—which excludes the prices of food and fuel (red line). In both cases the inflation rate is the percentage change from the same month in the previous year. 

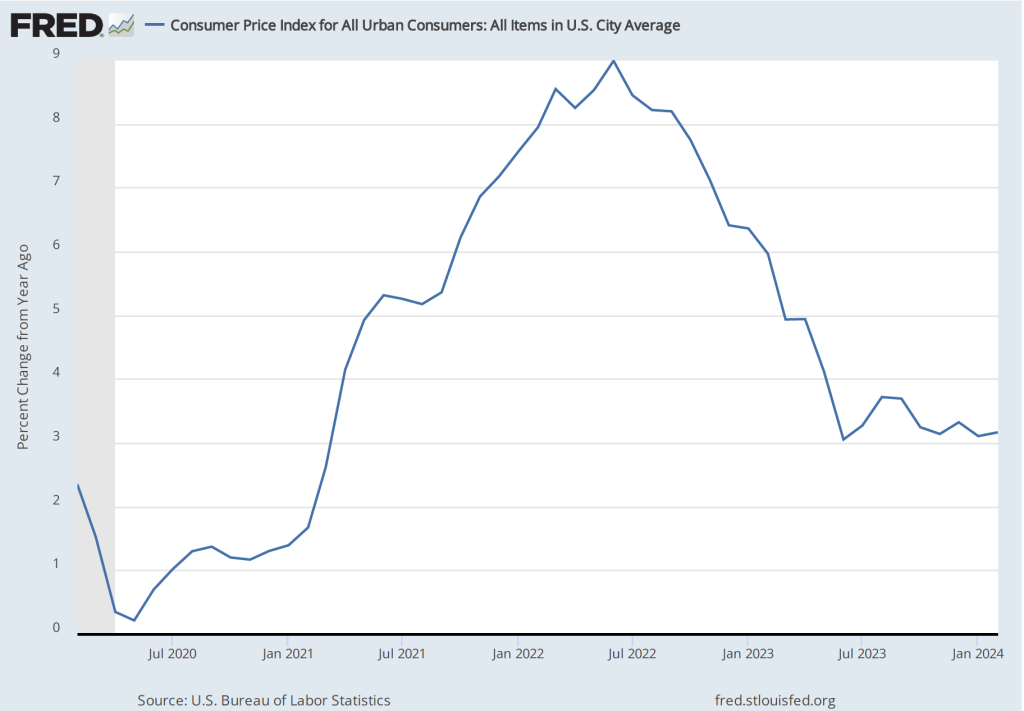
The inflation rate as measured by the CPI has been trending down since it hit a peak of 8.9 percent in June 2022. The inflation rate as measured by core CPI has been trending down more gradually since it reached a peak of 6.6 percent in September 2022. In March, it was up slightly to 5.6 percent from 5.5 percent in February.

As the following figure shows, payroll employment while still increasing, has been increasing more slowly during the past three months—bearing in mind that the payroll employment data are often subject to substantial revisions. The slowing growth in payroll employment is what we would expect with a slowing economy. The goal of the Fed in slowing the economy is, of course, to bring down the inflation rate. That payroll employment is still growing indicates that the economy is likely not yet in a recession.

The slowing in employment growth has been matched by slowing wage growth, as measured by the percentage change in average hourly earnings. As the following figure shows, the rate of increase in average hourly earnings has declined from 5.9 percent in March 2022 to 4.2 percent in March 2023. This decline indicates that businesses are experiencing somewhat lower increases in their labor costs, which may pass through to lower increases in prices.

Credit conditions also indicate a slowing economy As the following figure shows, bank lending to businesses and consumers has declined sharply, partly because banks have experienced an outflow of deposits following the failure of Silicon Valley and Signature Banks and partly because some banks have raised their requirements for households and firms to qualify for loans in anticipation of the economy slowing. In a slowing economy, households and firms are more likely to default on loans. To the extent that consumers and businesses also anticipate the possibility of a recession, they may have reduced their demand for loans.

But such a sharp decline in bank lending may also be an indication that the economy is not just slowing, on its way to a making a soft landing, but is on the verge of a recession. The minutes of the March meeting of the Federal Open Market Committee (FOMC) included the information that the FOMC’s staff economists forceast “at the time of the March meeting included a mild recession starting later this year, with a recovery over the subsequent two years.” (The minutes can be found here.) The increased chance of a recession was attributed largely to “banking and financial conditions.”

At its next meeting in May, the FOMC will have to decide whether to once more increase its target range for the federal funds rate. The target range is currently 4.75 percent to 5.00 percent. The FOMC will have to decide whether inflation is on a course to fall back to the Fed’s 2 percent target or whether the FOMC needs to further slow the economy by increasing its target range for the federal funds rate. One factor likely to be considered by the FOMC is, as the following figure shows, the sharp difference between the inflation rate in prices of goods (blue line) and the inflation rate in prices of services (red line).

During the period from January 2021 to November 2022, inflation in goods was higher—often much higher—than inflation in services. The high rates of inflation in goods were partly the result of disruptions to supply chains resulting from the Covid-19 pandemic and partly due to a surge in demand for goods as a result of very expansionary fiscal and monetary policies. Since November 2022, inflation in the prices of services has remained high, while inflation in the prices of goods has continued to decline. In March, goods inflation was only 1.6 percent, while services inflation was 7.2 percent. In his press conference following the last FOMC meeting, Fed Chair Jerome Powell stated that as long as services inflation remains high “it would be very premature to declare victory [over inflation] or to think that we’ve really got this.” (The transcript of Powell’s news conference can be found here.) This statement coupled with the latest data on service inflation would seem to indicate that Powell will be in favor of another 0.25 percentage point increase in the federal funds rate target range.

The Fed’s inflation target is stated in terms of the personal consumption expenditure (PCE) price index, not the CPI. The Bureau of Economic Analysis will release the March PCE on April 28, before the next FOMC meeting. If the Fed is as closely divided as it appears to be over whether additional increases in the federal funds rate target range are necessary, the latest PCE data may prove to have a significan effect on their decision.

So—as usual!—the macroeconomic picture is murky. The economy appears to be slowing and inflation seems to be declining but it’s still difficult to determine whether the Fed will be able to bring inflation back to its 2 percent target without causing a recession.