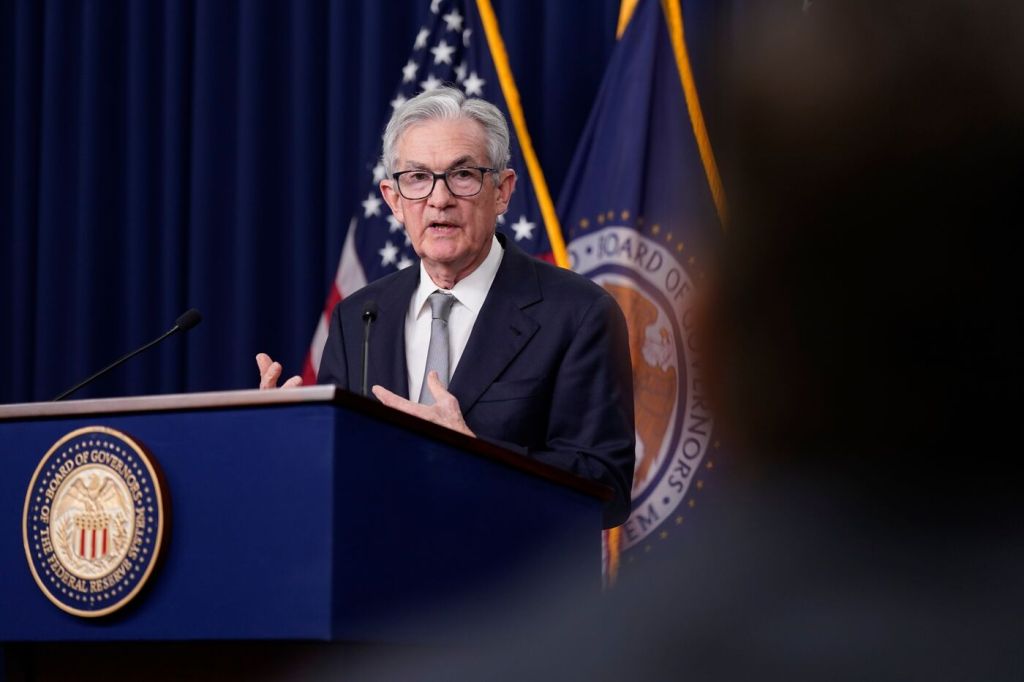
The Federal Reserve building in Washington, DC. (Photo from the New York Times.)
Since inflation began to increase rapidly in the late spring of 2021, the key macroeconomic question has been whether the Fed would be able to achieve a soft landing—pushing inflation back to its 2 percent target without causing a recession. The majority of the members of the Fed’s Federal Open Market Committee (FOMC) believed that increases in inflation during 2021 were largely caused by problems with supply chains resulting from the effects of the Covid–19 pandemic.
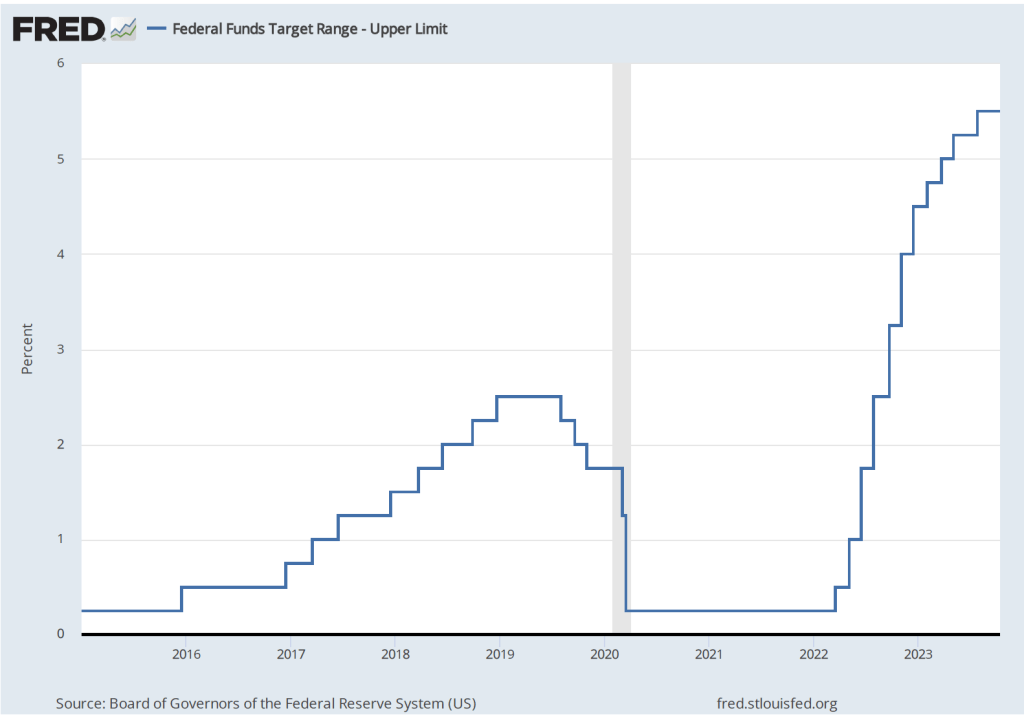
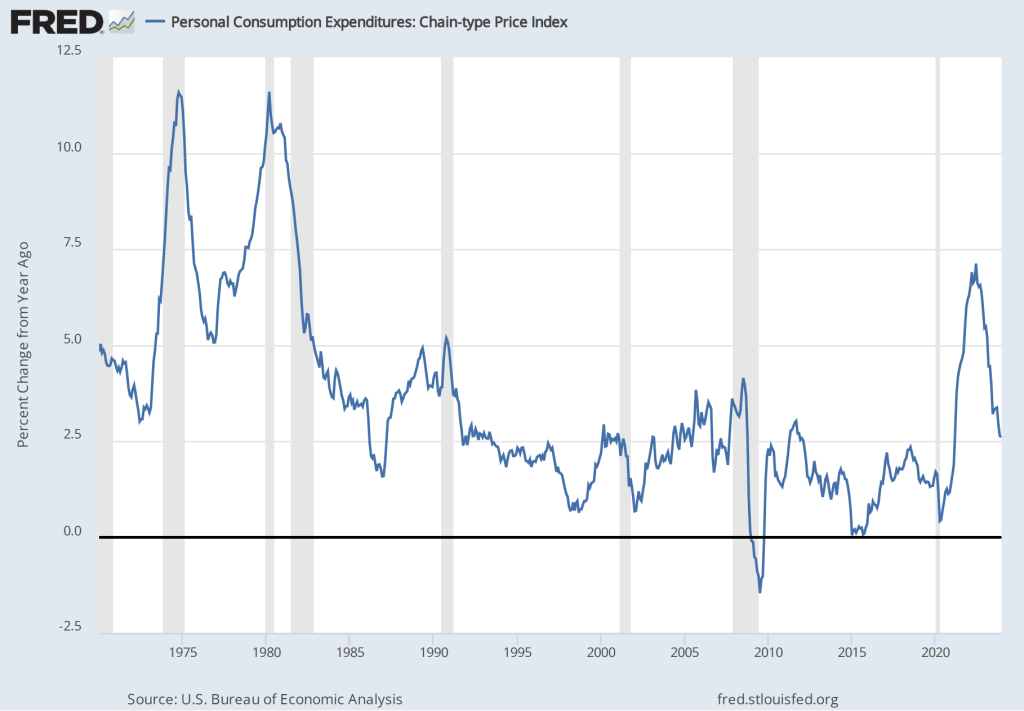
These committee members believed that once supply chains returned to normal, the increase in he inflation rate would prove to have been transitory—meaning that the inflation rate would decline without the need for the FOMC to pursue a contractionary monetary by substantially raising its target range for the federal funds rate. Accordingly, the FOMC left its target range unchanged at 0 to 0.25 percent until March 2022. As the following figure shows, by that time the inflation rate had increased to 6.9 percent, the highest it had been since January 1982. (Note that the figure shows inflation as measured by the percentage change from the same month in the previous year in the personal consumption expenditures (PCE) price index. Inflation as measured by the PCE is the gauge the Fed uses to determine whether it is achieving its goal of 2 percent inflation.)
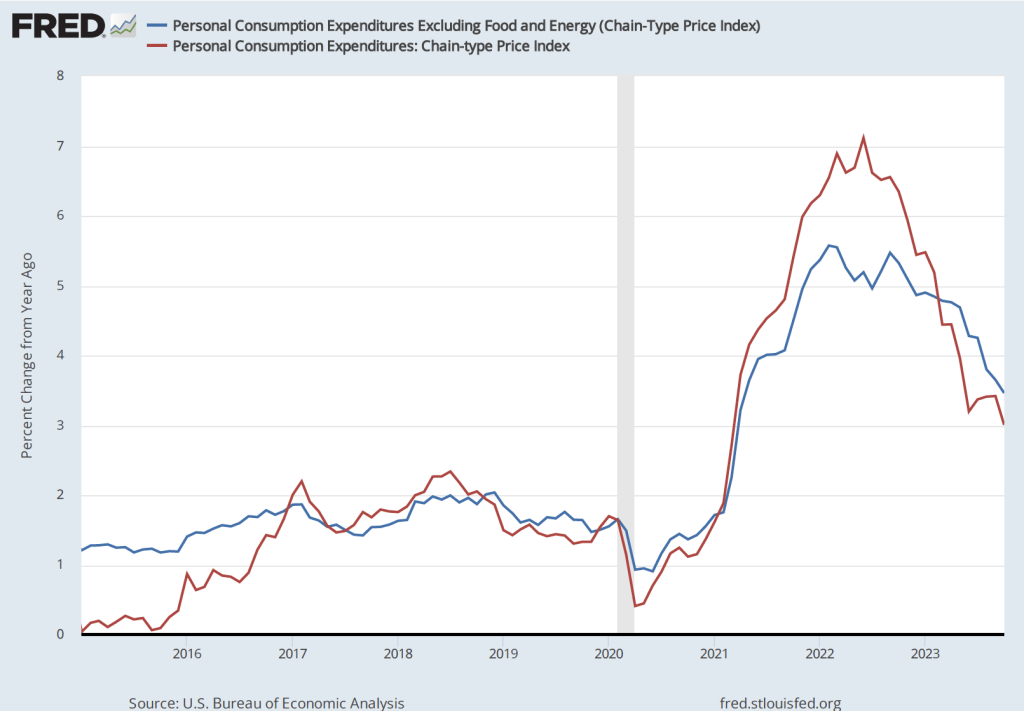
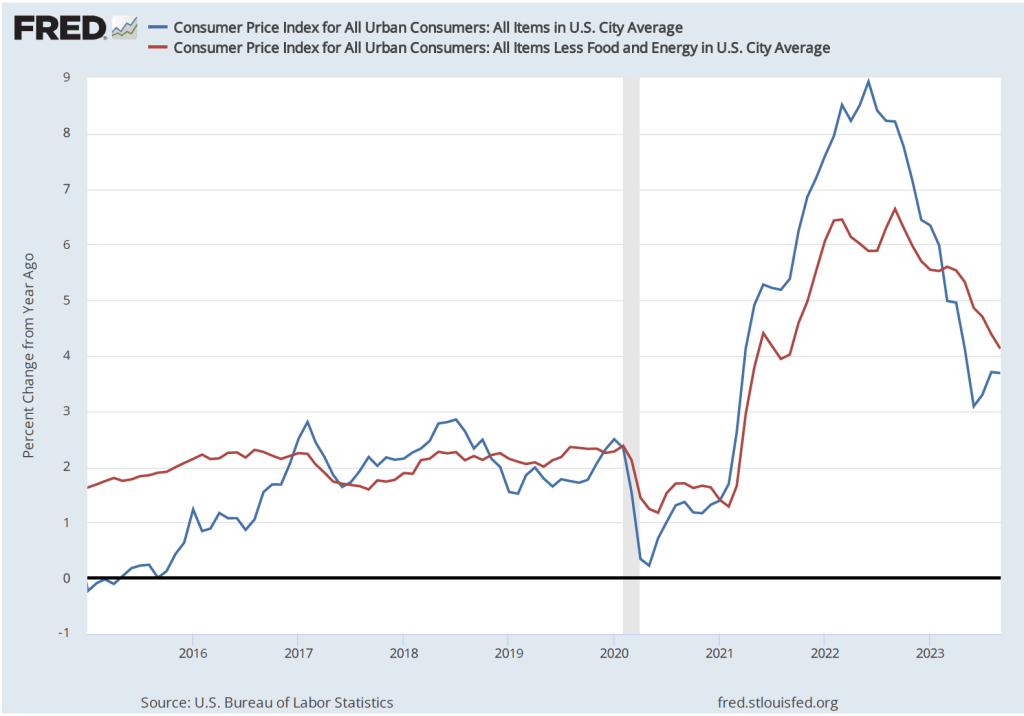
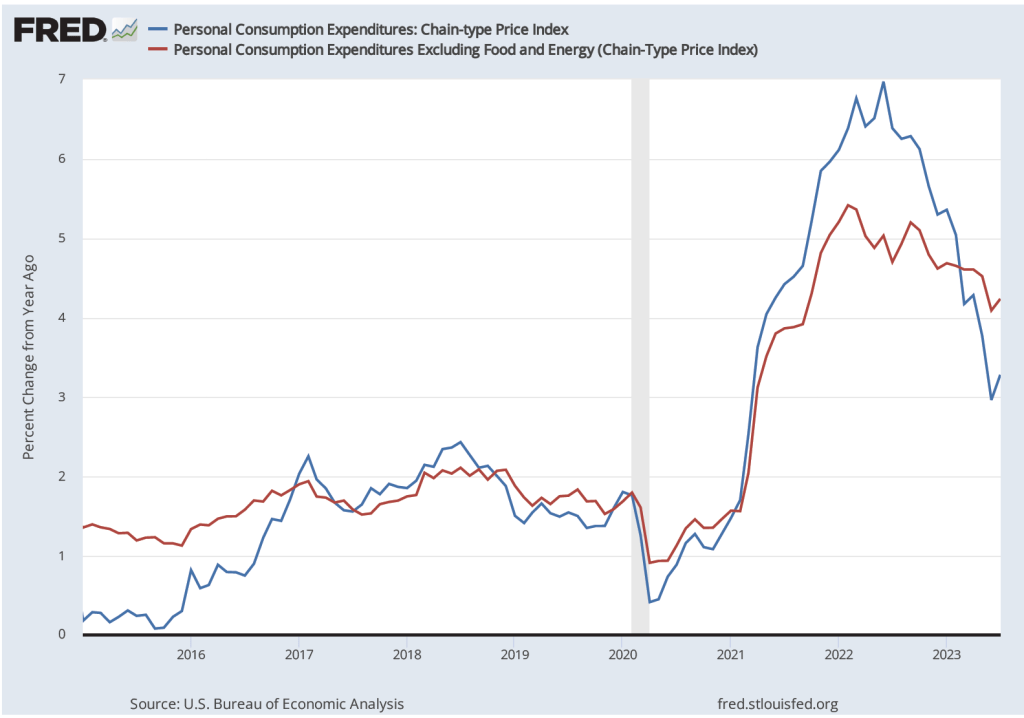
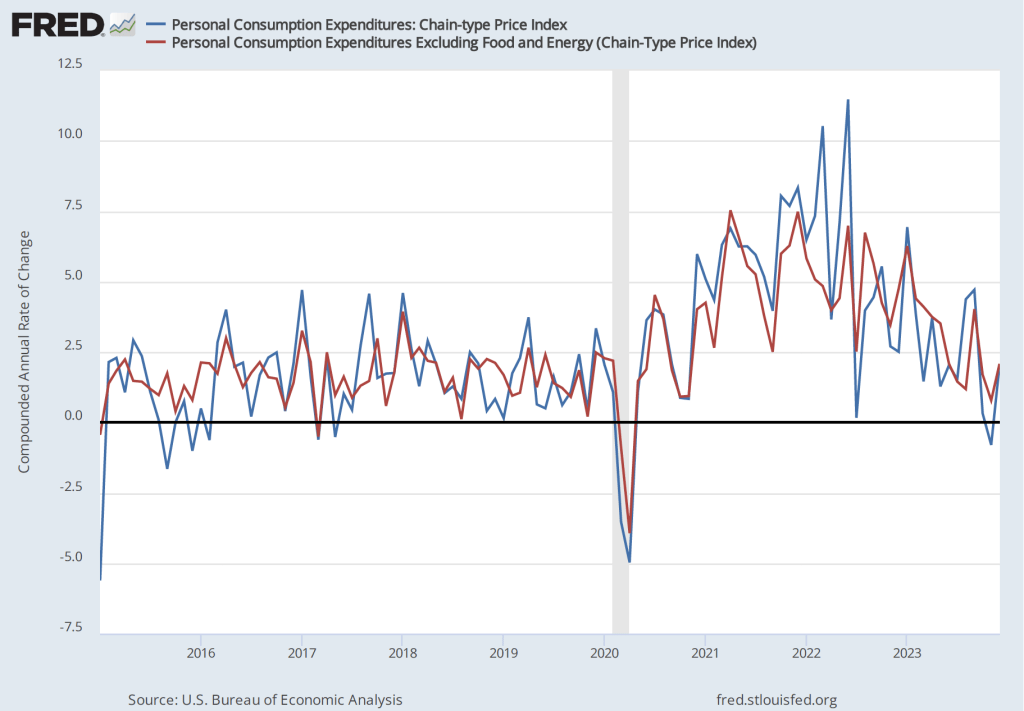
By the time inflation reached its peak in mid-2022, many economists believed that the FOMC’s decision to delay increasing the federal funds rate until March 2022 had made it unlikely that the Fed could return inflation to 2 percent without causing a recession. But the latest macroeconomic data indicate that—contrary to that expectation—the Fed does appear to have come very close to achieving a soft landing. On January 26, the Bureau of Economic Analysis (BEA) released data on the PCE for December 2023. The following figure shows for the period since 2015, inflation as measured by the percentage change in the PCE from the same month in the previous year (the blue line) and as measured by the percentage change in the core PCE, which excludes the prices of food and energy (the red line).

The figure shows that PCE inflation continued its decline, falling slightly in December to 2.6 percent. Core PCE inflation also declined in December to 2.9 percent from 3.2 percent in November. Note that both measures remained somewhat above the Fed’s inflation target of 2 percent.
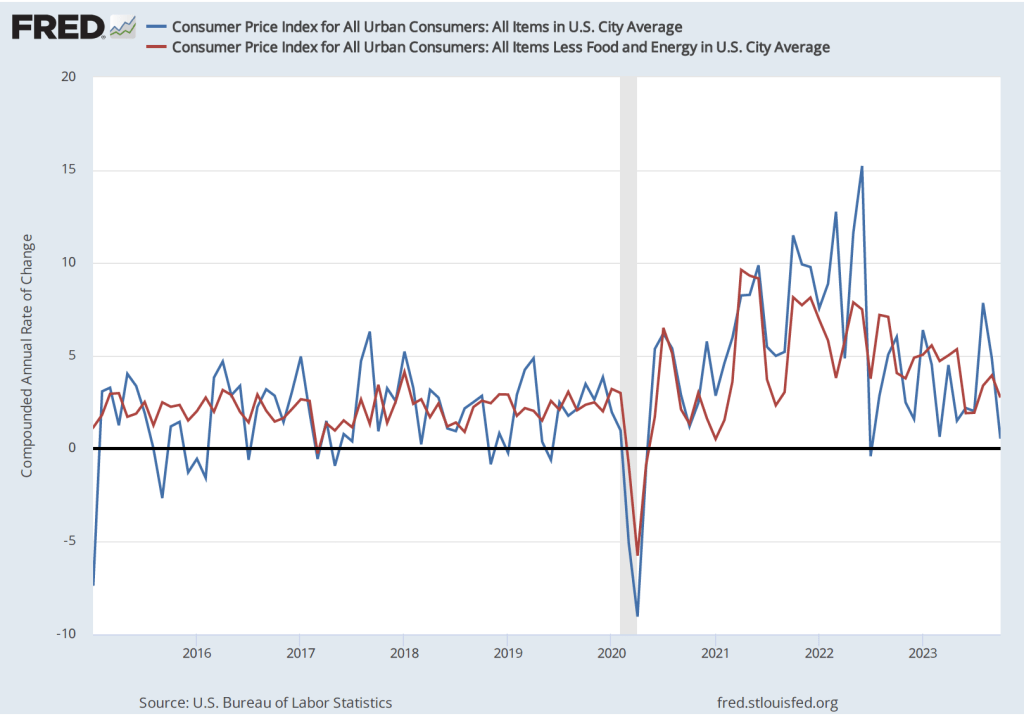
If we look at the 1-month inflation rate—that is the annual inflation rate calculated by compounding the current month’s rate over an entire year—inflation is closer to Fed’s target, as the following figure shows. The 1-month PCE inflation rate has moved somewhat erratically, but has generally trended down since mid-2022. In December, PCE inflation increased from from –0.8 percent in November (which acutally indicates that deflation occurred that month) to 2.0 percent in December. The 1-month core PCE inflation rate has moved less erratically, also trending down since mid-2022. In December, the 1-month core PCE inflation increased from 0.8 percent in November to 2.1 percent in December. In other words, the December reading on inflation indicates that inflation is very close to the Fed’s target.
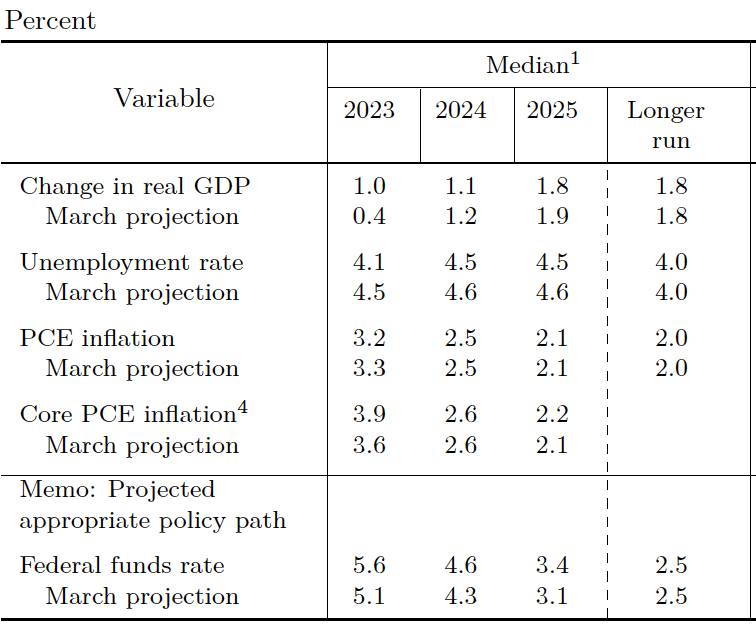
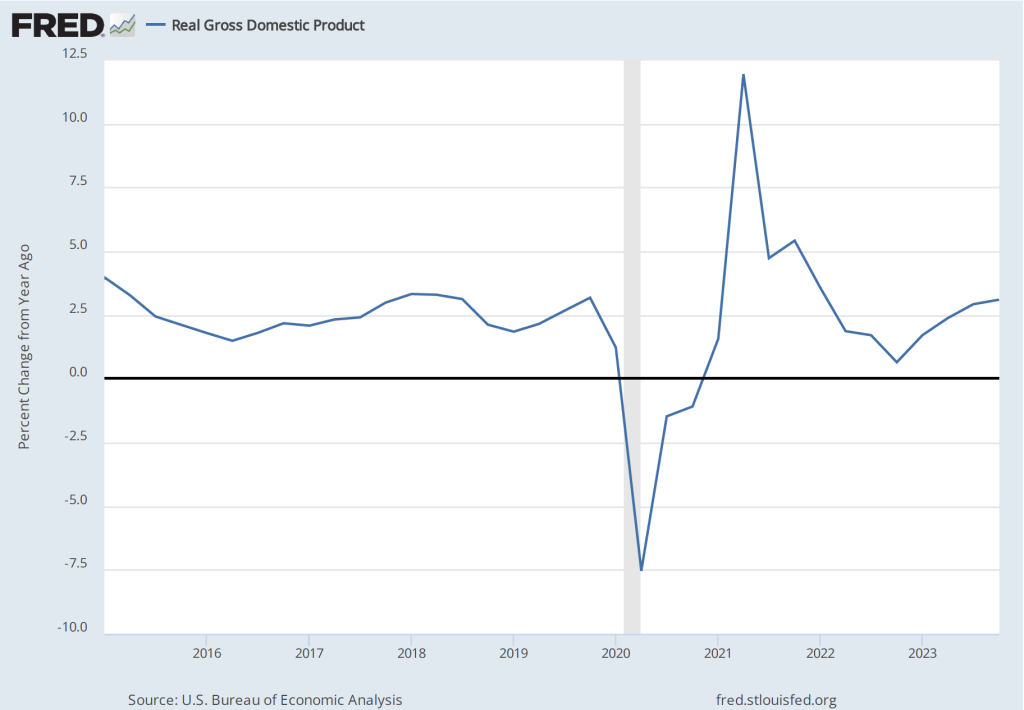
The following figure shows for each quarter since the beginning of 2015, the growth rate of real GDP measured as the percentage change from the same quarter in the previous year. The figure indicates that although real GDP growth dropped to below 1 percent in the fourth quarter of 2022, the growth rate rose during each quarter of 2023. The growth rate of 3.1 percent in the fourth quarter of 2023 remained well above the FOMC’s 1.8 percent estimate of long-run economic growth. (The average of the members of the FOMC’s estimates of the long-run growth rate of real GDP can be found here.) To this point, there is no indication from the GDP data that the U.S. economy is in danger of experiencing a recession in the near future.
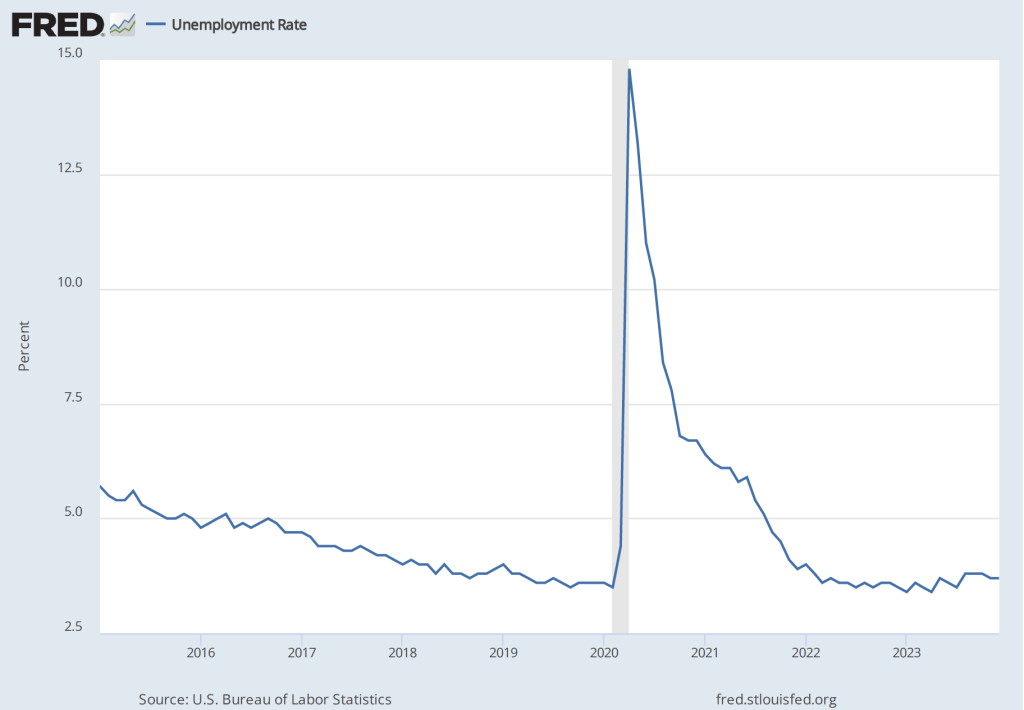
The labor market also shows few signs of a recession, as indicated by the following figure, which shows the unemployment rate in the months since January 2015. The unemployment rate has remained below 4 percent in each month since December 2021. The unemployment rate was 3.7 percent in December 2023, below the FOMC’s projection of a long-run unemployment rate of 4.1 percent.
The FOMC’s next meeting is on Tuesday and Wednesday of this week (February 1-2). Should we expect that at that meeting Fed Chair Jerome Powell will declare that the Fed has succeeded in achieving a soft landing? That seems unlikely. Powell and the other members of the committee have made clear that they will be cautious in interpreting the most recent macroeconomic data. With the growth rate of real GDP remaining above its long run trend and the unemployment rate remaining below most estimates of the natural rate of unemployment, there is still the potential that aggregate demand will increase at a rate that might cause the inflation rate to once again rise.
In a speech at the Brookings Institution on January 16, Fed Governor Christopher Waller echoed what appear to be the views of most members of the FOMC:
“Time will tell whether inflation can be sustained on its recent path and allow us to conclude that we have achieved the FOMC’s price-stability goal. Time will tell if this can happen while the labor market still performs above expectations. The data we have received the last few months is allowing the Committee to consider cutting the policy rate in 2024. However, concerns about the sustainability of these data trends requires changes in the path of policy to be carefully calibrated and not rushed. In the end, I am feeling more confident that the economy can continue along its current trajectory.”
At his press conference on February 1, following the FOMC meeting, Chair Powell will likely provide more insight into the committee’s current thinking.