Photo courtesy of Lena Buonanno.
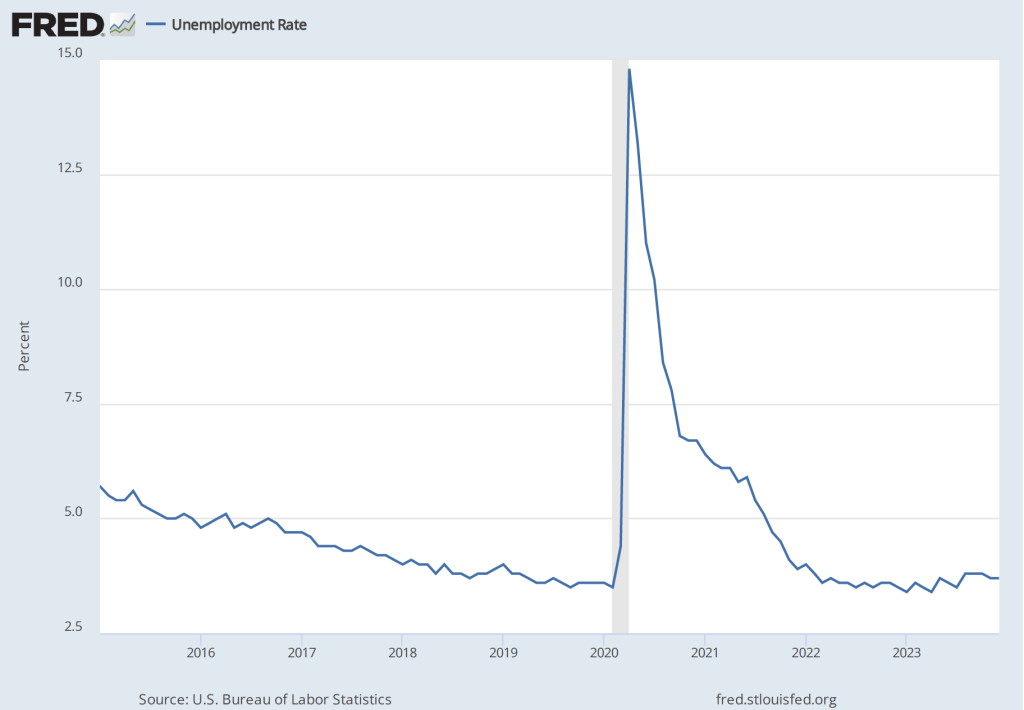
As we’ve discussed in several blog posts (for instance, here and here), recent macro data have been consistent with the Federal Reserve being close to achieving a soft landing. The Fed’s increases in its target for the federal funds rate have slowed the growth of aggregate demand sufficiently to bring inflation closer to the Fed’s 2 percent target, but haven’t, to this point, slowed the growth of aggregate demand so much that the U.S. economy has been pushed into a recession.
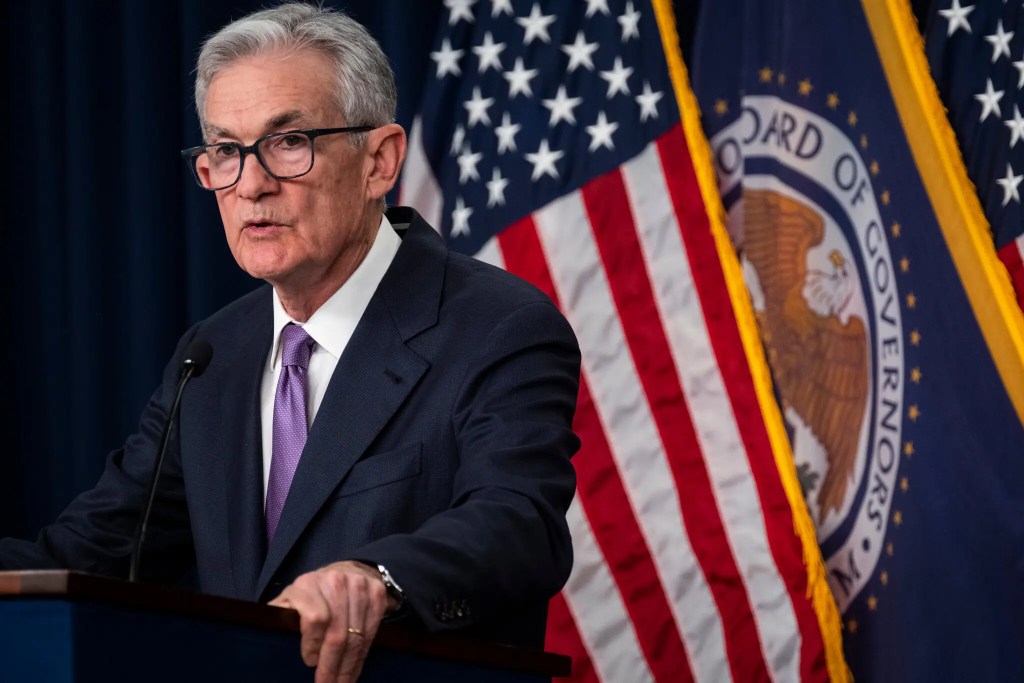
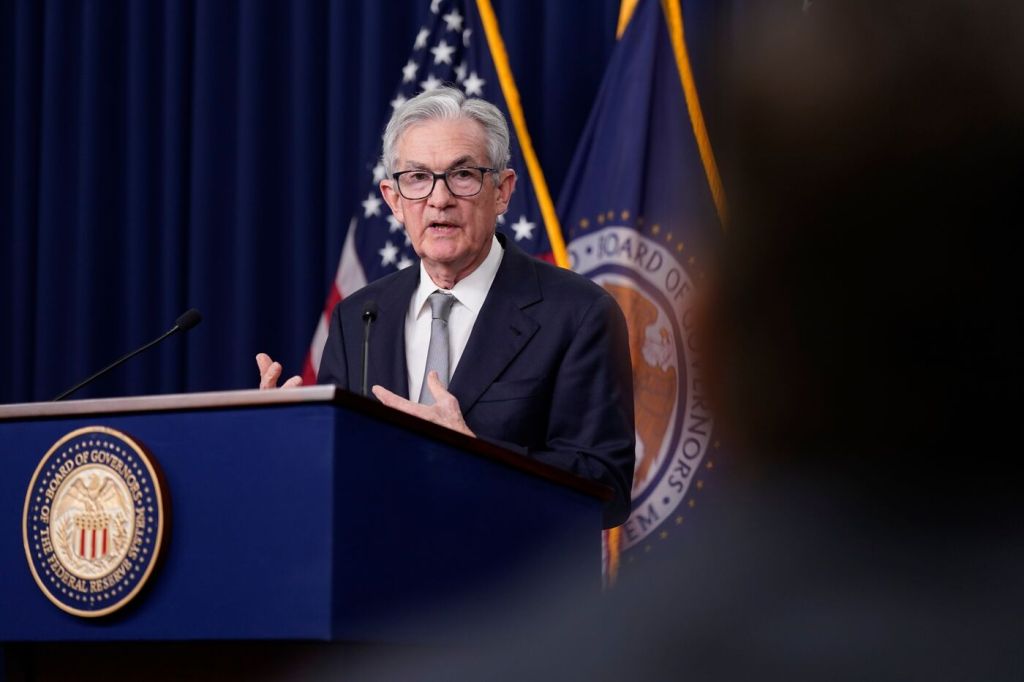
By January 2024, many investors in financial markets and some economists were expecting that at its meeting on March 19-20, the Fed’s Federal Open Market Committee would be cutting its target for the federal funds. However, members of the committee—notably, Chair Jerome Powell—have been cautious about assuming prematurely that inflation had, in fact, been brought under control. In fact, in his press conference on January 31, following the committee’s most recent meeting, Powell made clear that the committee was unlikely to reduce its target for the federal funds rate at its March meeting. Powell noted that “inflation is still too high, ongoing progress in bringing it down is not assured, and the path forward is uncertain.”
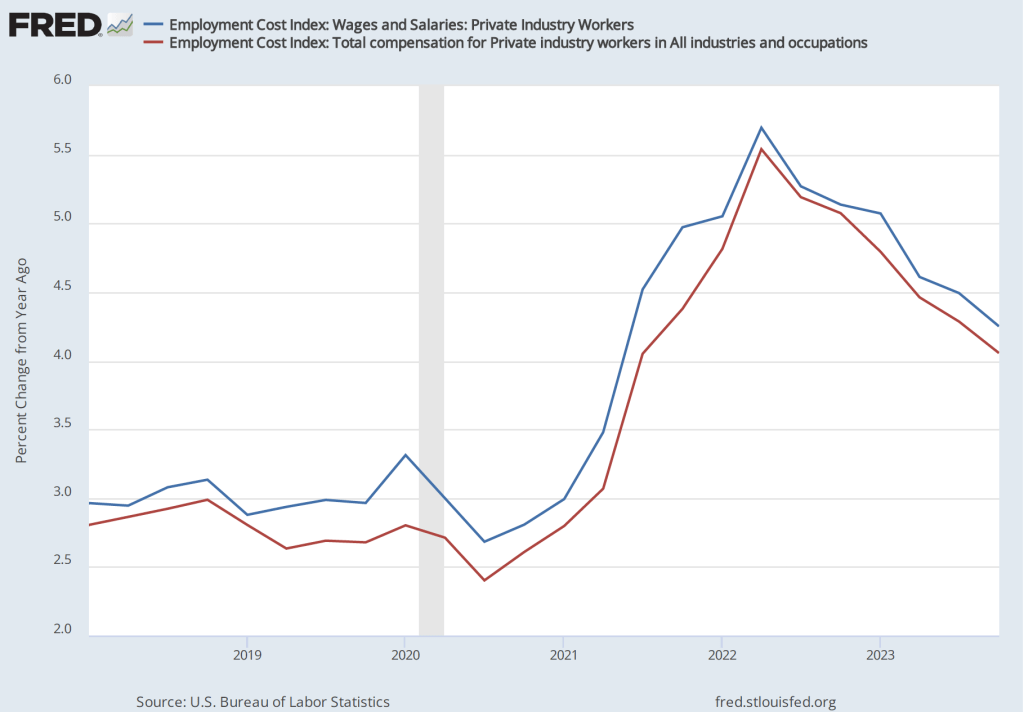
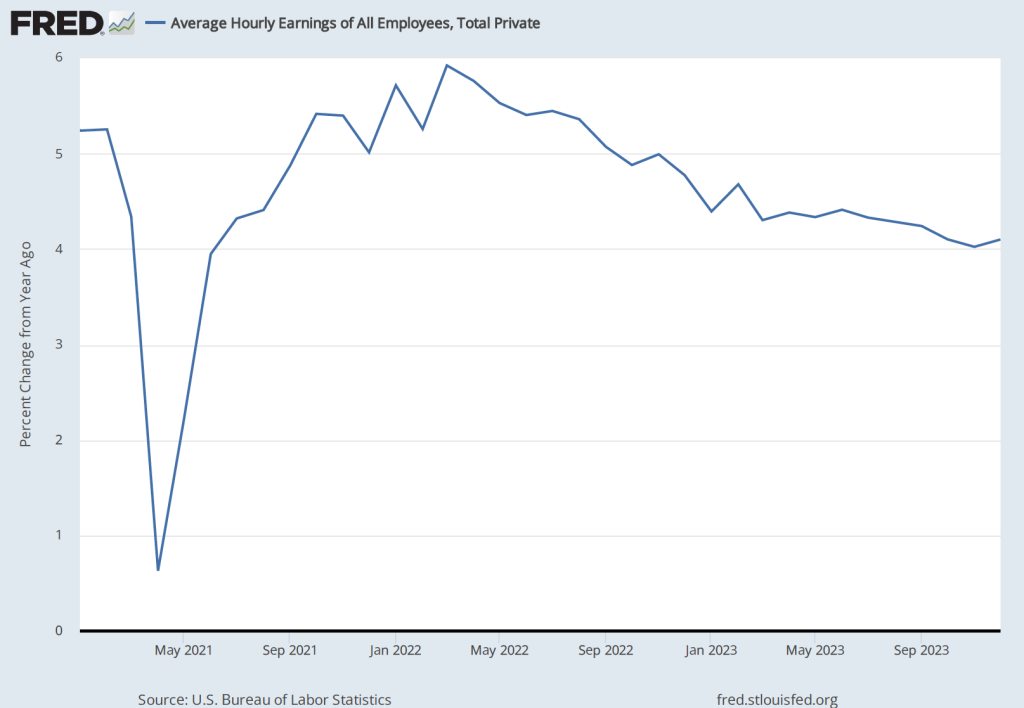
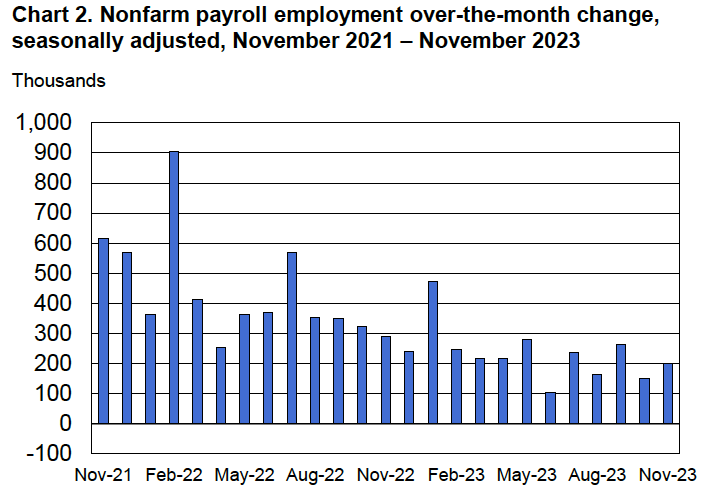
Powell’s caution seemed justified when, on February 2, the Bureau of Labor Statistics (BLS) released its most recent “Employment Situation Report” (discussed in this post). The report’s data on growth in employment and growth in wages, as measured by the change in average hourly earnings, might be indicating that aggregate demand is growing too rapidly for inflation to continue to decline.
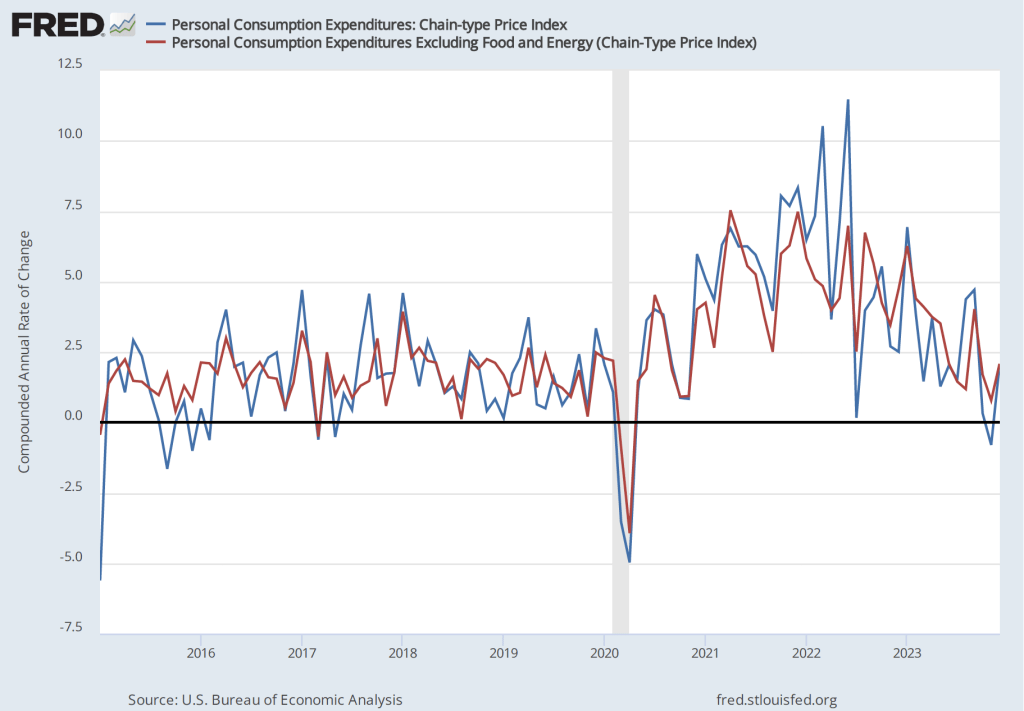
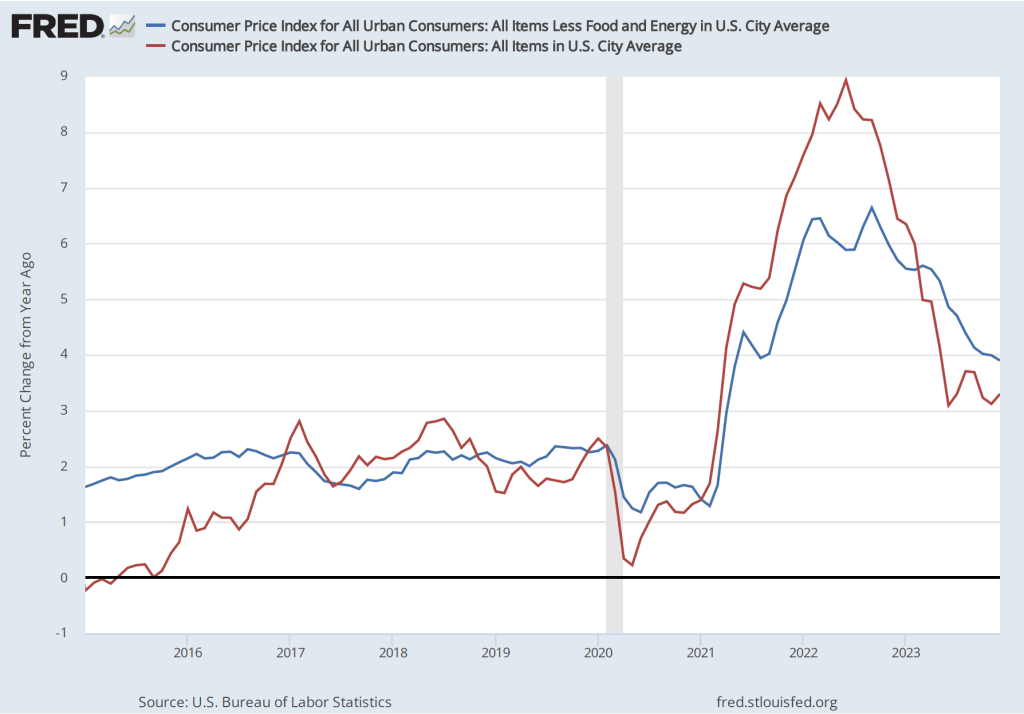
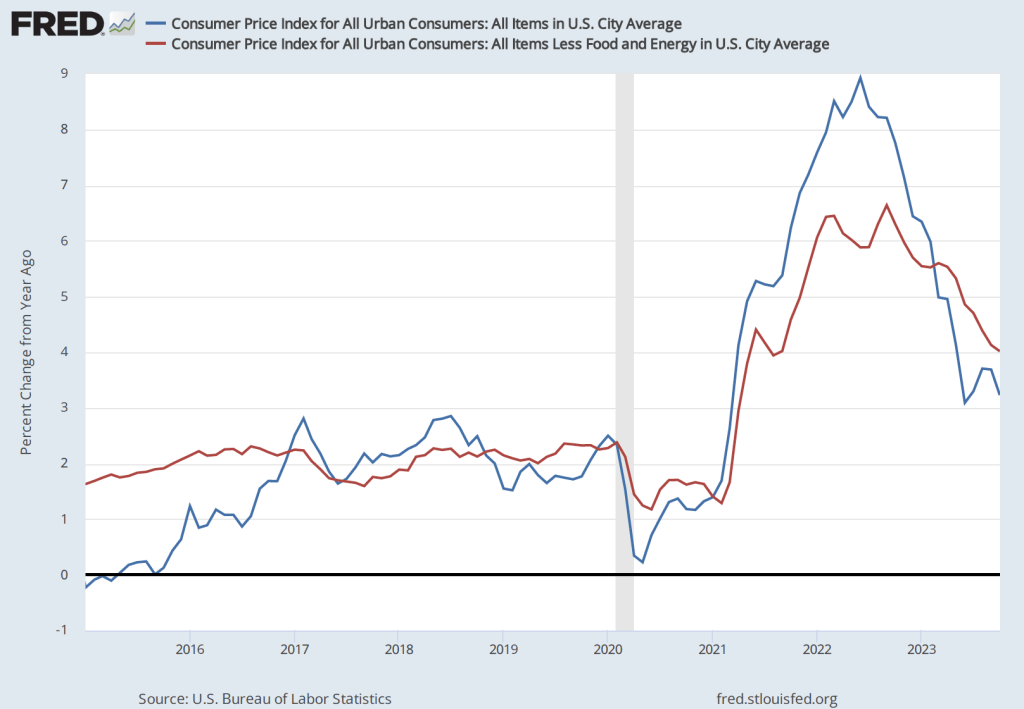
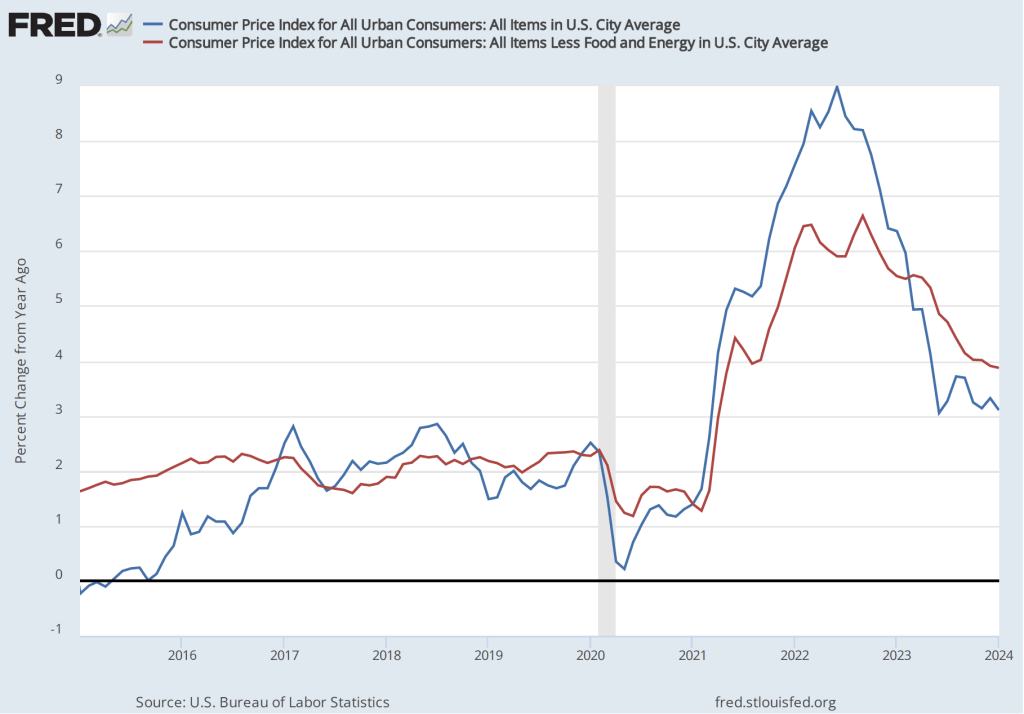
The BLS’s release today (February 13) of its report on the consumer price index (CPI) (found here) for January provided additional evidence that the Fed may not yet have put inflation on a firm path back to its 2 percent target. The average forecast of economists surveyed before the release of the report was that the increase in the version of the CPI that includes the prices of all goods and services in the market basket—often called headline inflation—would be 2.9 percent. (We discuss how the BLS constructs the CPI in Macroeconomics, Chapter 9, Section 19.4, Economics, Chapter 19, Section 19.4, and Essentials of Economics, Chapter 3, Section 13.4.) As the following figure shows, headline inflation for January was higher than expected at 3.1 percent (measured by the percentage change from the same month in the previous year), while core inflation—which excludes the prices of food and energy—was 3.9 percent. Headline inflation was lower than in December 2023, while core inflation was almost unchanged.
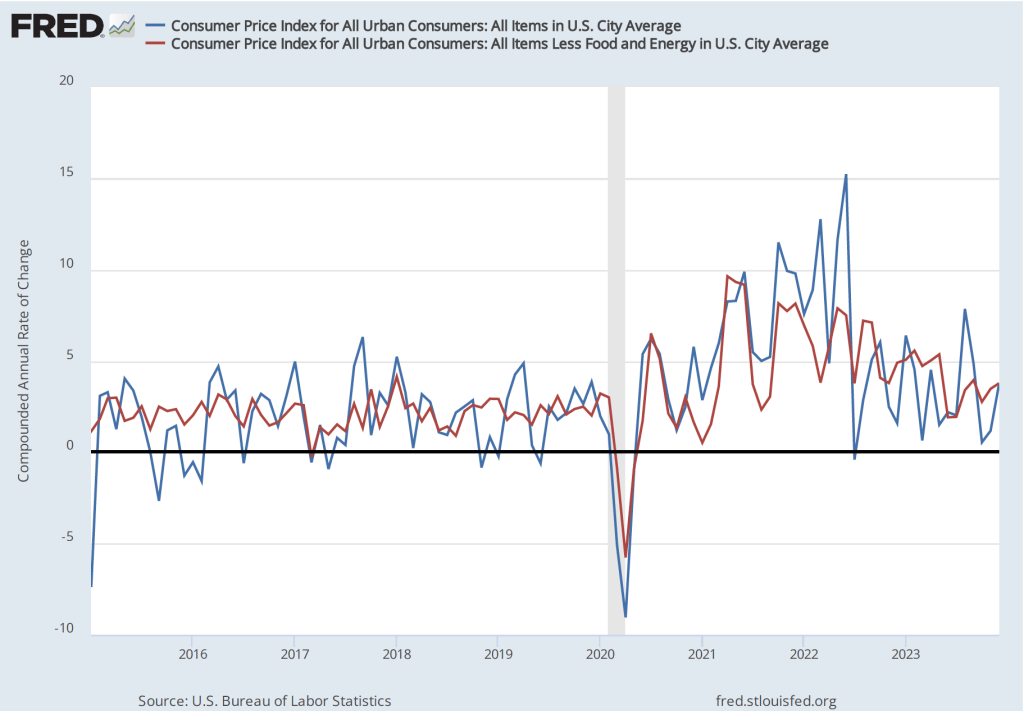
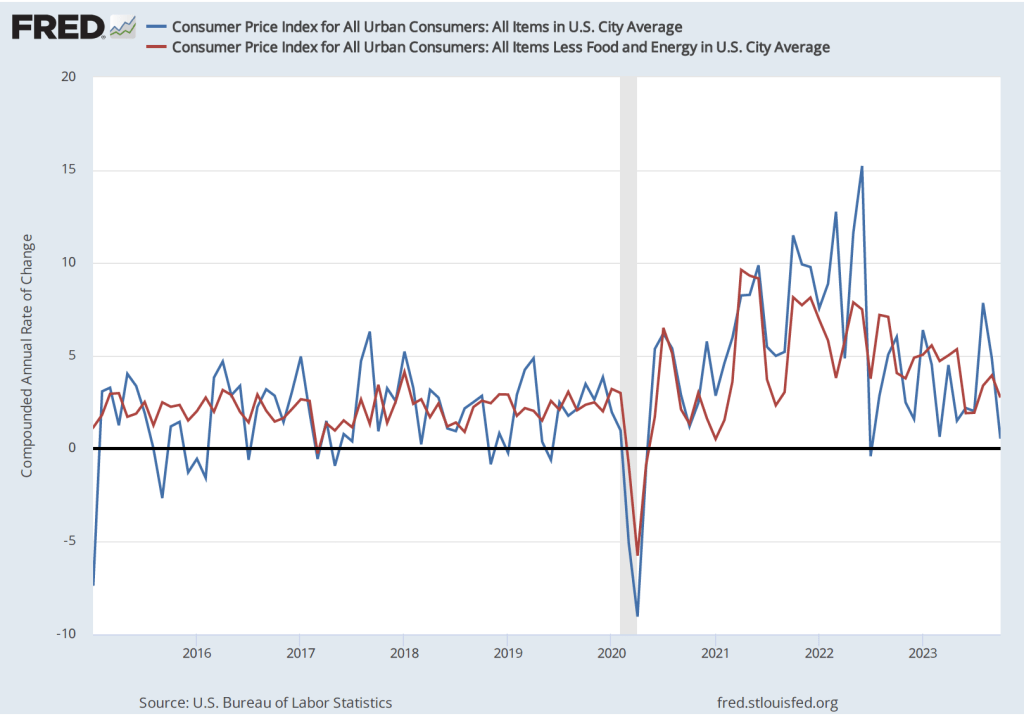
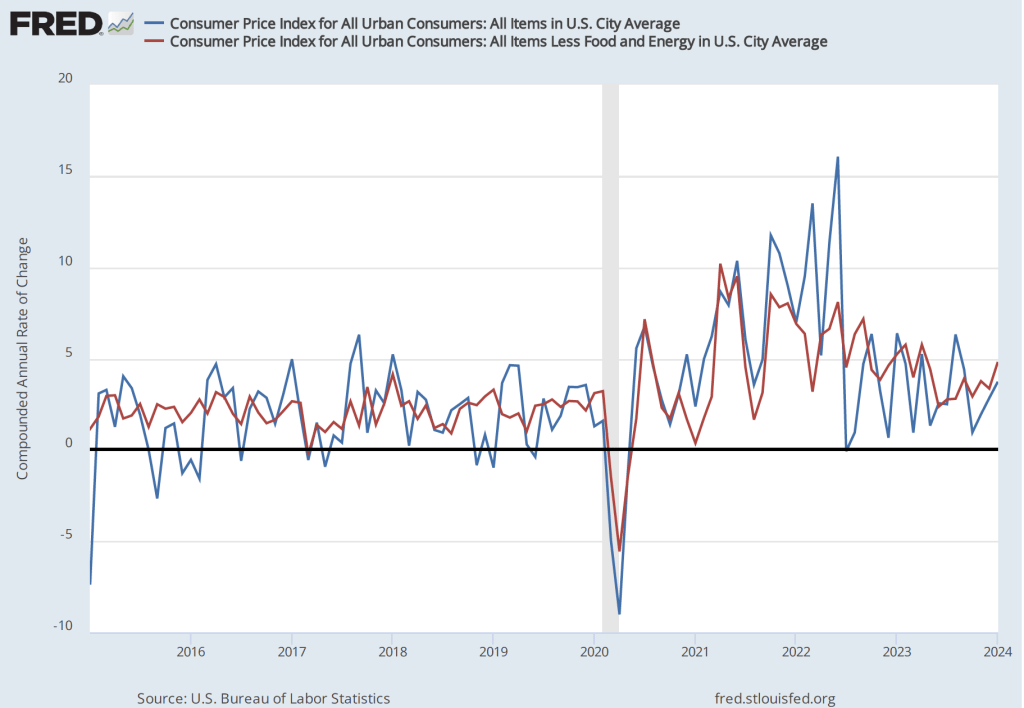
Although the values for January might seem consistent with a gradual decline in inflation, that conclusion may be misleading. Headline inflation in January 2023 had been surprisingly high at 6.4 percent. Hence, the comparision between the value of the CPI in January 2024 with the value in January 2023 may be making the annual CPI inflation rate seem artificially low. If we look at the 1-month inflation rate for headline and core inflation—that is the annual inflation rate calculated by compounding the current month’s rate over an entire year—the values are more concerning, as indicated in the following figure. Headline CPI inflation is 3.7 percent and core CPI inflation is 4.8 percent.
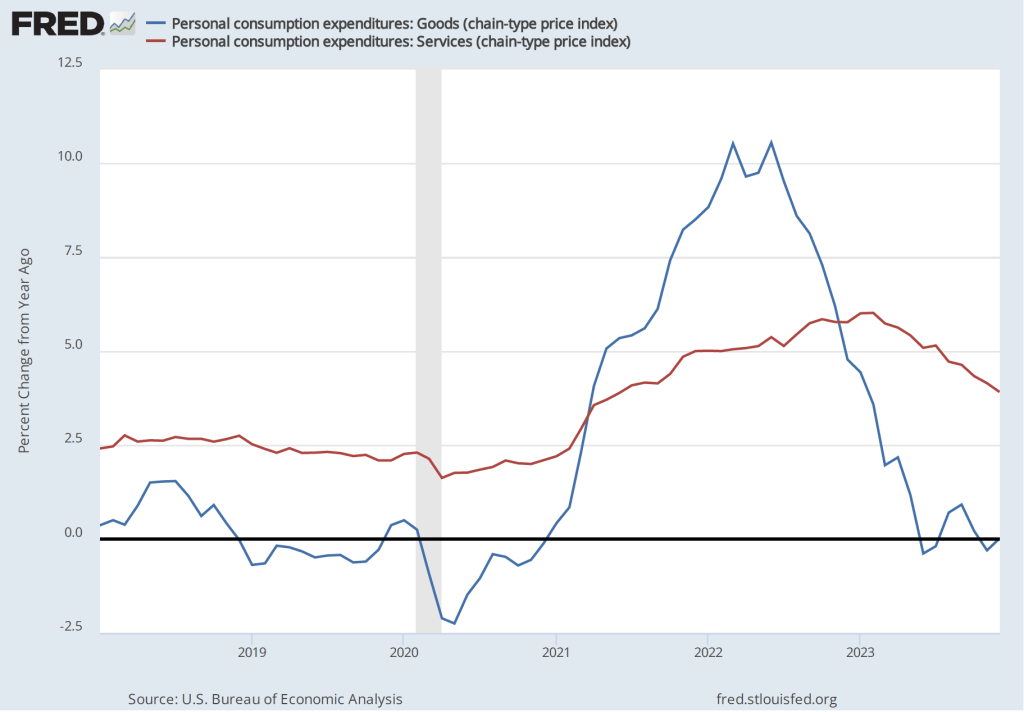
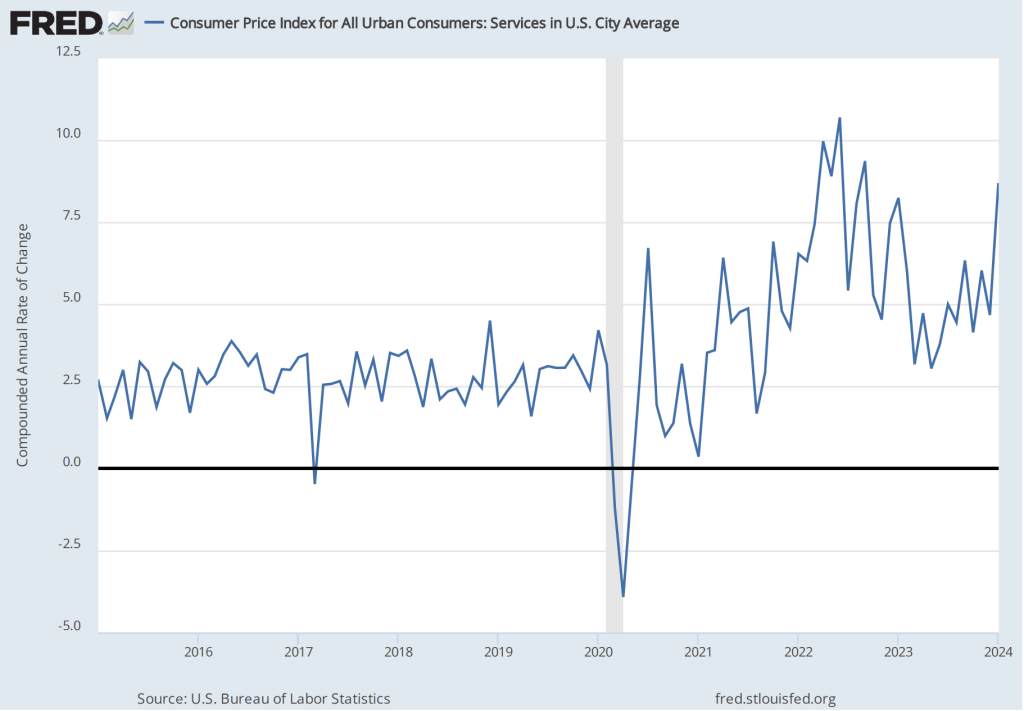
Even more concerning is the path of inflation in the prices of services. Chair Powell has emphasized that as supply chain problems have gradually been resolved, inflation in the prices of goods has been rapidly declining. But inflaion in services hasn’t declined nearly as much. Last summer he stated the point this way:
“Part of the reason for the modest decline of nonhousing services inflation so far is that many of these services were less affected by global supply chain bottlenecks and are generally thought to be less interest sensitive than other sectors such as housing or durable goods. Production of these services is also relatively labor intensive, and the labor market remains tight. Given the size of this sector, some further progress here will be essential to restoring price stability.”
The following figure shows the 1-month inflation rate in services prices. The figure shows that inflation in services has been above 4 percent in every month since July 2023. Inflation in services was a very high 8.7 percent in January. Clearly such large increases in the prices of services aren’t consistent with the Fed meeting its 2 percent inflation target.
How should we interpret the latest CPI report? First, it’s worth bearing in mind that a single month’s report shouldn’t be relied on too heavily. There can be a lot of volatility in the data month-to-month. For instance, inflation in the prices of services jumped from 4.7 percent in December to 8.7 percent in January. It seems unlikely that inflation in the prices of services will continue to be over 8 percent.
Second, housing prices are a large component of service prices and housing prices can be difficult to measure accurately. Notably, the BLS includes in its measure the implicit rental price that someone who owns his or her own home pays. The BLS calculates that implict rental price by asking consumers who own their own homes the following question: “If someone were to rent your home today, how much do you think it would rent for monthly, unfurnished and without utilities?” (The BLS discusses how it measures the price of housing services here.) In practice, it may be difficult for consumers to accurately answer the question if very few houses similar to theirs are currently for rent in their neighborhood.
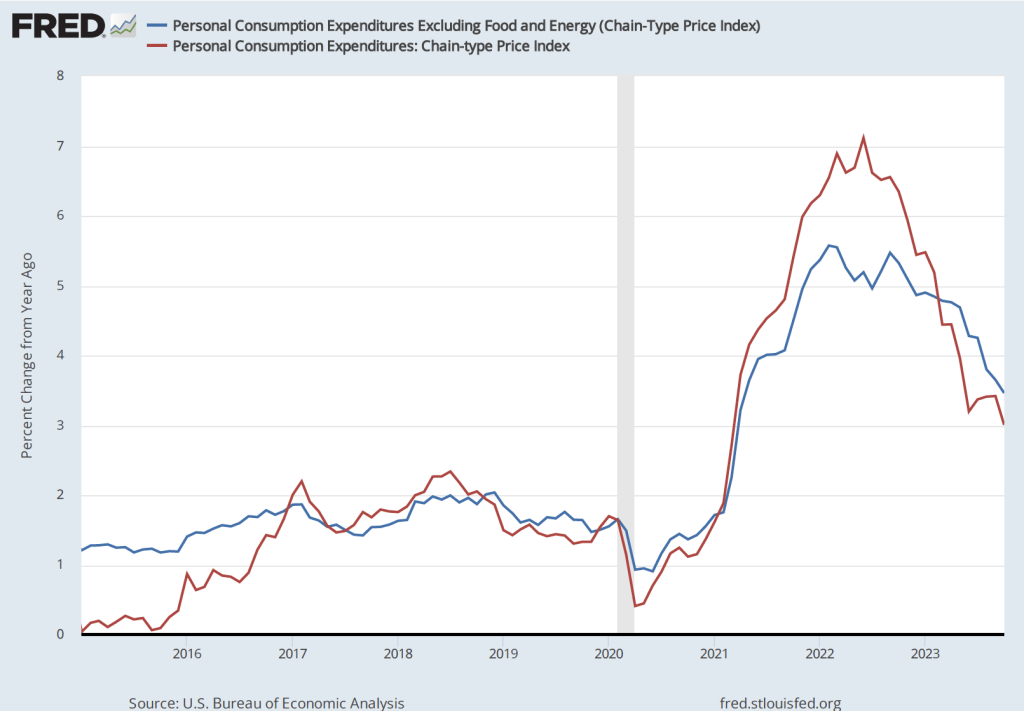
Third, the Fed uses the personal consumption expenditures (PCE) price index, not the CPI, to gauge whether it is achieving its 2 percent inflation target. The Bureau of Economic Analysis (BEA) includes the prices of more goods and services in the PCE than the BLS includes in the CPI and measures housing services using a different approach than that used by the BLS. Although inflation as measured by changes in the CPI and as measured by changes in the PCE move roughly together over long periods, the two measures can differ significantly over a period of a few months. The difference between the two inflation measures is another reason not to rely too heavily on a single month’s CPI data.
Despite these points, investors on Wall Street clearly interpreted the CPI report as bad news. Investors have been expecting that the Fed will soon cut its target for the federal funds rate, which should lead to declines in other key interest rates. If inflation continues to run well above the Fed’s 2 percent target, it seems likely that the Fed will keep its federal funds target at its current level for longer, thereby slowing the growth of aggregate demand and raising the risk of a recession later this year. Accordingly, the Dow Jones Industrial Average declined by more than 500 points today (February 13) and the interest rate on the 10-year Treasury note rose above 4.3 percent.
The FOMC has more than a month before its next meeting to consider the implications of the latest CPI report and the additional macro data that will be released in the meantime.