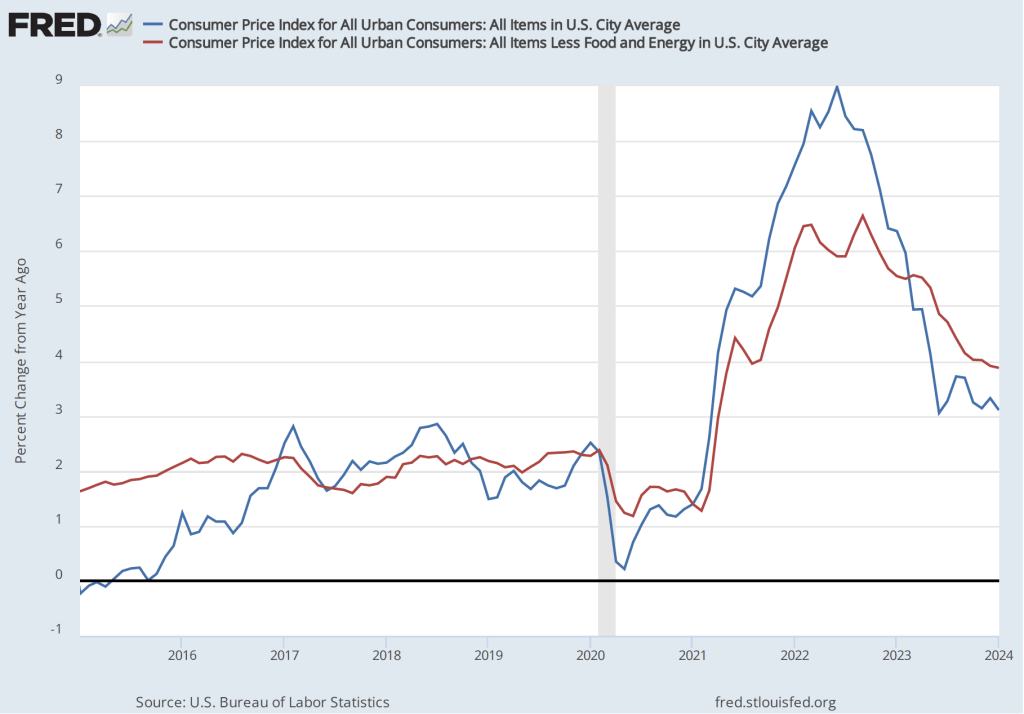
In a recent podcast we discussed what actions the Fed may take if inflation continues to run well above the Fed’s 2 percent target. We are likely a step closer to finding out with the release this morning (April 10) by the Bureau of Labor Statistics (BLS) of data on the consumer price index (CPI) for March. The inflation rate measured by the percentage change in the CPI from the same month in the previous month—headline inflation—was 3.5 percent, slightly higher than expected (as indicated here and here). As the following figure shows, core inflation—which excludes the prices of food and energy—was 3.8 percent, the same as in January.

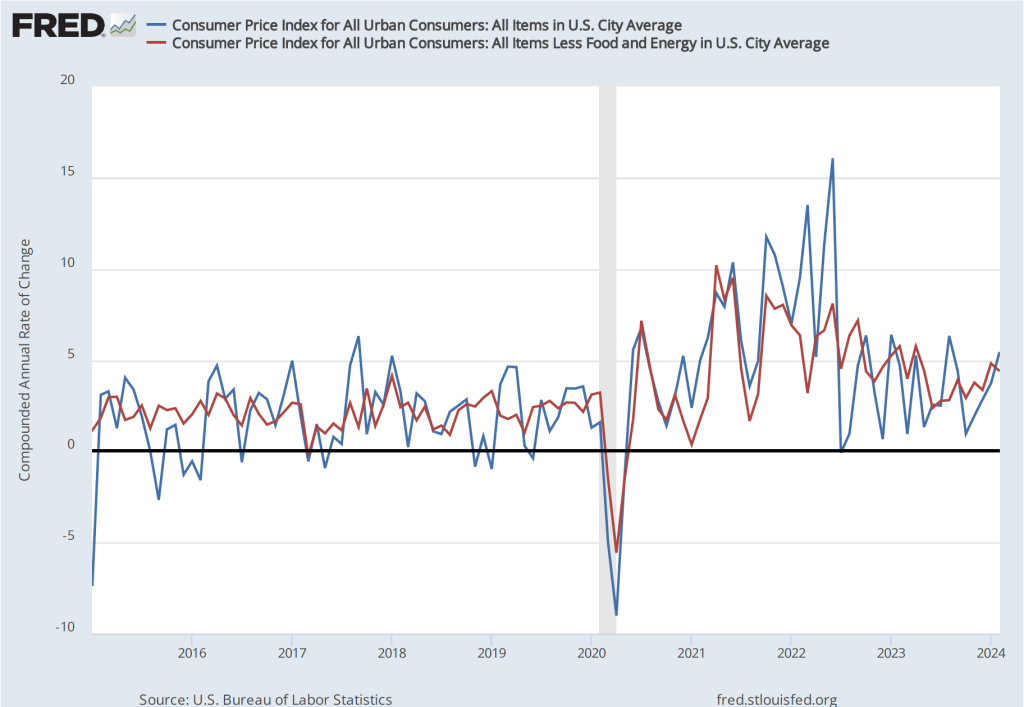
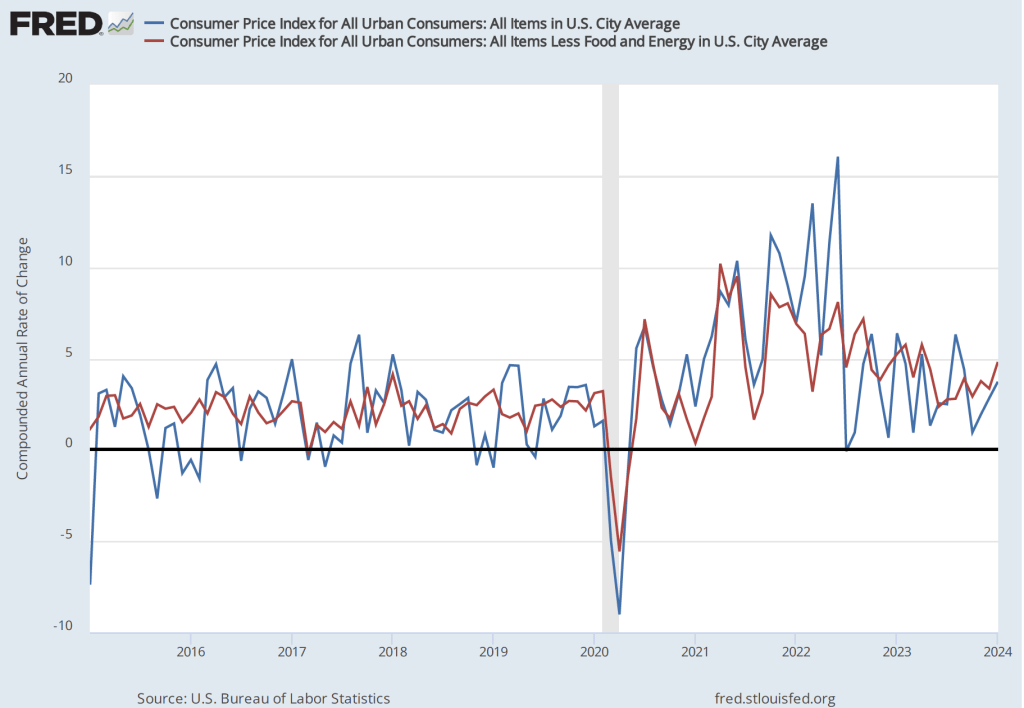
If we look at the 1-month inflation rate for headline and core inflation—that is the annual inflation rate calculated by compounding the current month’s rate over an entire year—the values seem to confirm that inflation, while still far below its peak in mid-2022, has been running somewhat higher than it did during the last months of 2023. Headline CPI inflation in March was 4.6 percent (down from 5.4 percent in February) and core CPI inflation was 4.4 percent (unchanged from February). It’s worth bearing in mind that the Fed’s inflation target is measured using the personal consumption expenditures (PCE) price index, not the CPI. But CPI inflation at these levels is not consistent with PCE inflation of only 2 percent.

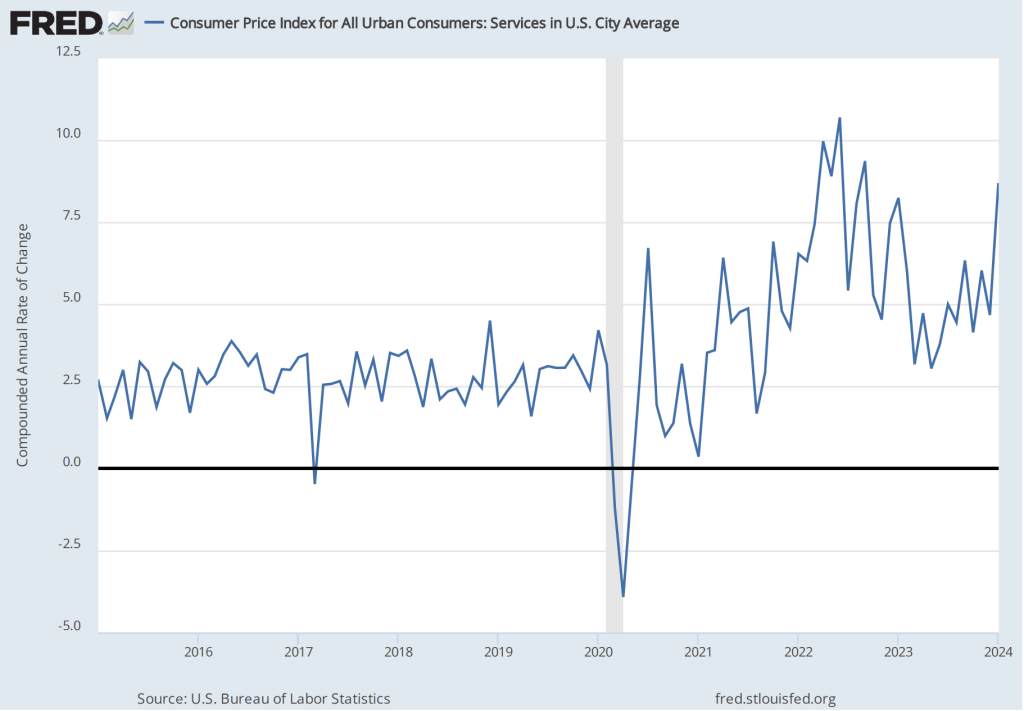
As has been true in recent months, the path of inflation in the prices of services has been concerning. As we’ve noted in earlier posts, Federal Reserve Chair Jerome Powell has emphasized that as supply chain problems have gradually been resolved, inflation in the prices of goods has been rapidly declining. But inflaion in services hasn’t declined nearly as much. Last summer he stated the point this way:
“Part of the reason for the modest decline of nonhousing services inflation so far is that many of these services were less affected by global supply chain bottlenecks and are generally thought to be less interest sensitive than other sectors such as housing or durable goods. Production of these services is also relatively labor intensive, and the labor market remains tight. Given the size of this sector, some further progress here will be essential to restoring price stability.”
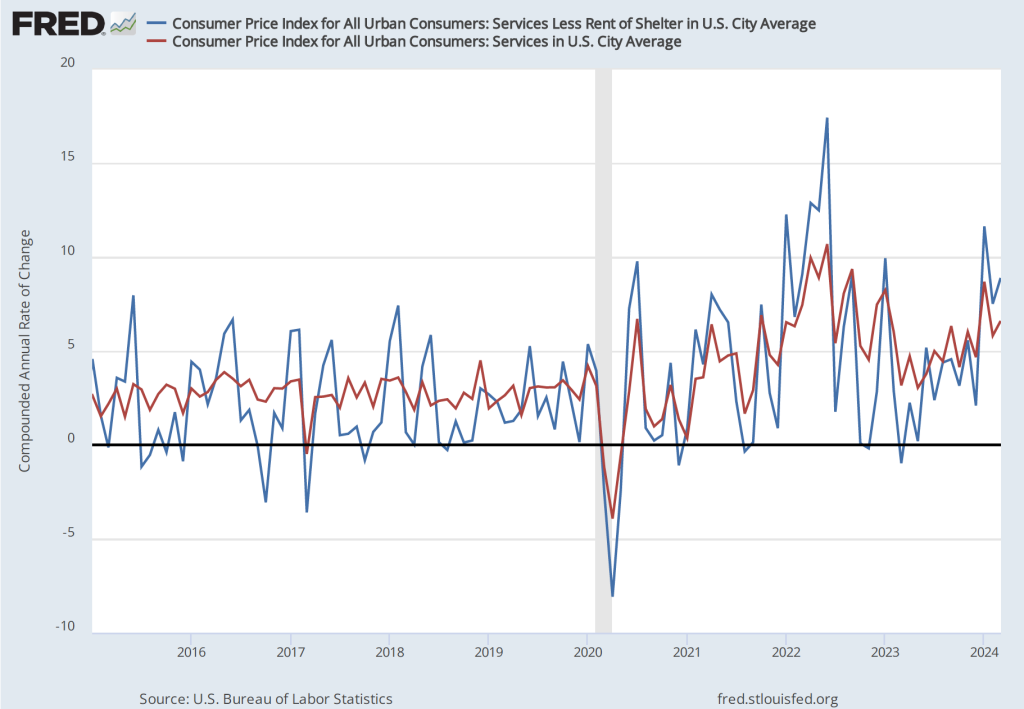
The following figure shows the 1-month inflation rate in services prices and in services prices not included including housing rent. Some economists believe that the rent component of the CPI isn’t well measured and can be volatile, so it’s worthwhile to look at inflation in service prices not including rent. The figure shows that inflation in all service prices has been above 4 percent in every month since July 2023. Inflation in service prices increased from 5.8 percent in February to 6.6 percent in March . Inflation in service prices not including housing rent was even higher, increasing from 7.5 percent in February to 8.9 percent in March. Such large increases in the prices of services, if they were to continue, wouldn’t be consistent with the Fed meeting its 2 percent inflation target.
Finally, some economists and policymakers look at median inflation to gain insight into the underlying trend in the inflation rate. If we listed the inflation rate in each individual good or service in the CPI, median inflation is the inflation rate of the good or service that is in the middle of the list—that is, the inflation rate in the price of the good or service that has an equal number of higher and lower inflation rates. As the following figure shows, although median inflation declined in March, it was still high at 4.3 percent. Median inflation is volatile, but the trend has been generally upward since July 2023.

Financial investors, who had been expecting that this CPI report would show inflation slowing, reacted strongly to the news that, in fact, inflation had ticked up. As of late morning, the Dow Jones Industrial Average had decline by nearly 500 points and the S&P 5o0 had declined by 59 points. (We discuss the stock market indexes in Macroeconomics, Chapter 6, Section 6.2 and in Microeconomics and Economics, Chapter 8, Section 8.2.) The following figure from the Wall Street Journal shows the sharp reaction in the bond market as the interest rate on the 10-year Treasury note rose sharply following the release of the CPI report.

Lower stock prices and higher long-term interest rates reflect the fact that investors have changed their views concerning when the Fed’s Federal Open Market Committee (FOMC) will cut its target for the federal funds and how many rate cuts there may be this year. At the start of 2024, the consensus among investors was for six or seven rate cuts, starting as early as the FOMC’s meeting on March 19-20. But with inflation remaining persistently high, investors had recently been expecting only two or three rate cuts, with the first cut occurring at the FOMC’s meeting on June 11-12. Two days ago, Neel Kashkari, president of the Federal Reserve Bank of Minneapolis raised the possibility that the FOMC might not cut its target for the federal funds rate during 2024. Some economists have even begun to speculate that the FOMC might feel obliged to increase its target in the coming months.
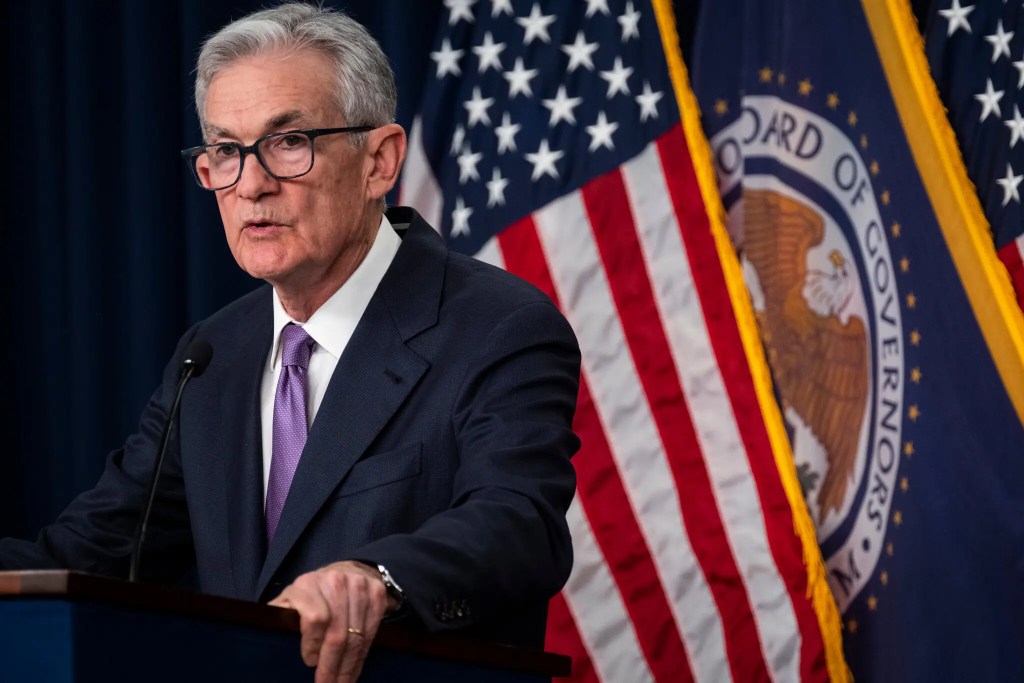
After the FOMC’s next meeting on April 30-May 1 first, Chair Powell may provide some additional information on the committee’s current thinking.