Photo courtesy of Lena Buonanno.
On the first Friday of each month, the Bureau of Labor Statistics (BLS) releases its “Employment Sitution” report for the previous month. The data for February in today’s report at first glance seem contradictory: The BLS reported that the net increase in employment in February was 275,000, which was above the increase of 200,000 that economists participating in media surveys had expected (see here and here). But the unemployment rate, which had been expected to remain constant at 3.7 percent, rose to 3.9 percent.
The apparent paradox of employment and the unemployment rate both increasing in the same month is (partly) attributable to the two numbers being from different surveys. The employment number most commonly reported in media accounts is from the establishment survey (sometimes referred to as the payroll survey), whereas the unemployment rate is taken from the household survey. The results of both surveys are included in the BLS’s monthly “Employment Situation” report. As we discuss in Macroeconomics, Chapter 9, Section 9.1 (Economics, Chapter 19, Section 19.1), many economists and policymakers at the Federal Reserve believe that employment data from the establishment survey provides a more accurate indicator of the state of the labor market than do either the employment data or the unemployment data from the household survey. Accordingly, most media accounts interpreted the data released today as indicating continuing strength in the labor market.
However, it can be worth looking more closely at the differences between the measures of employment in the two series because it’s possible that the household survey data is signalling that the labor market is weaker than it appears from the establishment survey data. The following table shows the data on employment from the two surveys for January and February.
| Establishment Survey | Household Survey | |
| January | 157,533,000 | 161,152,000 |
| February | 157,808,000 | 160,968,000 |
| Change | +275,000 | -184,000 |
Note that in addition to the fact that employment as measured by the household survey is falling, while employment as measured by the establishment survey is increasing, household survey employment is significantly higher in both months. Household survey employment is always higher than establishment survey employment because the household survey includes employment of three groups that are not included in the establishment survey:
- Self-employed workers
- Unpaid family workers
- Agricultural workers
(A more complete discuss of the differences in employment in the two surveys can be found here.) The BLS also publishes a useful data series in which it attempts to adjust the household survey data to more closely mirror the establishment survey data by, among other adjustments, removing from the household survey categories of workers who aren’t included in the payroll survey. The following figure shows three series—the establishment series (gray line), the reported household series (orange line), and the adjusted household series (blue line)—for the months since 2021. For ease of comparison the three series have been converted to index numbers with January 2021 set equal to 100.

Note that for most of this period, the adjusted household survey series tracks the establishment survey series fairly closely. But in November 2023, both household survey measures of employment begin to fall, while the establishment survey measure of employment continues to increase. Falling employment in the household survey may be signalling weakness in the labor market that employment in the establishment survey may be missing, but it might also be attributed to the greater noisiness in the household survey’s employment data.
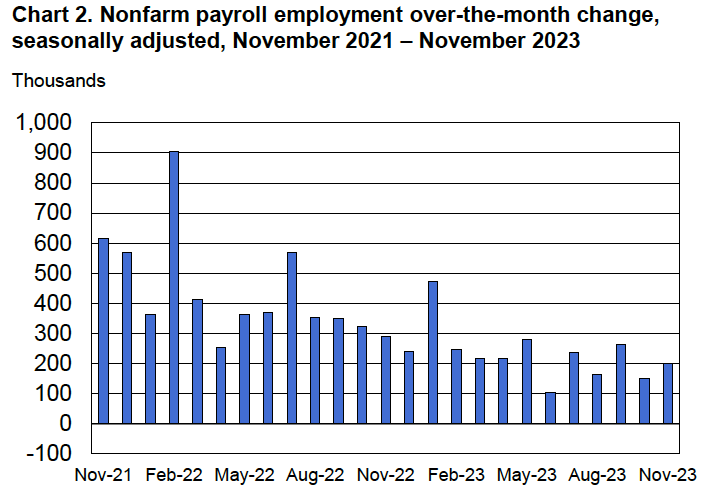
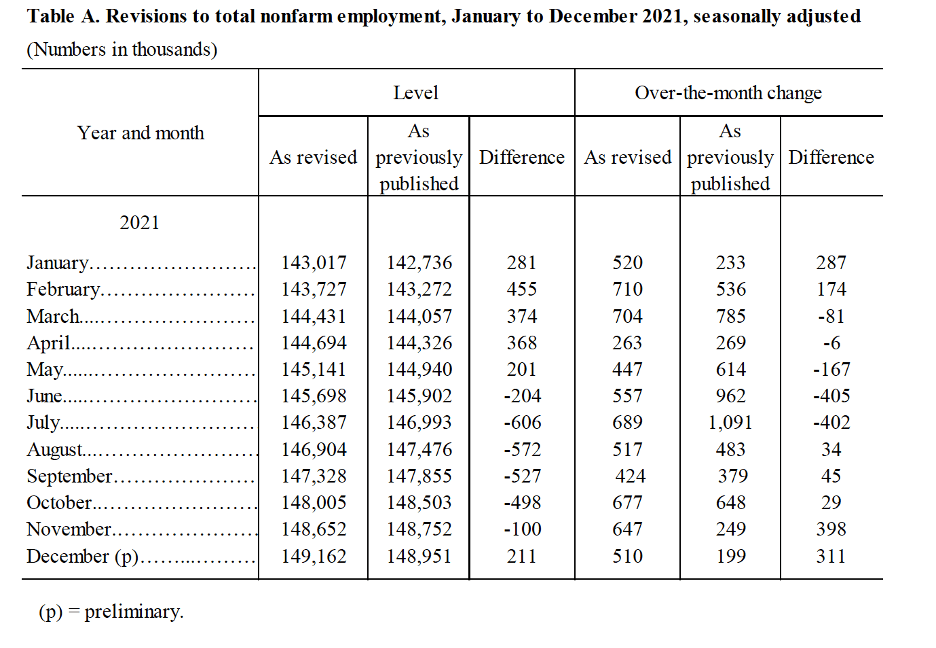
There are three other things to note in this month’s employment report. First, the BLS revised the initially reported increase in December establishement survey employment downward by 35,000 jobs and the January increase downward by 124,000 jobs. The January adjustment was large—amounting to more than 35 percent of the initially reported increase of 353,000. It’s normal for the BLS to revise its initial estimates of employment from the establishment survey but a series of negative revisions is typical of periods just before or at the beginning of a recession. It’s important to note, though, that several months of negative revisions to establishment employment are far from an infallible predictor of recessions.
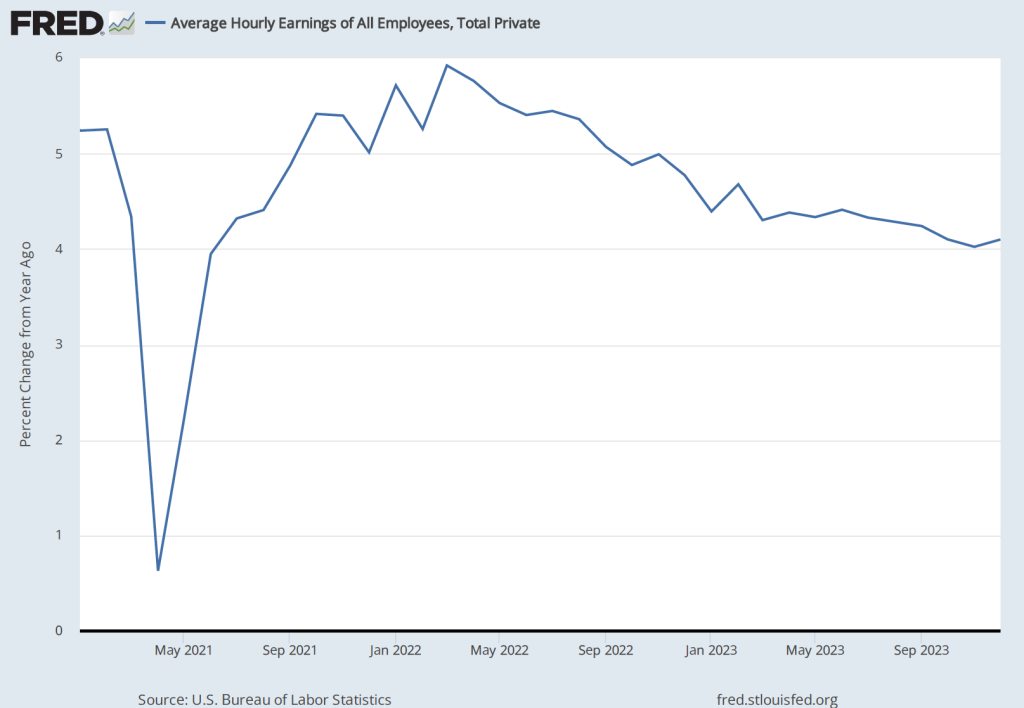
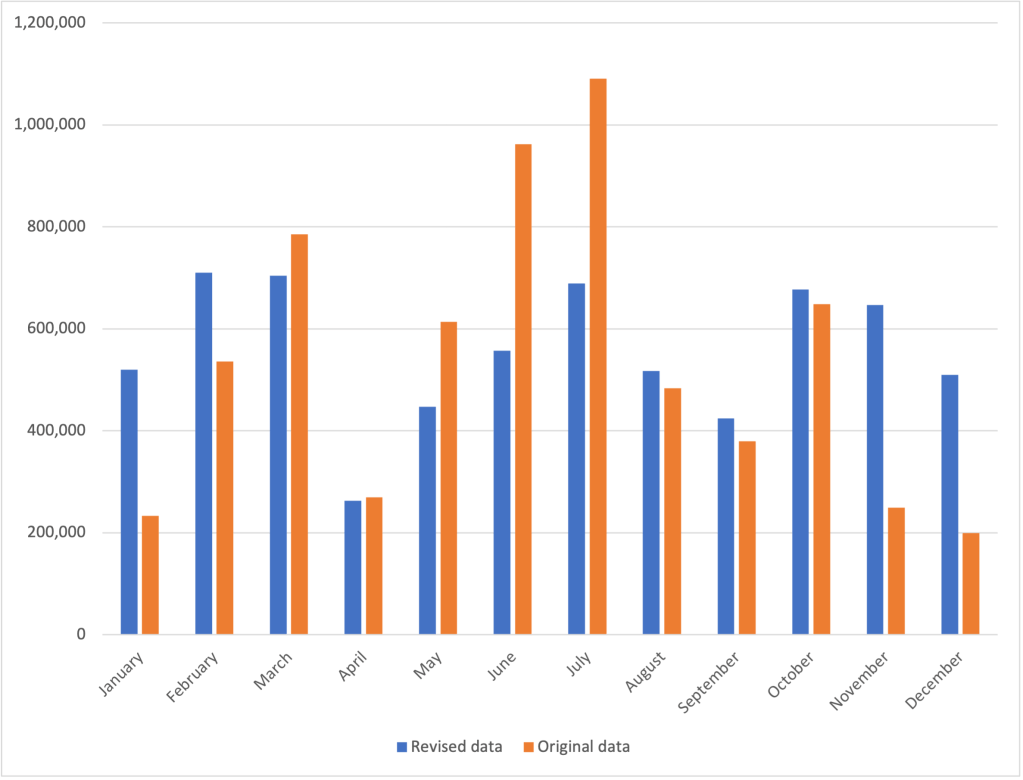
Second, as shown in the following figure, the increase in average hourly earnings slowed from the high rate of 6.8 percent in January to 1.7 percent in February—the smallest increase since early 2022.. (These increases are measured at a compounded annual rate, which is the rate wages would increase if they increased at that month’s rate for an entire year.) A slowing in wage growth may be another sign that the labor market is weakening, although the data are noisy on a month-to-month basis.

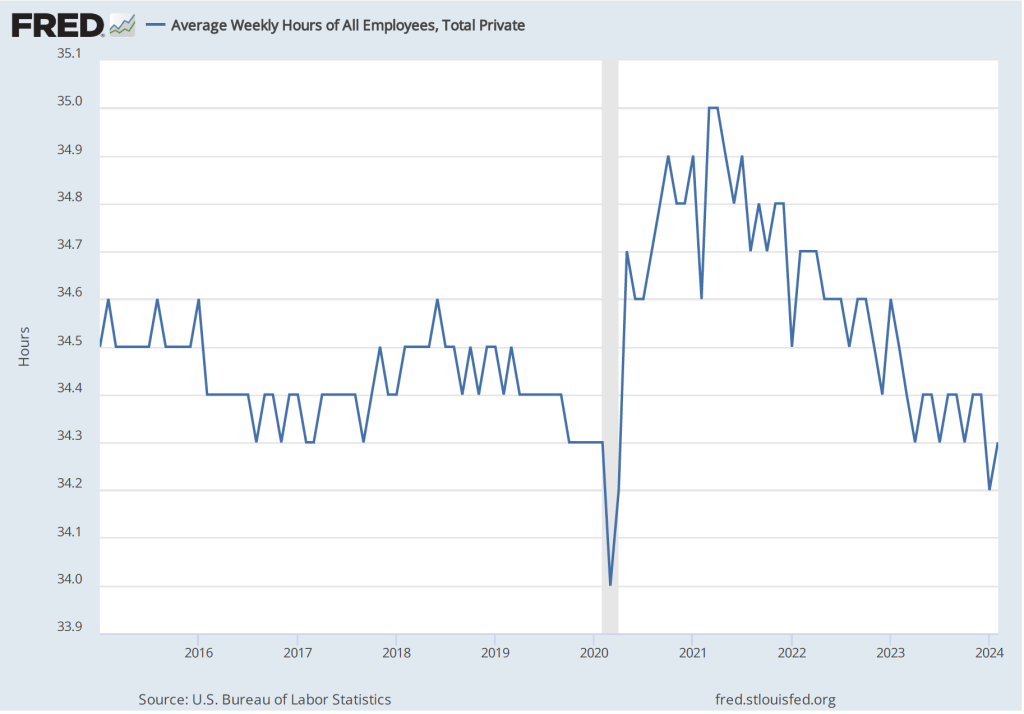
Finally, one positive indicator of the state of the labor market is that average weekly hours worked increased. As shown in the following figure, average hours worked had been slowly, if irregularly, trending downward since early 2021. In February, average hours worked increased slightly to 34.3 hours per week from 34.2 hours per week in January. But, again, it’s difficult to draw strong conclusions from one month’s data.
In testifying before Congress earlier this week, Fed Chair Jerome Powell noted that:
“We believe that our policy rate [the federal funds rate] is likely at its peak for this tightening cycle. If the economy evolves broadly as expected, it will likely be appropriate to begin dialing back policy restraint at some point this year. But the economic outlook is uncertain, and ongoing progress toward our 2 percent inflation objective is not assured.”
It seems unlikely that today’s employment report will change how Powell and the other memebers of the Fed’s Federal Open Market Committee evaluate the current economic situation.