On Sunday, February 6, the New York Times ran an article on Modern Monetary Theory (MMT) on the front page of its business section with the title, “Time for a Victory Lap.” Link here, subscription may be required. (Note: The title of the article was later changed on the nytimes.com site to “Is This What Winning Looks Like?” perhaps because of the controversy linked to below.)
The article led to a controversy on Twitter (but, then, what topic doesn’t lead to a controversy on Twitter?). Social media is, obviously, not always the best place to discuss economic theory and policy, but instructors and students interested in the debate may find the following links useful both because of the substantive issues raised and as an example of how debates over economic policy can sometimes become heated.
Harvard economist Lawrence Summers reacts negatively to the content of the New York Times article (and to MMT) here.
Economics blogger Noah Smith also reacts negatively to the article here. Smith’s blog post discussing the article at length is here, subscription may be required.
Former Fed economist Claudia Sahm defends the article (and MMT) here.
Jeanna Smialek, the author of the New York Times article, reacts to critics of the article here and to Noah Smith’s blog post here. Smith responds to her response here.
Jason Furman of Harvard’s Kennedy School provides a brief discussion of whether MMT has had much influence on monetary policy here.
We discuss MMT in the Apply the Concept, “Modern Monetary Theory: Should We Stop Worrying and Love the Debt?” in Macroeconomics, Chapter 16, Section 16.6 and in Economics, Chapter 26, Section 26.6.
On February 1, 2022, a headline in the Wall Street Journal noted that: “U.S. National Debt Exceeds $30 Trillion for the First Time.” The national debt—or, more formally, the federal government debt—is the value of all U.S. Treasury securities outstanding. Treasury securities include Treasury bills, which mature in one year or less; Treasury notes, which mature between 2 years and 10 years; Treasury bonds, which mature in 30 years; U.S. savings bonds purchased by individual investors; and Treasury Inflation-Protected Securities (TIPS), which, unlike other Treasury securities, have their principal amounts adjusted every six months to reflect changes in the consumer price index (CPI).
With a value of $30 trillion, the federal government debt in early February is about 120 percent of GDP, a record that exceeds the ratio of government debt to GDP during World War II. In 2007, at the beginning of the Great Recession of 2007–2009, the ratio of government debt to GDP was only 35 percent. (We discuss the federal government debt in Macroeconomics, Chapter 16, Section 16.6 and in Economics, Chapter 26, Section 26.6.)
There are many important economic issues involved with the federal government debt, but in this blog post we’ll focus just on the question of who owns the debt.
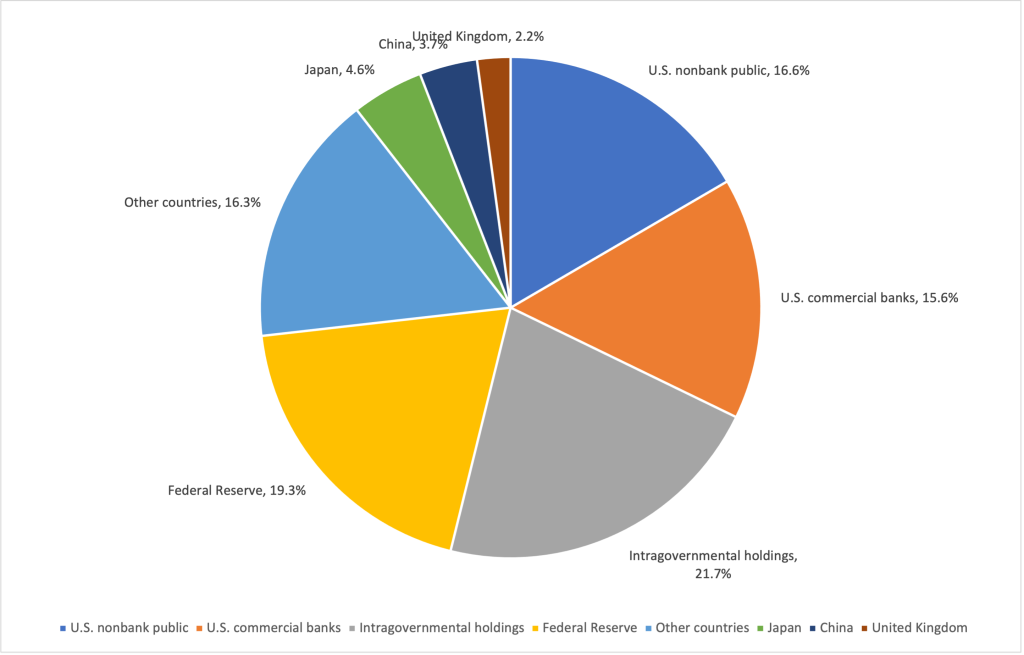
The pie chart below shows the shares of the debt held by different groups. The largest slice shown is for “intragovernmental holdings,” which represent ownership of Treasury securities by government trust funds, notably the Social Security trust funds. The Social Security system makes payments to retired or disabled workers. The system operates on a pay-as-you-go basis, which means that the payroll taxes collected from today’s workers are used to make payments to retired workers. Because of slowing population growth, Congress authorized an increase in payroll taxes above the level necessary to make current payments. The Social Security system has invested the surplus in special Treasury securities that the Treasury redeems when the funds are necessary to make payments to retired workers. (In the Apply the Concept “Is Spending on Social Security and Medicare a Fiscal Time Bomb?” in Macroeconomics, Chapter 16, Section 16.1, we discuss the long-term funding problems of the Social Security and Medicare systems.)
Some economists argue that the value of these Treasury securities should not be counted as part of the federal government debt because the securities are not marketable in the way that Treasury bills, notes, and bonds are and because the securities represent a flow of funds from one federal agency to another federal agency. If we exclude the value of these securities, the national debt on February 1, 2022 was $23.5 trillion rather than $30.0 trillion.
The Federal Reserve System holds about 19 percent of federal government debt. The Fed buys and sells Treasury securities as part of its normal conduct of monetary policy. In addition, the Fed accumulated large holdings of Treasury securities as part of its quantitative easing operations during and following the 2007–2009 financial crisis and from 2020 to 2022 during the worst of the Covid-19 pandemic. (We discuss quantitative easing in Macroeconomics, Chapter 15, Section 15.3.)
About 27 percent of the debt is held by foreign central banks, foreign commercial banks, and foreign investors. The largest amount of Treasury debt is held by Japan, followed by China and the United Kingdom. All other countries combined hold about 16 percent of the debt.
U.S. commercial banks hold more than 15 percent of the debt. Banks hold Treasury securities partly because since the 2007–2009 financial crisis most interest rates, including those on loans and on corporate and municipal bonds, have been very low compared with historic averages. The interest rates on these assets are in some cases too low to compensate banks for the risk of owning the assets rather than default-risk free Treasury securities. In addition, large banks are required to meet a liquidity coverage ratio, which means that they have to hold sufficient liquid assets—those that can be easily converted into cash—to meet their need for funds in a financial crisis. Many banks meet their liquidity requirements, in part, by owning Treasury securities.
The remaining Treasury securities—about 16.5 percent of the total federal government debt—are held by the U.S. nonbank public. The nonbank public includes financial firms—such as investment banks, insurance companies, and mutual funds—as well as individual investors.
Sources: Amara Omeokwe, “U.S. National Debt Exceeds $30 Trillion for First Time,” Wall Street Journal, February 1, 2022; “Debt to the Penny,” fiscaldata.treasury.gov; “Major Foreign Holders of Treasury Securities,” ticdata.treasury.gov; and Federal Reserve Bank of St. Louis.
Authors Glenn Hubbard and Tony O’Brien as they talk about the leading economic issue of early 2022 – inflation! They discuss the resurgence of inflation to levels not seen in 40 years due to a combination of miscalculations in monetary and fiscal policy. The role of Quantitative Easing (QE) – and its future – is discussed in depth. Listen today to gain insights into the economic landscape.
In November 2021, Congress passed and President Joe Biden signed the trillion dollar Infrastructure Investment and Jobs Act, often referred to as the Bipartisan Infrastructure Bill (BIF). The bill included funds for:
Highways and bridges
Buses, subways, and other mass transit systems
Amtrak, the federally sponsored corporation that provides most intercity railroad service in the United States, to modernize and expand its service
A network of charging stations for electric cars
Maintenance and modernization of ports and airports
Securing infrastructure against cyberattacks and climate change
Increasing access to clean drinking water
Expansion of broadband internet, particularly in rural areas
Treating soil and groundwater pollution
As with other infrastructure bills, although the federal government provides funding, much of the actual work—and some of the funding—is the responsibility of state and local governments. For instance, nearly all highway construction in the United States is carried out by state highway or transportation departments. These state government agencies design new highways and bridges and contract primarily with private construction firms to do the work.
Because state and local governments carry out most highway and bridge construction, Congress doesn’t always achieve the results they intended when providing the funding. Bill Dupor, an economist at the Federal Reserve Bank of St. Louis, has discovered a striking example of this outcome. In 2009, in response to the Great Recession of 2007–2009, Congress passed and President Barack Obama signed the American Recovery and Reinvestment Act (ARRA). (We discuss the ARRA in Macroeconomics, Chapter 16, Section 16.5 and Economics, Chapter 26, Section 26.5.) Included in the act was $27.5 billion in new spending on highways. This amount represented a 76 percent increase on previous levels of federal spending on highways. As Dupor puts it, Congress and the president had “great hopes for the potential of these new grants to create and save construction jobs as well as improve highways.”
Surprisingly, though, Dupor’s analysis of data on the condition of bridges, on miles of highways constructed, and on the number of workers employed in highway construction shows that the billions of dollars Congress directed to infrastructure spending under ARRA had little effect on the nation’s highways and bridges and did not increase employment on highway construction.
What happened to the $27.5 billion Congress had appropriated? Dupor concludes that after receiving the federal funds most state governments:”cut their own contributions to highway capital spending which, in turn, … [freed] up those funds for other uses. Since states were facing budget stress from declining tax revenues resulting from the recession, it stands to reason that states had the incentive to do so.”
He finds that following passage of ARRA many states cut their spending on highway infrastructure while at the same time increasing their spending on other things. For instance, Maryland cut its spending on highways by $73 per person while increasing its spending on education by $129 per person.
Can we conclude that that Congressional infrastructure spending under ARRA was a failure and the funds were wasted? To answer this question, first keep in mind that when it authorizes an increase in infrastructure spending, Congress often has two goals in mind:
To maintain and expand the country’s infrastructure
To engage in countercyclical fiscal policy
The first goal is obvious but the second can be important as well. Typically, Congress is most likely to authorize a large increase in infrastructure spending during a recession. When the ARRA was passed in the spring of 2009, Congress and President Obama were clear that they hoped that the increased spending authorized in the bill would reduce unemployment from the very high levels at that time. (Economists and policymakers debated whether additional countercyclical fiscal policy was needed at the time Congress passed the BIF in late 2021. Although the Biden administration argued that the spending was needed to increase employment, some economists argued that the BIF did little to deal with the supply problems then plaguing the economy.)
We discuss in Macroeconomics, Chapter 16, Section 16.2 (Economics, Chapter 26, Section 26.2), how expansionary fiscal policy can increase real GDP and employment during a recession. If Dupor’s analysis is correct, Congress failed to achieve its first goal of improving the country’s infrastructure. But Dupor’s findings that states, in effect, used the federal infrastructure funds for other types of spending, such as on education, means that Congress did meet its second goal. That conclusion holds if in the absence of receiving the $27.5 billion in funds from ARRA, state governments would have had to cut their spending elsewhere, which would have reduced overall government expenditures and reduced aggregate demand.
As this discussion indicates, the details of how fiscal policy affects the economy can be complex.
Sources: Gabriel T. Rubin and Eliza Collins, “What’s in the Bipartisan Infrastructure Bill? From Amtrak to Roads to Water Systems,” wsj.com, November 6, 2021; Bill Dupor, “So Why Didn’t the 2009 Recovery Act Improve the Nation’s Highways and Bridges?” Federal Reserve Bank of St. Louis Review, Vol. 99, No. 2, Second Quarter 2017, pp. 169-182; Greg Ip, “President Biden’s Economic Agenda Wasn’t Designed for Shortages and Inflation,” wsj.com, November 10, 2021; and Executive Office of the President, “Updated Fact Sheet: Bipartisan Infrastructure Investment and Jobs Act,” whitehouse.gov, August 2, 2021.
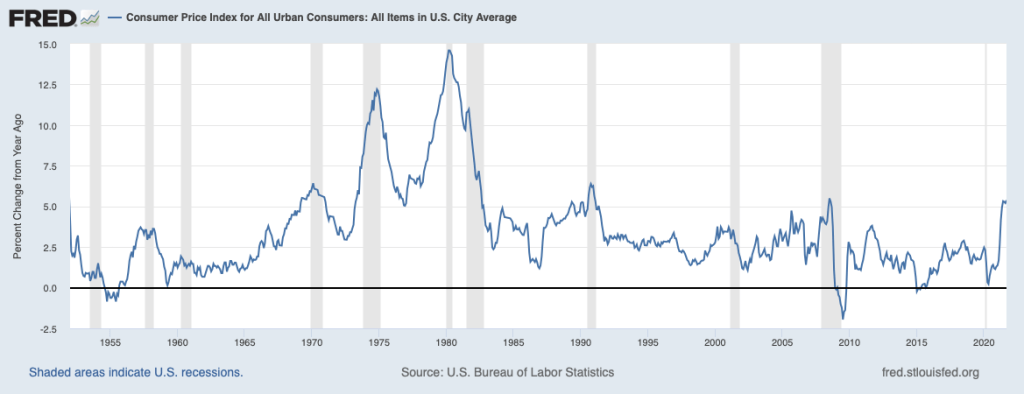
A recent publication by economists Regis Barnichon, Luiz E. Oliveira, and Adam H. Shapiro at the Federal Reserve Bank of San Francisco asks that provocative question. “The ‘60s” is a reference to the events that led to the U.S. economy experiencing more than 10 years of high inflation rates. Below is a graph similar to Chapter 15, Figure 15.1 in Macroeconomics (Economics, Chapter 25, Figure 25.1) that shows the inflation rate in the United States as measured by the percentage change in the Consumer Price Index (CPI) for each year since 1952. Economists call the years from 1968 though 1982 the “Great Inflation” because inflation was greater during that period than during any other period in the history of the United States.
As we discuss in Macroeconomics, Chapter 17, Section 17.2 (Economics, Chapter 27, Section 27.2), many economists believe that the Great Inflation began as a result of the Federal Reserve attempting to keep the unemployment rate below the natural rate of unemployment for a period of several years. As predicted by the Phillips Curve, the inflation rate increased and, as Milton Friedman and Edmund Phelps had argued would likely happen, the expected inflation rate eventually increased. The inflation was made worse during the 1970s by two supply shocks resulting from sharp increases in oil prices.
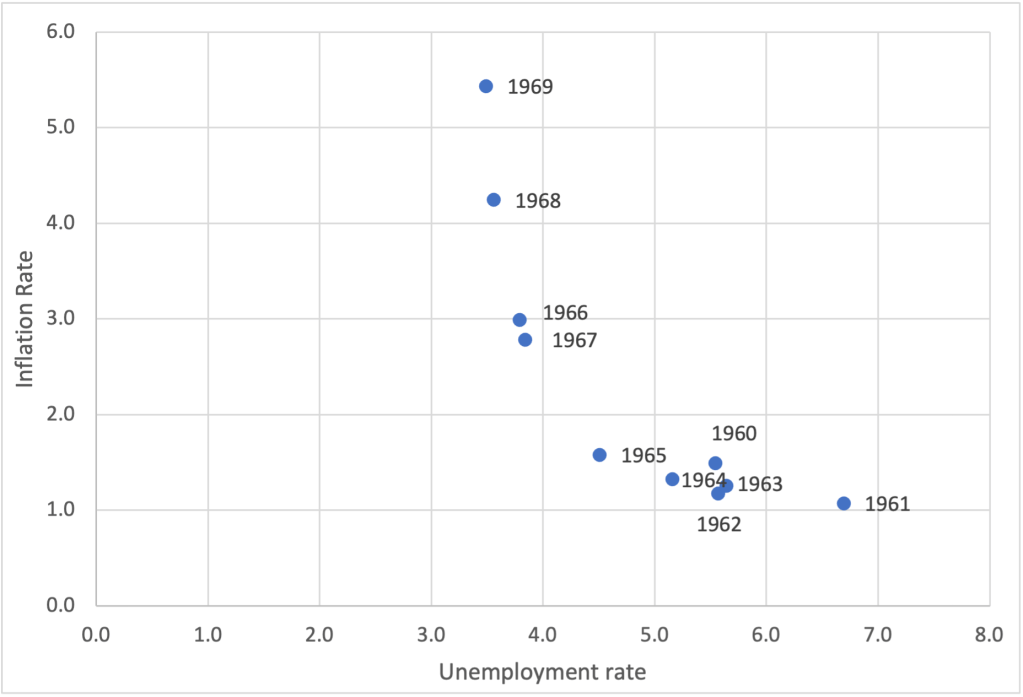
Is the United States on the edge of repeating the experience of the Great Inflation? Earlier this year, Olivier Blanchard of the Peterson Institute for International Economics wrote a paper arguing that the U.S. economy was at significant risk of experiencing a significant acceleration in inflation. His paper included a figure similar to the one below showing the combinations of inflation and unemployment during each year of the 1960s. The figure shows a substantial acceleration in inflation over the course of the decade.
Blanchard notes that:
“The history of the Phillips curve is one of shifts, largely due to the adjustment of expectations of inflation to actual inflation. True, expectations have [currently] been extremely sticky for a long time, apparently not reacting to movements in actual inflation. But, with such overheating, expectations might well deanchor. If they do, the increase in inflation could be much stronger.”
….
“If inflation were to take off, there would be two scenarios: one in which the Fed would let inflation increase, perhaps substantially, and another—more likely—in which the Fed would tighten monetary policy, perhaps again substantially. Neither of these two scenarios is ideal. In the first, inflation expectations would likely become deanchored, cancelling one of the major accomplishments of monetary policy in the last 20 years and making monetary policy more difficult to use in the future. In the second, the increase in interest rates might have to be very large, leading to problems in financial markets.”
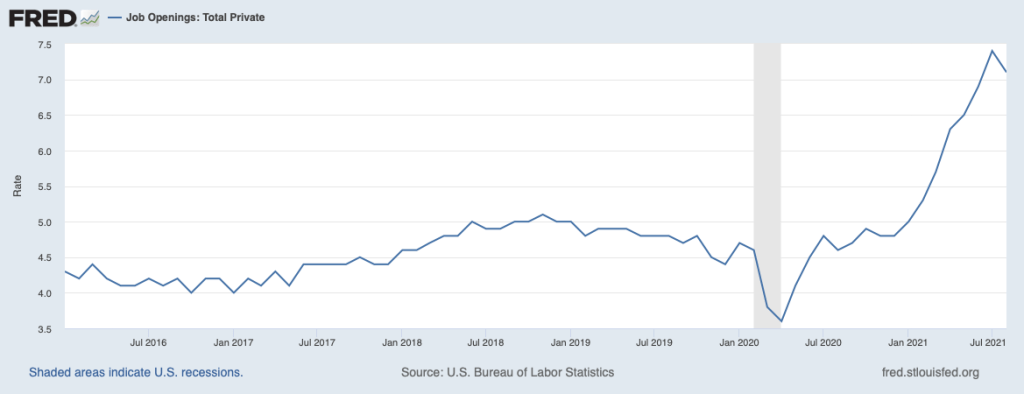
The authors of the San Francisco Fed publication are more optimistic. They begin their discussion by observing that because of the pandemic, the state of the labor market is more difficult to assess than in most years. They note that the unemployment rate of 4.8 percent in September 2021 was only slightly below the average unemployment rate over the past 30 years and well above the low unemployment rates of 2019 and early 2021. So, on the basis of the unemployment rate, policymakers at the Fed and in Congress might conclude that the inflation the U.S. economy is experiencing is not the result of overly tight labor markets such as those of the late 1960s. But the job openings rate(sometimes called the vacancy rate) is telling a different story. Job openings are positions that are both available to be filled within the next 30 days and for which firms are actively recruiting applicants from outside the firm. (According to the BLS: “The job openings rate is computed by dividing the number of job openings by the sum of employment and job openings and multiplying that quotient by 100.”)
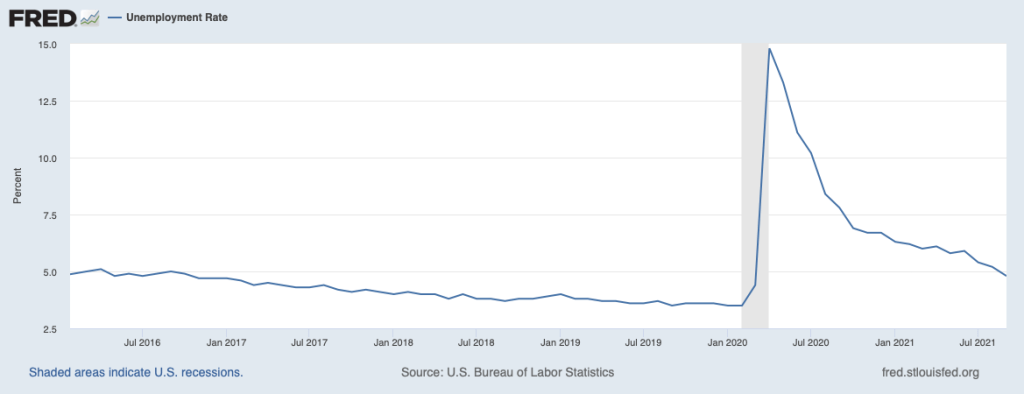
The authors of the San Francisco Fed study note that “the vacancy rate is well above its 30-year average … and has surpassed its historic highs from the late 1960s … indicating that employers are having a difficult time filling positions. Confirming this high vacancy rate, the fraction of small businesses reporting that job openings are hard to fill is at historic highs ….” The figures below show the vacancy rate and the unemployment rate since January 2016.
The authors combine the unemployment rate and the vacancy rate into a statistic—the vacancy-to-unemployment ratio—that they demonstrate has historically done a better job of explaining movements in inflation than has the unemployment rate. They expect that expansionary fiscal policy will result in an increase in vacancy-to-unemployment ratio and, therefore, an increase in the inflation rate. But they share the view of Blanchard and many other economists that a key issue is “the stability of longer-run inflation expectations.”
We know that in the 1960s, several years of rising inflation made long-run inflation expectations unstable—in terms of the discussion in Chapter 17, the short-run Phillips curve shifted up. We don’t yet know what will happen to inflation expectations in late 2021 and in 2022, so we can’t yet tell how persistent current rates of inflation will be.
Sources: Regis Barnichon, Luiz E. Oliveira, and Adam H. Shapiro, “Is the American Rescue Plan Taking Us Back to the ’60s?,” FRBSF Economic Letter, No. 2021-27, October 18, 2021; Olivier Blanchard, “In Defense of Concerns over the $1.9 Trillion relief Plan,” piie.com, February 18, 2021; and Federal Reserve Bank of St. Louis.
Authors Glenn Hubbard and Tony O’Brien discuss the economic impact of the recent infrastructure bill and what role fiscal policy plays in determining shovel-ready projects. Also, they explore the vast impact of the economy-wide supply-chain issues and the challenges companies face. Until the pandemic, we had a very efficient supply chain but now we’re seeing companies employ the “just-in-case” inventory method vs. “just-in-time”!
The G7 (or Group of 7) is an organization of seven large economies: Canada, France, Germany, Italy, Japan, the United Kingdom, and the United States. Only democratic countries are included, so China is not a member. At a recent meeting attended by U.S. Treasury Secretary Janet Yellen, the group agreed to adopt a uniform corporate tax rate of at least 15 percent.
Glenn discusses this decision in the following opinion column published in the Financial Times.
U.S. Treasury Secretary Janet Yellen and Paolo Gentiloni, European Commissioner for Economy, at a recent meeting of the G7.
Governments Should Tax Cash Flow, Not Global Corporate Income
From the Biden administration’s inception, US Treasury Secretary Janet Yellen has championed a global minimum tax for corporations. While the US walked back from a request for a 21 per cent rate (which was linked to an objective of raising the current US corporate tax of 21 per cent to between 25 and 28 per cent), it did lock in with G7 finance ministers a rate of at least 15 per cent. Secretary Yellen praised the move: “That global minimum tax would end the race to the bottom in corporate taxation, and ensure fairness for the middle class and working people in the US and around the world.”
It is tough to argue that corporate income shouldn’t pay its “fair share”. But the global minimum tax raises both political and economic questions.
Politics first. Approval in the US is likely to be tough. The minimum tax is estimated by the OECD to raise as much as $50bn-$80bn per year, much of it from successful American firms. Revenue to the US Treasury would be part of this amount, but small relative to the substantial expansion in spending proposed by the Biden administration. Will other governments engage their own political costs to achieve a deal that may be ephemeral if it fails to get US legislative approval? Even if the deal succeeds, might it hand a competitive victory to China? As a non-party to G7 or OECD proposals, could it not use both tax rates and subsidies to draw more investment to China?
But it is on economics that the global minimum tax draws more sensitive questions in two areas. The first is the design of the tax base. The second addresses the foundational question of the problem policymakers are trying to solve and whether the new minimum tax is the best way to do so.
A 15 per cent rate is not particularly useful without an agreement on what the tax base is. Particularly for the US, home to many very profitable technology companies, the concern should arise that countries will use special taxes and subsidies that effectively target certain industries. The US has had a version of a minimum tax of foreign earnings since the Tax Cuts and Jobs Act of 2017 enshrined GILTI (Global Intangible Low-Taxed Income) provision into law. The Biden administration wants to use the new global minimum tax to raise the GILTI rate and expand the tax base by eliminating a GILTI deduction for overseas plant and equipment investments.
For a 15 per cent minimum rate to make sense, countries would need a uniform tax base. Presumably, the goal of the new minimum tax is to limit the benefits to companies of shifting profits to low-tax jurisdictions, not to distort where those firms invest. The combination of a global minimum tax with the broad base advocated by the Biden administration could reduce cross-border investments and reduce the profitability of large multinational firms.
A still deeper economic issue is that of who bears the tax burden. I noted above that projected revenue increases are small compared to G7 government spending levels. It is not corporations who would pay more, but capital owners generally and workers, according to contemporary economic views of who bears the burden of the tax.
There is a better way to achieve what Yellen and her finance minister colleagues are trying to accomplish. To begin with, countries could allow full expensing of investment. That approach would move the tax system away from a corporate income tax toward a cash flow tax, long favoured by economists. In this revision, the minimum tax would not distort new investment decisions. It would also push the tax burden on to economic rents—profits in excess of the normal return to capital—better satisfying the apparent G7 goal of garnering more revenue from the most profitable large companies. And such a system would be simpler to administer, as multinationals would not need to set up different ways to track deductible investment costs over time in different countries.
In the debate leading up to the 2017 US tax law changes, Congress considered a version of this idea in a destination-based cash flow tax. Like a value added tax, this would tax corporate profits based on cash flows in a given country. The reform, which foundered on the political desirability of border adjustments, limits tax biases against investment and boosts tax fairness.
Returning to the numbers: countries with large levels of public spending relative to gross domestic product, as the Biden administration proposes, fund it mainly with value added taxes, not traditional corporate income taxes. A better global tax system is possible, but it starts with a verdict of “not GILTI.”
Glenn wrote the following opinion column for the New York Times.
How to Keep the Economy Booming — And Meet the Demand for Workers
In recent economic news, optimists and pessimists could both find evidence to support their outlooks.
The May jobs report showed a gain of 559,000 jobs in May and a decline in the unemployment rate to 5.8 percent. It also showed a marked improvement from last month’s weaker showing across a number of sectors, and average hourly earnings continued to rise. Ahead of the monthly report, the unemployment insurance weekly claims report on Thursday showed the number of new unemployment insurance claims fell from 405,000 the week before to 385,000 — lower than levels typically indicative of a recession (400,000). This is the first time this has happened since the pandemic-induced closures began. Further wage growth should help draw more workers back to the labor force.
Yet at the same time, the recent jobs report showed a big miss relative to the expected gain of 650,000 jobs. Constraints in supply chains and business reopenings still complicate the return to work. And workers still aren’t out of the woods: Thursday’s report indicated the total number of already unemployed individuals claiming benefits hasn’t dropped since mid-March. If job creation is robust, that contrast between falling new claims and those still on the jobless rolls is odd.
What explains these confounding tensions? To unpack them, consider the legacies of the economists John Maynard Keynes and Friedrich Hayek.
In his day, Keynes argued for boosting aggregate demand during a recession to keep workers afloat — a prescription that has clearly shaped the ultra-stimulative fiscal and monetary policies from both the Trump and the Biden administrations. His influence also resonates in the recent jobs reports: The coming rebound in the consumption of services — restaurant meals, entertainment and travel — will lift demand above its prepandemic level, and reopening and abundant consumer cash, bolstered by policy, will increase the demand for workers.
While Keynes may have lit the path to recovery after last spring’s cataclysmic job loss, he offers little to guide us through the coming labor-supply crunch. If policy actively disincentivizes the unemployed from returning to the fold, as recent reports suggest, there will be no one in place to meet the coming surge in demand, imperiling our economic rehabilitation.
To preserve the still-shaky recovery, we must now turn to Hayek, the godfather of free-market thinking. He argued that policy should allow workers to adjust to changes in the economy. Looking ahead, policymakers must consider curbing elevated unemployment benefits and a focus on old, prepandemic jobs in order to let workers and the economy adjust to new activities and new jobs that are more promising in the postpandemic world. We don’t want unemployed workers to find the postpandemic economy has passed them by.
As demand revives, supply will need to keep pace. Those in some industries, like carmakers, can simply sell off excess inventories, something that is already happening. Tool and machinery makers can increase imports to keep up. But eventually, demand must be met by higher domestic production from workers. Once businesses are freed from pandemic restrictions, we can expect to see some improvements in supply.
But holding back a faster improvement in employment and output are the very challenges Hayek identifies, including slowing down the process of matching dislocated workers to new, postpandemic jobs. That is to say, demand growth with supply constraints won’t produce the sustainable jobs recovery we need.
Many workers are taking their time to find a new job or are choosing to work less, thanks to their generous pandemic unemployment insurance benefits. These benefits provided extra income for those who lost their jobs early in the crisis. As a result, the economy’s adjustment to a postpandemic paradigm will be slow. These benefits also slow future gains in the form of higher wages workers might earn from a new and better job. But as Hayek tells us, the longer it takes for these workers to rejoin the work force, the longer it will take for them to gain these benefits.
In the coming months, we will be able to assess the potency of dealing with these forces of supply and demand by comparing employment gains in the 25 states choosing to end federal pandemic benefit supplements with the 25 states retaining them. While employment is likely to rise quickly as the pandemic fades and extra unemployment insurance benefits fall away, unemployment rates are still likely to remain high relative to prepandemic levels for another year.
If we look ahead, wage gains should be robust for those employed, particularly for lower-skilled service-sector workers — especially if some employees delay returning to work. Those higher real wages are good news for recipients.
A less welcome wild card would be inflationary pressures, fueled by demand outstripping supply. Those pressures could be a brief blip in an adjusting economy. Or they could suggest a reduction in purchasing power from higher inflation for an extended period. Higher recent inflation readings in consumer prices are a cause for concern.
Whether this happens hinges on whether the federal government and the Federal Reserve dial back their extra Keynesian demand support in time to avoid increases in expected inflation. Inflation risks robbing them of purchasing power gains from their higher wages.
The latest jobs report, then, favors a more Hayekian solution — with a nudge: Policy should support returning to work and matching workers to jobs by supporting re-employment and training for new skills, not just boosting demand. That shift offers the best chance for a sustained lift in jobs as well as demand as the pandemic recedes. In the matter Keynes v. Hayek, then: Let Hayek now prevail.
The current debate over monetary and fiscal policy has been particularly wide-ranging, touching on many of the issues we discuss in the policy chapters of the principles textbook.
Here are links to recent contributions to the debate.
Glenn and Tony discuss fiscal policy in a podcast HERE.
We discuss the Fed’s new monetary policy strategy HERE.
We discuss the current state of the labor market HERE.
The President’s Council of Economic Advisers discusses the need for additional fiscal policy measures in this POST on their blog.
An article on politico.com summarizes the debate HERE.
Harvard economist and former Treasury secretary Larry Summers has argued that fiscal and monetary policy have been too expansionary. A recent op-ed by Summers appears in the Washington PostHERE (subscription may be required).
Jason Furman, who was chair of the Council of Economic Advisers under President Obama gives his take on the division of opinion among academic economists in this Twitter THREAD.