On January 5, 2025 at the American Economic Association meetings in San Francisco, Jason Furman of Harvard’s Kennedy School, former Federal Reserve Chair Ben Bernanke (now of the Brookings Institution), former Council of Economic Advisers Chair Christina Romer of the University of California, Berkeley, and John Cochrane of Stanford’s Hoover Institition participated in a panel on “Inflation and the Macroeconomy.”
The discussion provides an interesting overview of a number of macroeconomic topics including:
The roles of aggregate demand shocks and aggregate supply shocks in explaining the sharp increase of inflation beginning in the spring of 2021.
The reasons for the Fed’s delay in responding to the increase in inflation.
Why macroeconomic forecasting models and most economists failed to anticipate the rise in inflation.
The role of the Fed’s 2020 monetary policy framework, how the Fed should revise the framework as a result of the review currently underway, and whether the Fed should change its inflation target. (We discuss the Fed’s monetary policy framework in several blog posts, including this one.)
The likely future course of inflation and the potential effects of the Trump Administration’s policies.
The likely consequences of large federal budget deficits.
Threats to Fed independence.
The discussion is fairly long at two hours, but most of it is nontechnical and should be understandable by students who have reached the monetary and fiscal policy chapters of a macroeconomic principles course (Chapters 15 and 16 of Macroeconomics; Chapters 25 and 26 of Economics).
Image generated by GTP-4o illustrating labor productivity
Several articles in the business press have discussed the recent increases in labor productivity. For instance, this article appeared in this morning’s Wall Street Journal (a subscription may be required).
The most widely used measure of labor productivity is output per hour of work in the nonfarm business sector. The BLS calculates output in the nonfarm business sector by subtracting from GDP production in the agricultural, government, and nonprofit sectors. (The definitions used by the Bureau of Labor Statistics (BLS) in estimating labor productivity are discussed in the “Technical Notes” that appear at the end of the BLS’s quarterly “Productivity and Costs” releases.) The blue line in the following figure shows the annual growth rate in labor productivity in the nonfarm business sector as measured by the percentage change from the same quarter in the previous year. The green line shows labor productivity growth in manufacturing.
As the figure shows, both labor productivity growth in the nonfarm business sector and labor productivity growth in manufacturing are volatile. The business press has focused on the growth of productivity in the nonfarm business sector during the period from the third quarter of 2023 through the third quarter of 2024. During this time, labor productivity has grown at an average annual rate of 2.5 percent. That growth rate is notably higher than the growth rate that many economists are expecting over the next 10 years. For instance, the Congressional Budget Office (CBO) has forecast that labor productivity will grow at an average annual rate of only 1.6 percent over the period from 2025 to 2034.
The CBO forecasts that the total numbers of hours worked in the economy will grow at an average annual rate of 0.5 percent. Combining that estimate with a 2.5 percent annual rate of growth of labor productivity results in output per person—a measure of the standard of living—increasing by 34 percent by 2034. If labor productivity increases at a rate of only 1.6 percent, then output per person will have increased by only 23 percent by 2034.
The standard of living of the average person in United States increasing 11 percent more would make a noticeable difference in people’s lives by allowing them to consume and save more. Higher rates of labor productivity growth leading to a faster growth rate of income and output would also increase the federal government’s tax revenues, helping to decrease federal budget deficits that are currently forecast to be historically large. (We discuss the components of long-run economic growth in Macroeconomics, Chapter 16, Section 16.7; Economics, Chapter 26, Section 26.7, and the economics of long-run growth in Macroeconomics, Chapter 11; Economics, Chapter 21.)
Can the recent growth rates in labor productivity be maintained over the next 10 years? There is an historical precedent. Labor productivity in the nonfarm business sector grew at an average annual rate of 2.6 percent between 1950 and 1973. But growth rates that high have proven difficult to achieve in more recent years. For instance, from 2008 to 2023, labor productivity grew at an average annual rate of only 1.5 percent. (We discuss the debate over future growth rates in Macroeconomics, Chapter 11, Section 11.3; Economics, Chapter 21, Section 21.3.)
The Wall Street Journal article we cited earlier provides an overview of some of the factors that may account for the recent increase in labor productivity growth rates. The 2020 Covid pandemic may have led to some increases in labor productivity. Workers who temporarily or permanently lost their jobs as businesses closed during the height of the pandemic may have found new jobs that better matched their skills, making them more productive. Similarly, businesses that were forced to operate with fewer workers, may have found ways to restore their previous levels of output with lower levels of employment. These changes may have led to one-time increases in labor productivity at some firms, but are unlikely to result in increased rates of labor productivity growth in the future.
Some businesses have used newly available generative artificial intelligence (AI) software to increase labor productivity by, for instance, using software to replace workers who previously produced marketing materials or responded to customer questions or complaints. It will take at least several years before generative AI software spreads throughout the economy, so it seems too early for it to have had a broad enough effect on the economy to be visible in the productivity data.
Note also that, as the green line in the figure above shows, manufacturing productivity has been lagging recently. From the third quarter of 2023 to the third quarter of 2024, labor productivity in manufacturing has increased at an annual average rate of only 0.4 percent. This slowdown is surprising given that over the long run productivity in manufacturing has typically increased faster than has productivity in the overall economy. It seems unlikely that labor productivity in the overall economy can sustain its recent growth rates if labor productivity growth in manufacturing continues to lag.
Finally, the productivity data are subject to revision as better estimates of output and of hours worked become available. It’s possible that what appear to be rapid rates of productivity growth during the last five quarters may turn out to have been less rapid following data revisions.
So, while the recent increase in the growth rate of labor productivity is an encouraging sign of the strength of the U.S. economy, it’s too soon to tell whether we have entered a sustained period of higher productivity growth.
Image showing scientific research generated by GTP-4o
Note: The following op-ed first appeared in the Wall Street Journal.
The Trump Economic Awakening
Traditional policies like tax cuts, targeted aid and responsible spending can deliver stronger growth.
Political scientists will debate the forces that shaped Donald Trump’s victory, but one thing is clear: Americans yearn for a change in economic policy. Voters have rejected the interventionist policies that brought inflation and high deficits. They want an economic awakening, a new way forward that uses traditional economic policies to achieve Mr. Trump’s goal of more jobs for Americans whose fortunes have been harmed by technological change and globalization.
Any economic path to a successful awakening begins with growth: the engine that powers individual income and our collective ability to support the nation’s defense, economy, education and healthcare industry. To pursue this growth, the new administration should consider at least three measures:
First, by working with Congress, it should build on the successes of the Tax Cuts and Jobs Act of 2017 to make permanent the expensing of business investment. Second, it should increase support for science and defense research, which would have significant spillover to the commercial sector, particularly in space exploration. Third, it should build on this research by constructing applied research centers around the country, linked to regional university and city hubs. Like the land-grant colleges of the 19th century, these centers would generate and distribute knowledge, improving local capabilities in manufacturing and services.
Opportunity is also a pillar of the awakening. Community colleges are an underfunded source of skill-building and mobility. As Austan Goolsbee, Amy Ganz and I proposed in a 2019 report, a modest federal block grant to support community colleges on the supply side—rather than a demand-side emphasis on financial aid—can help these schools push more Americans toward better jobs by working with local employers on skill needs and curriculum development. Targeted aid to places with depressed economic activity can help distribute opportunity to communities better than one-size-fits-all Washington-directed programs.
Corporate tax reform can play a role, too, by improving incentives for companies to settle and invest in the U.S. This can magnify opportunities for Americans, all without having to rely on costly tariffs.
Working a job doesn’t merely generate income; it also promotes human dignity. Enlisting more people into the workforce is thus another element of the economic-policy awakening. While growth and opportunity policies can boost labor-force participation, strengthening the earned-income tax credit to boost the incomes of childless workers can help attract younger people to the workforce. Maintaining the child tax credit can also provide parents with easier pathways toward economic participation.
These ideas share several important themes with Mr. Trump’s campaign and the traditional conservative playbook. They emphasize that policy ideas should be practical and workable, not merely rhetorical. Each makes use of America’s federalist system and innovative ethos. Making a priority of strong local involvement in applied research centers and community colleges and as tailoring place-based aid are more effective approaches than Washington diktats. Programs need to be held accountable for results, not simply allocated money.
This economic-policy awakening requires a clear-eyed assessment of budget trade-offs. Profligate spending with little regard for debt and inflation—à la the American Rescue Plan—contributed to Mr. Trump’s victory. It is possible to accomplish the steps above in a fiscally responsible way by offsetting spending and tax changes.
Organizing for the policy awakening’s success will be essential. Lack of communication among cabinet agencies can stymie creative ideas for expanding the economic pie for American workers. Like the president’s Working Group on Financial Markets, created by Ronald Reagan in 1988 to convene disparate agencies, the new administration would benefit from a senior executive team that can coordinate economic ideas and learn from leaders in business, labor and social services. Such a body, unlike the National Economic Council, could more adeptly cut across silos related to tax, trade, regulatory and industrial policy.
Voters have signaled they’re ready for an economic awakening. The president-elect, equipped with a new playbook and vision, should seize the opportunity.
Logo of the Congressional Budget Office from cbo.gov.
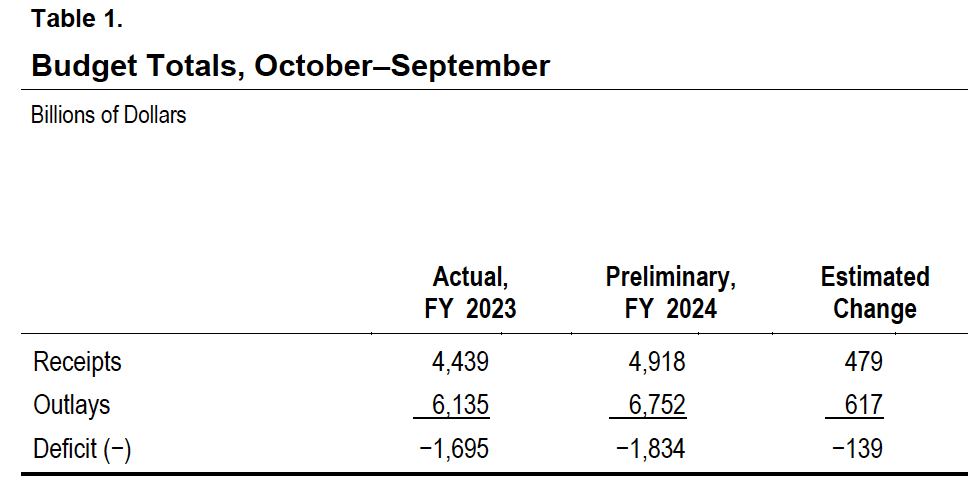
The federal government’s fiscal year runs from October 1 to September 30 of the following calendar year. The Congressional Budget Office (CBO) estimates that the federal government’s budget deficit for fiscal 2024, which just ended, was $1.8 trillion. (The Office of Management and Budget (OMB) will release the official data on the budget later this month.)
The federal budget deficit increased by about $100 billion from fiscal 2023, although the comparison of the deficits in the two years is complicated by the question of how to account for the $333 billion in student debt cancellation that President Biden ordered (which would reduce federal revenues by that amount) but which wasn’t implemented because of a decision by the U.S. Supreme Court.
The following table from the CBO report compares federal receipts and outlays for fiscal years 2023 and 2024. Recipts increased by $479 billion from 2023 to 2024, but outlays increased by $617 billion, resulting in an increase of $139 billion in the federal budget deficit.
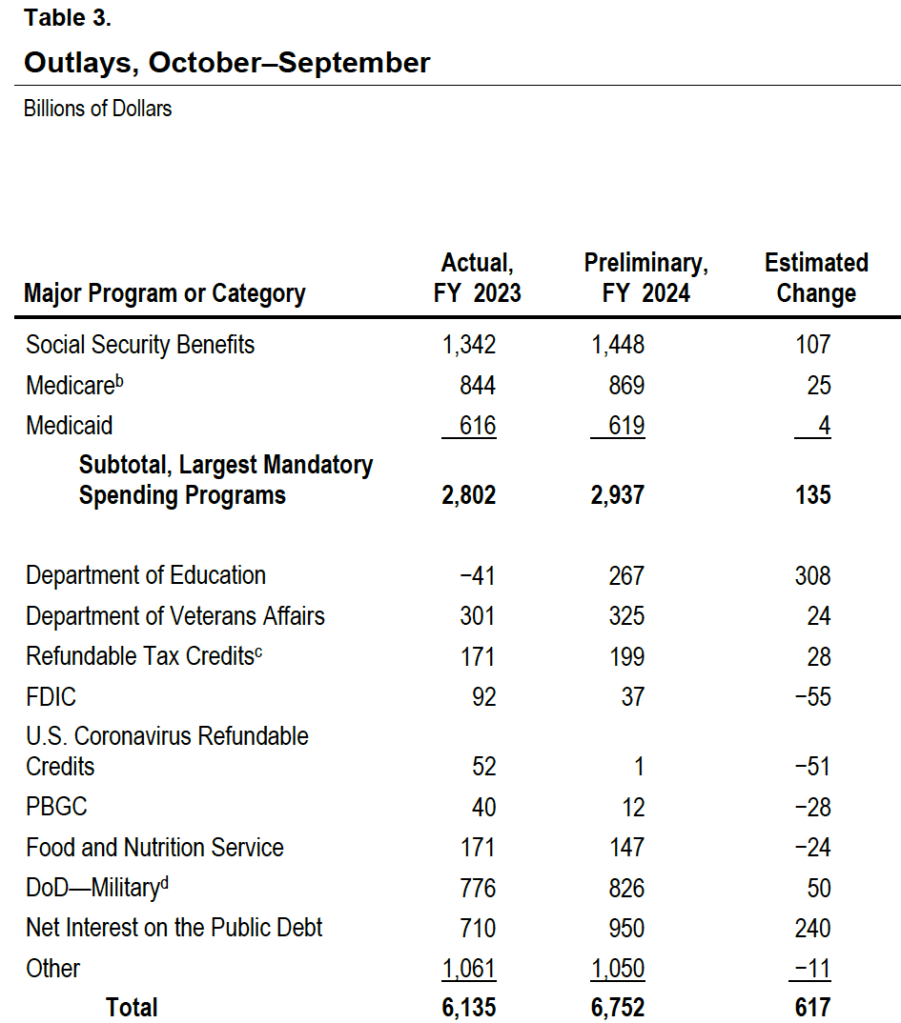
The following table shows the increases in the major spending categories in the federal budget. Spending on the Social Security, Medicare, and Medicaid programs increased by a total of $135 billion. The large increase in spending on the Department of Education is distorted by accounting for the reversal of the student debt cancellation following a Suprement Court ruling, as previously mentioned. The FDIC is the Federal Deposit Insurance Corporation, which had larger than normal expenditures in 2023 due the failure of several regional banks. (We discuss this episode in several earlier blog posts, including this one.) Interest on the public debt increased by $240 billion because of increases in the debt as a result of persistently high federal deficits and because of increases in the interest rates the Treasury has paid on new issues of bill, notes, and bonds necessary to fund those deficits. (We discuss the federal budget deficit and federal debt in Macroeconomics, Chapter 16, Section 16.6 (Economics, Chapter 26, Section 26.6).)
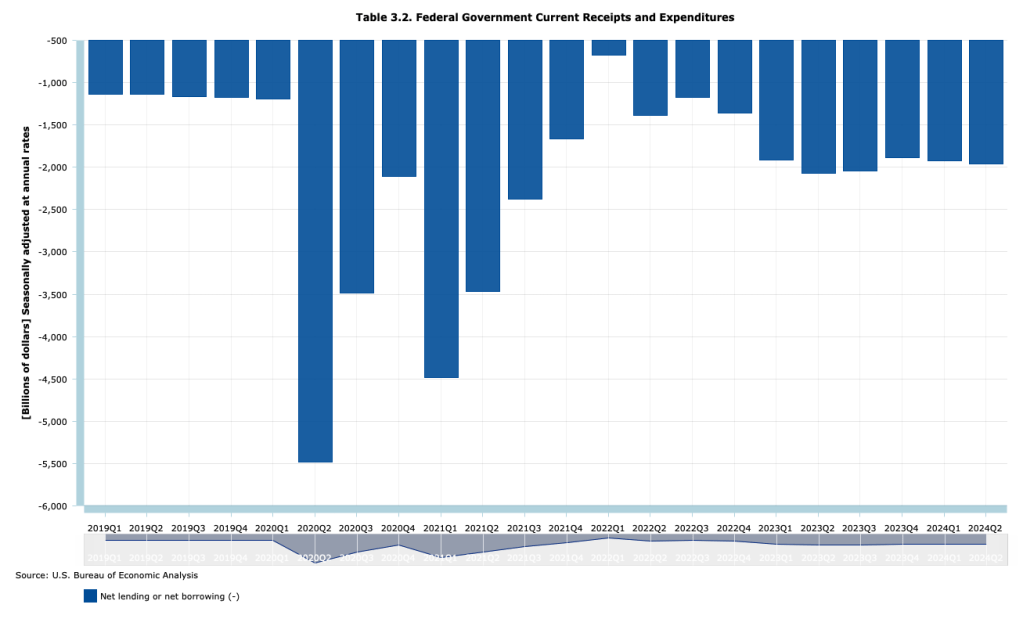
A troubling aspect of the large federal budget deficits is that they are occurring during a time of economic expansion when the economy is at full employment. The following figure, using data from the Bureau of Economic Analysis (BEA), shows that at an annual rate, the federal budget deficit has beening running between $1.9 trillion and $2.1 trillion each quarter since the first quarter of 2023, well after most of the federal spending increases to meet the Covid pandemic ended.
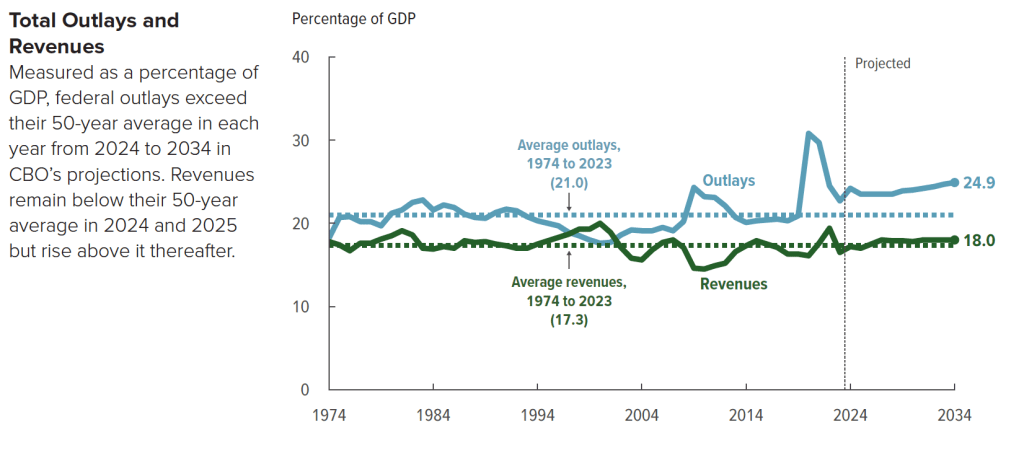
The following figure from the CBO shows trends in federal revenue and spending. From 1974 to 2023, federal spending averaged 21.o percent of GDP, but is forecast to rise to 24.9 percent of GDP by 2023. Federal revenue averaged 17.3 percent of GDP from 1974 to 2023 and is forecast to rise to 18.0 percent of GDP in 2034. As a result, the federal budget deficit, which had averaged 3.7 percent of GDP between 1974 and 2023 (already high in a longer historical context) will nearly double to 6.9 percent of GDP in 2034.
Slowing the growth of federal spending may prove difficult politically because the majority of spending increases are from manadatory spending on Social Security and Medicare, and from interest on the debt. Discretionary outlays are scheduled to decline in future years according to current law, but may well also increase if Congress and future presidents increase defense spending to meet the foreign challenges the country faces.
One possible course of future policy that would result in smaller future federal deficits is outlined in this post and the material at the included links.
Glenn serves on the the Grand Bargain Committee, chaired by Michael Strain of the American Enterprise Institute and Isabel Sawhill of the Brookings Institution. The committee, whose members span the political spectrum, have prepared a report that addresses some of the country’s most pressing economic and social problems.
Glenn and Michael Strain prepared the following introduction to the report. Below there is a link to the whole report.
The views expressed in this report are those of the individual authors who collectively constitute the Grand Bargain Committee, co-chaired by Michael R. Strain and Isabel V. Sawhill. This report was sponsored by the Center for Collaborative Democracy and was prepared independent of influence from the center and from any other outside party or institution. It is being published by the Bipartisan Policy Center as an example of how people with diverse views and political leanings can find common ground. The recommendations are strictly those of the policy experts and do not necessarily reflect the views of any organization or those of the BPC. All data are current as of November 2023.
By: Eric Hanushek, G. William Hoagland, Douglas Holtz-Eakin, R. Glenn Hubbard, Maya MacGuineas, Richard V. Reeves, Robert D. Resichauer, Gerard Robinson, Isabel V. Sawhill, Diane Schanzenbach, Richard Schmalensee, Michael R. Strain, and C. Eugene Steuerle.
Introduction
The United States faces serious economic and social challenges, including:
The underlying economic growth rate has slowed, as have opportunities for people to move up the economic ladder.
Our education system fails too many children and leaves many more with fewer opportunities than they deserve.
The nation is not rising to the challenge of addressing climate change.
Both our health care system and the health of our population need improvement.
Our income tax system is broken, generating tax revenue in an inefficient and unfair manner.
And the national debt is growing at an unsustainable pace, threatening long-term economic growth, crowding out needed investments in economic opportunity, and placing the nation’s ability to respond to a future crisis at risk.
To address these problems, the Center for Collaborative Democracy commissioned subject matter experts—progressives, centrists, and conservatives—to develop a “Grand Bargain” encompassing all six issues. The policy debate typically puts these problems into silos, and within each silo, powerful forces support the status quo. This report seeks to break down these silos. Dealing with them all at once—in a Grand Bargain—is a more promising strategy than dealing with them individually, because it allows for different parties to strike deals across policy issues, not just within a single issue.
For example, implementing a carbon tax to address climate change seems impossibly difficult. So does increasing accountability for teacher performance. Trading one for the other might be easier than pursuing both in isolation. Fixing the structural budget deficit by reducing entitlement spending is an enormous political challenge. So is increasing spending on programs that advance economic opportunity. Doing both at the same time could be more politically feasible than addressing them separately.
In this context, the group of experts met for several months in 2023 to share perspectives and ideas and to come up with sensible policies in each of these areas: economic growth and mobility; education; environment; health; taxes; and the federal budget. The end result is this report, which is being published by the Bipartisan Policy Center as an example of how people with diverse views and political leanings can find common ground.
This report is short, consisting of less than 30 pages of text. Its brevity is by design. This constraint forced the group to stay focused on issues and recommendations that matter the most. The focus of the report is on concepts. It is designed to answer such questions as, “How should the nation’s approach to education or to the federal budget change? What fundamental reforms are required to increase the underlying rates of economic growth and upward mobility?” Focusing on concepts means not focusing on policy details, including the details of implementing our recommendations and of transitioning across policy regimes. Our lack of attention to policy details does not mean we do not recognize their importance. Of course, we do, and many members of the group have spent much of their careers studying and designing public policies. Instead, we focus on concepts because we believe the United States needs to return to a discussion of first principles. This report advances that objective.
Not every member of the group agrees with every recommendation in this report. That is not surprising given the diversity of views in the group, and the difficulty and complexity of many of the issues we address. Despite this disagreement, we were able to have an informed and constructive discussion about these economic issues, to find compromises, and to come up with a set of recommendations that we believe, on balance, would greatly strengthen the country and improve people’s lives.
We believe in the importance of a market economy. Free markets have led to unprecedented growth and innovation, along with rising incomes, over the past three centuries. But government also has a role to play. To unleash more growth, we need to curtail unneeded or overly costly regulations and to create a tax system that encourages investment spending and innovation. To bring prosperity to more people, we need policies that will enable more people to benefit from economic growth through investment in their education and skills. For this reason, we put a great deal of emphasis on improving education for children, on training or retraining for adult workers, and on subsidizing the earnings of low-wage workers when necessary while maintaining a safety net for those who cannot work.
Our proposals are designed to advance certain underlying values and themes: Work and savings should be rewarded, investment should be encouraged over consumption, public assistance should be better targeted to those most in need, the tax system should be more progressive, and the nation should invest relatively more in the young and spend relatively less on the elderly.
Our specific proposals in each area are as follows:
On economic growth and mobility, we recommend investing in the education and training of workers, through community colleges and apprenticeships. We call for a more skill-based immigration system and for more immigrants; for encouraging innovation by investing more in basic research; for reducing taxes on new investment; for curbing unneeded regulation; for reducing the national debt; and for encouraging participation in economic life by increasing the generosity of earnings subsidies for low-wage workers.
On education, we recommend improving the teacher workforce at the K-12 level; paying teachers more but strengthening the link between pay and performance; maintaining educational standards and accountability while narrowing gaps by race and class; expanding school choice; and recognizing the role that parents and families must play in students’ learning.
On the environment, our main recommendation is to adopt a carbon tax. We also call for reducing methane emissions; expanding federal authority in the planning, siting, and permitting of the national electric transmission system; and repealing the renewable fuel standard that requires refiners to blend corn ethanol into the fuel they sell.
On health, we call for giving more attention to the social determinants of poor health with a focus on the need for better nutrition, for rationalizing existing subsidies for health care, and for reducing health care costs.
On taxes, we call for increasing tax revenue as a share of annual gross domestic product (GDP), and for that revenue to be raised in a manner that is more progressive, efficient, and simple than under current law, while also increasing the incentive to save and invest. For the business sector, that means allowing the expensing of investment expenditures and moving toward equal treatment of the corporate and noncorporate sectors.
On the federal budget, we recommend putting the debt as a share of annual GDP on a sustainable trajectory with a comprehensive package of reforms made up of a rough balance between tax increases and spending cuts in the initial years, phasing into a much larger share of the savings coming from spending cuts over time.
Most of these recommendations are at the federal level, but some are at the state and local level, particularly our education recommendations.
In the spirit of a Grand Bargain, these recommendations advance common goals and values through compromises both within and across policy areas. For example, one of our values is reflected in the goal of refocusing government spending on those who truly need it, and another is to restore fiscal responsibility. To accomplish this, we call for slower growth in Social Security and Medicare benefits for affluent seniors to reduce the major driver of the national debt, but we also protect vulnerable seniors and spend more on the education of children and on earnings subsidies for the working poor. We recommend adopting a carbon tax because it will simultaneously advance our goals of supporting the environment, increasing tax revenue, and boosting dynamism by encouraging innovation in the energy sector.
We believe the analysis and recommendations in this report point a path forward for the nation, but we offer them in a spirit of humility, understanding that others will disagree. We hope that this report catalyzes a much needed debate about the future of our nation.
Recent articles in the business press have discussed the possibility that the U.S. economy is entering a period of higher growth in labor productivity:
“US Productivity Is on the Upswing Again. Will AI Supercharge It?” (link)
“Can America Turn a Productivity Boomlet Into a Boom?” (link)
In Macroeconomics, Chapter 16, Section 16.7 (Economics, Chapter 26, Section 26.7), we highlighted the role of growth in labor productivity in explaining the growth rate of real GDP using the following equations. First, an identity:
Real GDP = Number of hours worked x (Real GDP/Number of hours worked),
where (Real GDP/Number of hours worked) is labor productivity.
And because an equation in which variables are multiplied together is equal to an equation in which the growth rates of these variables are added together, we have:
Growth rate of real GDP = Growth rate of hours worked + Growth rate of labor productivity
From 1950 to 2023, real GDP grew at annual average rate of 3.1 percent. In recent years, real GDP has been growing more slowly. For example, it grew at a rate of only 2.0 percent from 2000 to 2023. In February 2024, the Congressional Budget Office (CBO) forecasts that real GDP would grow at 2.0 percent from 2024 to 2034. Although the difference between a growth rate of 3.1 percent and a growth rate of 2.0 percent may seem small, if real GDP were to return to growing at 3.1 percent per year, it would be $3.3 trillion larger in 2034 than if it grows at 2.0 percent per year. The additional $3.3 trillion in real GDP would result in higher incomes for U.S. residents and would make it easier for the federal government to reduce the size of the federal budget deficit and to better fund programs such as Social Security and Medicare. (We discuss the issues concerning the federal government’s budget deficit in this earlier blog post.)
Why has growth in real GDP slowed from a 3.1 percent rate to a 2.0 percent rate? The two expressions on the right-hand side of the equation for growth in real GDP—the growth in hours worked and the growth in labor productivity—have both slowed. Slowing population growth and a decline in the average number of hours worked per worker have resulted in the growth rate of hours worked to slow substantially from a rate of 2.0 percent per year from 1950 to 2023 to a forecast rate of only 0.4 percent per year from 2024 to 2034.
Falling birthrates explains most of the decline in population growth. Although lower birthrates have been partially offset by higher levels of immigration in recent years, it seems unlikely that birthrates will increase much even in the long run and levels of immigration also seem unlikely to increase substantially in the future. Therefore, for the growth rate of real GDP to increase significantly requires increases in the rate of growth of labor productivity.
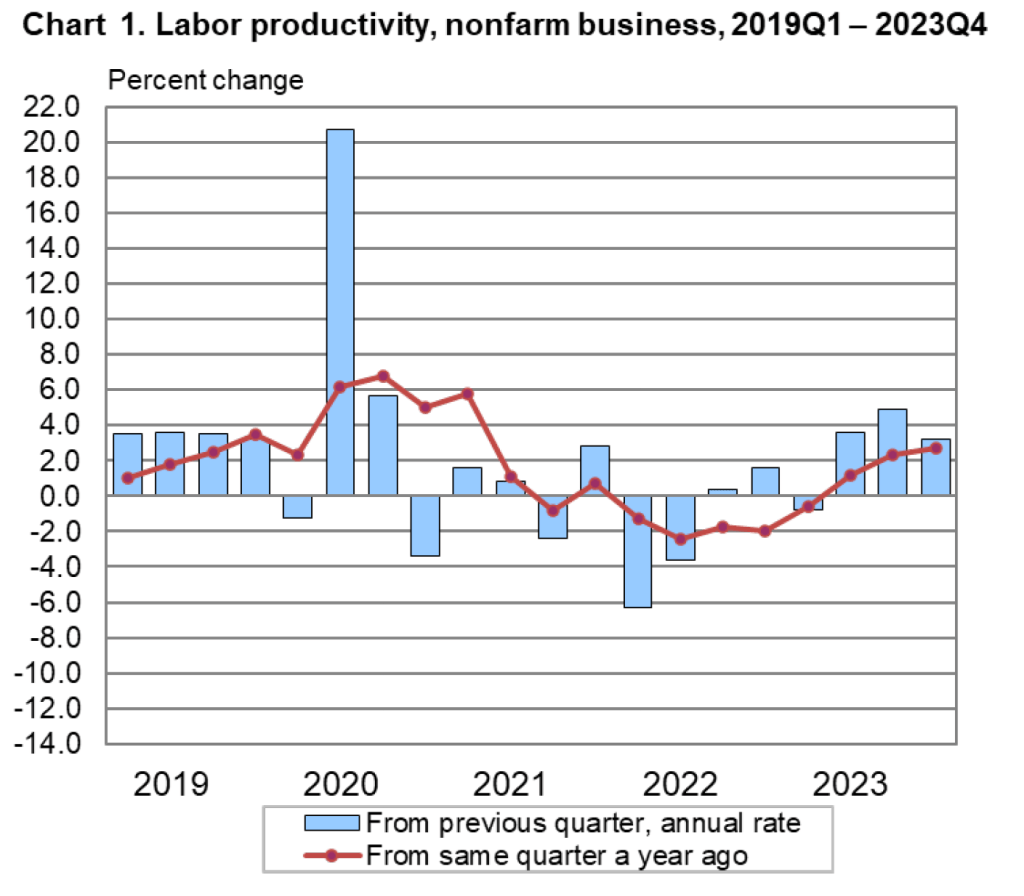
The Bureau of Labor Statistics (BLS) publishes quarterly data on labor productivity. (Note that the BLS series is for labor productivity in the nonfarm business sector rather than for the whole economy. Output of the nonfarm business sector excludes output by government, nonprofit businesses, and households. Over long periods, growth in real GDP per hour worked and growth in real output of the nonfarm business sector per hour worked have similar trends.) The following figure is taken from the BLS report “Productivty and Costs,” which was released on February 1, 2024.
Note that the growth in labor productivity increased during the last three quarters of 2023, whether we measure the growth rate as the percentage change from the same quarter in the previous year or as growth in a particular quarter expressed as anual rate. It’s this increase in labor productivity during 2023 that has led to speculation that labor productivity might be entering a period of higher growth. The following figure shows labor productivity growth, measured as the percentage change from the same quarter in the previous year for the whole period from 1950 to 2023.
The figure indicates that labor productivity has fluctuated substantially over this period. We can note, in particular, productivity growth during two periods: First, from 2011 to 2018, labor productivity grew at the very slow rate of 0.9 percent per year. Some of this slowdown reflected the slow recovery of the U.S. economy from the Great Recession of 2007-2009, but the slowdown persisted long enough to cause concern that the U.S. economy might be entering a period of stagnation or very slow growth.
Second, from 2019 through 2023, labor productivity went through very large swings. Labor productivity experienced strong growth during 2019, then, as the Covid-19 pandemic began affecting the U.S. economy, labor productivity soared through the first half of 2021 before declining for five consecutive quarters from the first quarter of 2022 through the first quarter of 2023—the first time productivity had fallen for that long a period since the BLS first began collecting the data. Although these swings were particularly large, the figure shows that during and in the immediate aftermath of recessions labor productivity typically fluctuates dramatically. The reason for the fluctuations is that firms can be slow to lay workers off at the beginning of a recession—which causes labor productivity to fall—and slow to hire workers back during the beginning of an economy recovery—which causes labor productivity to rise.
Does the recent increase in labor productivity growth represent a trend? Labor productivity, measured as the percentage change since the same quarter in the previous year, was 2.7 percent during the fourth quarter of 2023—higher than in any quarter since the first quarter of 2021. Measured as the percentage change from the previous quarter at an annual rate, labor productivity grew at a very high average rate of 3.9 during the last three quarters of 2023. It’s this high rate that some observers are pointing to when they wonder whether growth in labor productivity is on an upward trend.
As with any other economic data, you should use caution in interpreting changes in labor productivity over a short period. The productivity data may be subject to large revisions as the two underlying series—real output and hours worked—are revised in coming months. In addition, it’s not clear why the growth rate of labor productivity would be increasing in the long run. The most common reasons advanced are: 1) the productivity gains from the increase in the number of people working from home since the pandemic, 2) businesses’ increased use of artificial intelligence (AI), and 3) potential efficiencies that businesses discovered as they were forced to operate with a shortage of workers during and after the pandemic.
To this point it’s difficult to evaluate the long-run effects of any of these factors. Wconomists and business managers haven’t yet reached a consensus on whether working from home increases or decreases productivity. (The debate is summarized in this National Bureau of Economic Research Working Paper, written by Jose Maria Barrero of Instituto Tecnologico Autonomo de Mexico, and Steven Davis and Nicholas Bloom of Stanford. You may need to access the paper through your university library.)
Many economists believe that AI is a general purpose technology (GPT), which means that it may have broad effects throughout the economy. But to this point, AI hasn’t been adopted widely enough to be a plausible cause of an increase in labor productivity. In addition, as Erik Brynjolfsson and Daniel Rock of MIT and Chad Syverson of the University of Chicago argue in this paper, the introduction of a GPT may initially cause productivity to fall as firms attempt to use an unfamiliar technology. The third reason—efficiency gains resulting from the pandemic—is to this point mainly anecdotal. There are many cases of businesses that discovered efficiencies during and immediately after Covid as they struggled to operate with a smaller workforce, but we don’t yet know whether these cases are sufficiently common to have had a noticeable effect on labor productivity.
So, we’re left with the conclusion that if the high labor productivity growth rates of 2023 can be maintained, the growth rate of real GDP will correspondingly increase more than most economists are expecting. But it’s too early to know whether recent high rates of labor productivty growth are sustainable.
Glenn participated in this session hosted by the Society of Policy Modeling and the American Economic Association of Economic Educators and moderated by Dominick Salvatore of Fordham University. (Link to the page for this session in the ASSA program.)
Also making presentations at the session were Robert Barro of Harvard University, Janice Eberly of Northwestern University, Kenneth Rogoff of Harvard University, and John Taylor of Stanford University.
Here is the abstract for Glenn’s presentation:
Economic growth is foundational for living standards and as an objective for economic policy. The emergence of Artificial Intelligence as a General Purpose Technology, on the one hand, and a number of demographic and budget challenges, on the other hand, generate an unusually wide range of future economic outcomes. I focus on key ‘policy’ and ‘political economy’ considerations that increase the likelihood of a more favorable growth path given pre-existing trends and technological possibilities. By ‘policy,’ I consider mechanisms enabling growth through research, taxation, the scope of regulation, and competition. By ‘political economy’ factors, I consider mechanisms to increase economic participation in support of growth and policies that enhance it. I argue that both sets of mechanisms are necessary for a viable pro-growth economic policy framework.
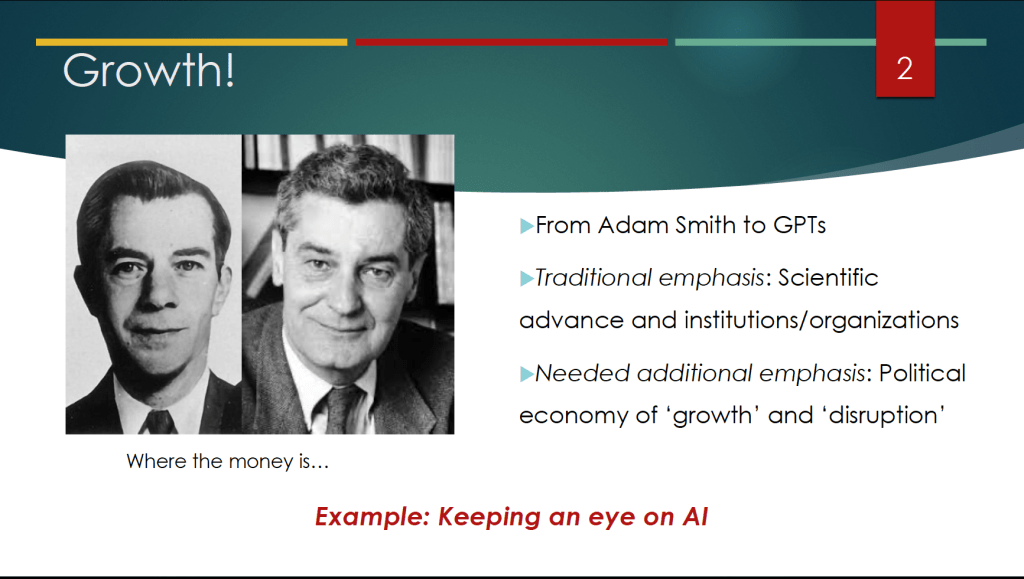
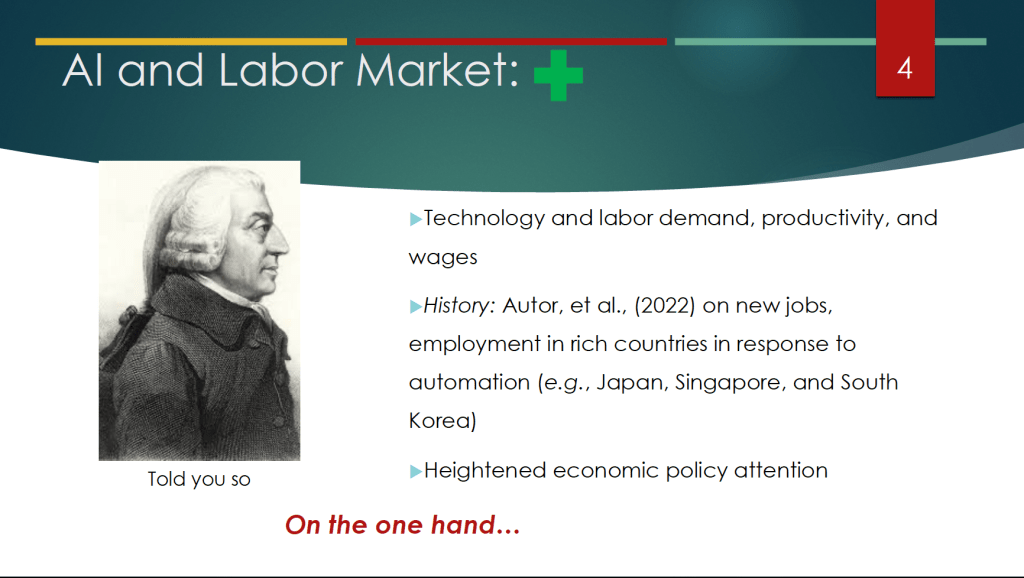
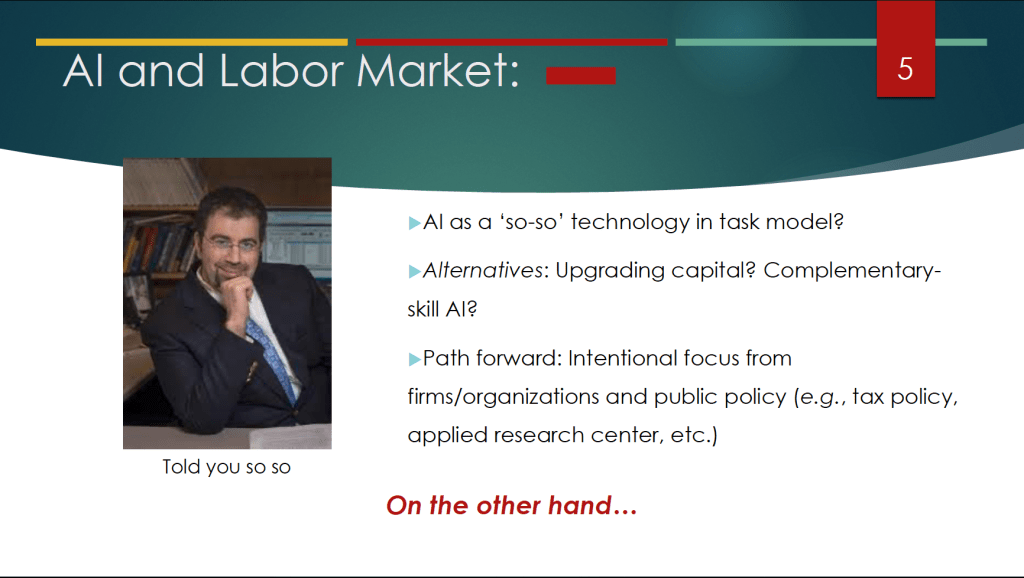
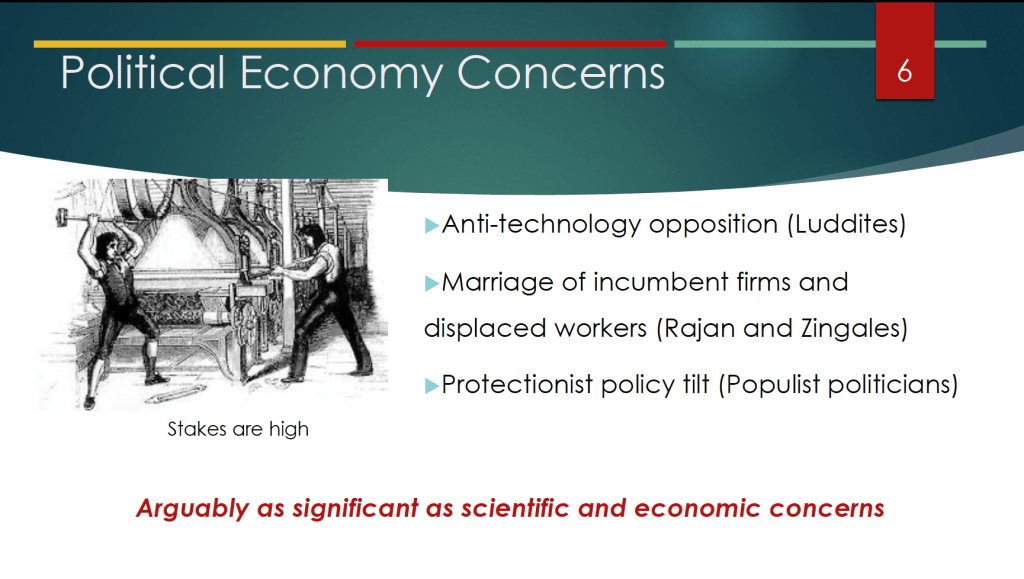
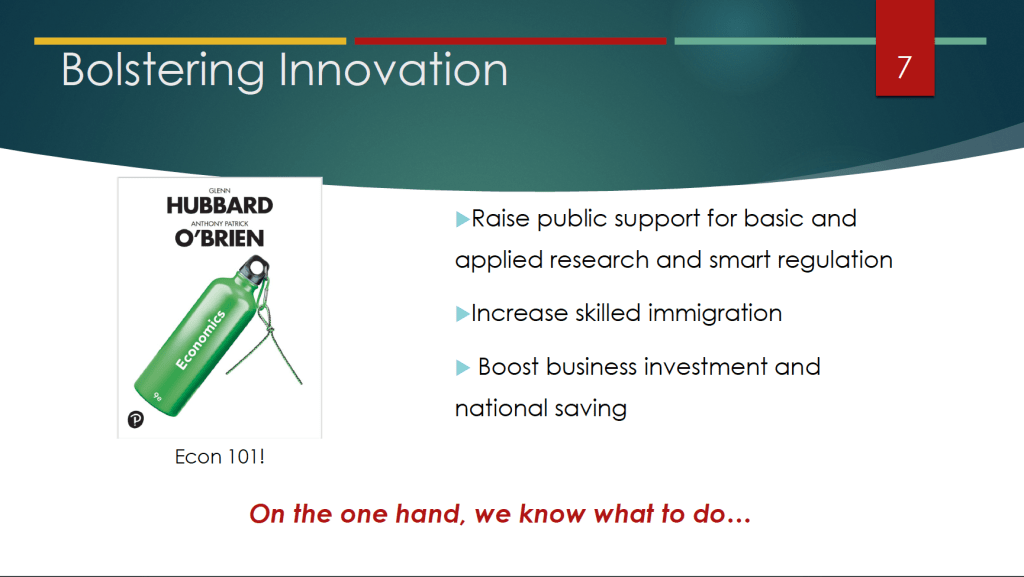
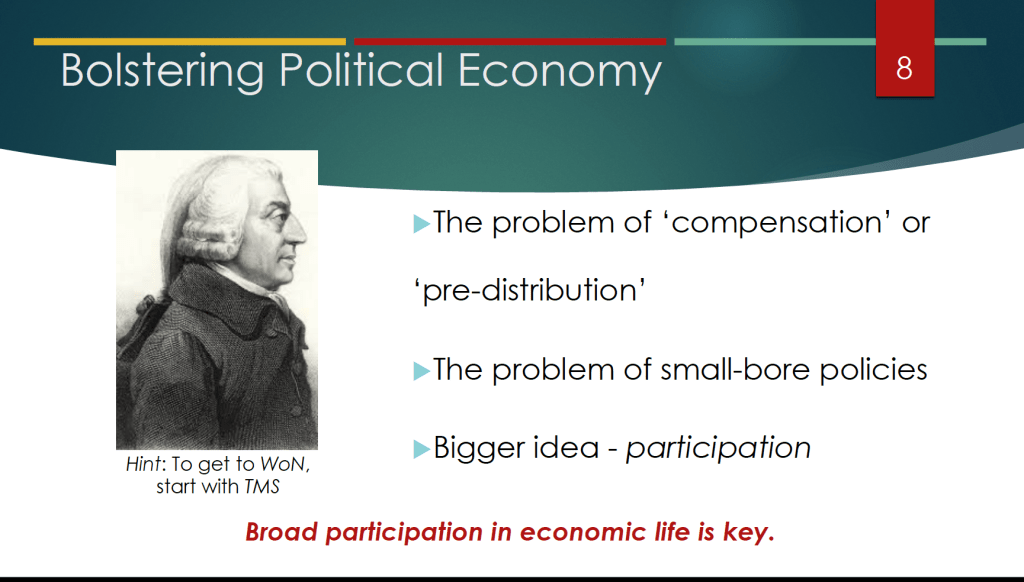
These slides from the presentation highlight some of Glenn’s key points. (Note the cover of the new 9th edition of the textbook in slide 7!)
A job fair in Jackson, Mississippi (photo from the Associated Press)
As part of the Social Security Act of 1935,Congress created the unemployment insurance program to make payments to unemployed workers. The program run jointly by the federal government and the state governments. It’s financed primarily by state and federal taxes on employers. States are allowed to determine which workers are eligible, the dollar amount of the unemployment benefit workers will receive, and for how long workers will receive the benefit.
What’s the purpose of the unemployment insurance program? A document published the U.S. Department of Labor explains that: “Unemployment compensation is a social insurance program. It is designed to provide benefits to most individuals out of work, generally through no fault of their own, for periods between jobs…. [Unemployment compensation] ensures that a significant proportion of the necessities of life can be met on a week-to-week basis while a search for work takes place.”
But the same document also notes that unemployment compensation “maintains [unemployed workers’] purchasing power which also acts as an economic stabilizer in times of economic downturn.” By “economic stabilizer,” the Department of Labor is noting that unemployment compensation is what in Macroeconomics, Chapter 16, Section 16.1 (Economics, Chapter 26, Section 26.1) we call an automatic stabilizer. An automatic stabilizer is a government spending or taxing program that automatically increases or decreases along with the business cycle.
As shown in the following figure, when the economy enters a recession, the total amount of unemployment compensation payments increases without the federal government or the state governments having to take any action because eligibility for the payments is already defined in existing law. So, during a recession, the unemployment insurance program helps to keep aggregate demand higher than it would otherwise be, which can lessen the severity of the recession.
As we discuss in Macroeconomics, Chapter 9, Section 9.3 (Economics, Chapter 19, Section 19.3), the unemployment insurance program can have an unintended effect. The higher the unemployment insurance payment a worker receives and the longer the worker receives it, the more likely the worker is to delay searching for another job. In other words, by reducing the opportunity cost of being unemployed, unemployment insurance benefits may unintentionally increase the length of unemployment spells—the amount of time the typical worker is unemployed.
During and immediately after the 2020 recession, the federal government increased the dollar amount of the unemployment insurance payments that workers received and extended the number of months workers could continue to receive these payments. Under the American Rescue Plan, a law which President Biden proposed and Congress passed in March 2021, workers receiving unemployment insurance benefits received an additional $300 weekly from March 2021 until September 6, 2021. Also, under the law, people, such as the self-employed and gig workers, would receive unemployment insurance benefits even though they had previously been ineligible to receive them. (Note the resulting spike during this period in the total dollar amount of unemployment insurance benefits as shown in the above figure.)
Some state governments were concerned that the extended benefits might cause some workers to delay taking jobs, thereby slowing the recovery of these states’ economies from the effects of the pandemic. Accordingly, 18 states stopped participating in the programs in June 2021, meaning that at that time unemployed workers would no longer receive the extra $300 per week and workers who prior to March 2021 hadn’t been eligible to receive unemployment benefits would again be ineligible.
Were unemployed workers in the states that ended the expanded unemployment insurance benefits in June more likely to become employed than were unemployed workers in states that continued the expanded benefits into September? On the one hand, ending the expanded benefits would increase the opportunity cost of not having a job. But, on the other hand, because government payments to workers would decline in these states, the result could be a decline in consumer spending that would decrease the demand for labor. Which of these effects was larger would determine whether employment increased or decreased in the states that ended expanded unemployment benefits early.
Glenn, along with Harry Holzer of Georgetown University and Michael Strain of the American Enterprise Institute, carried out an econometric analysis to explore the effects ending expanded unemployment benefits early had on the labor markets in those states. They find that:
Among unemployed workers ages 25 to 54 (“prime-age workers”), ending the expanded unemployment benefit program increased the number of workers in those states who moved from being unemployed to being employed by 14 percentage points.
Among prime-age workers, the employment-to-population ratio in those states increased by about 1 percentage point.
Among prime-age workers, the unemployment rate in those stated decreased by about 0.9 percentage point.
These estimates indicate that the effect of ending the expanded unemployment benefit program raised the opportunity cost of being unemployed more than it decreased the demand for labor by reducing the incomes of some household. But what about the larger question of whether households were made better or worse off as a result of ending the program early? The authors find that ending the program early decreased the share of households that had no difficulty meeting expenses. They, therefore, conclude that the effects on household well-being of ending the program early are ambiguous.
The paper presenting these results can be found here. Warning! The econometric analysis is quite technical.
During 2023, GDP and employment have continued to expand. Between the second quarter of 2022 and the second quarter of 2023, nominal GDP increased by 6.1 percent. From July 2022 to July 2023, total employment increased by 3.3 million as measured by the establishment (or payroll) survey and by 3.0 as measured by the household survey. (In this post, we discuss the differences between the employment measures in the two surveys.)
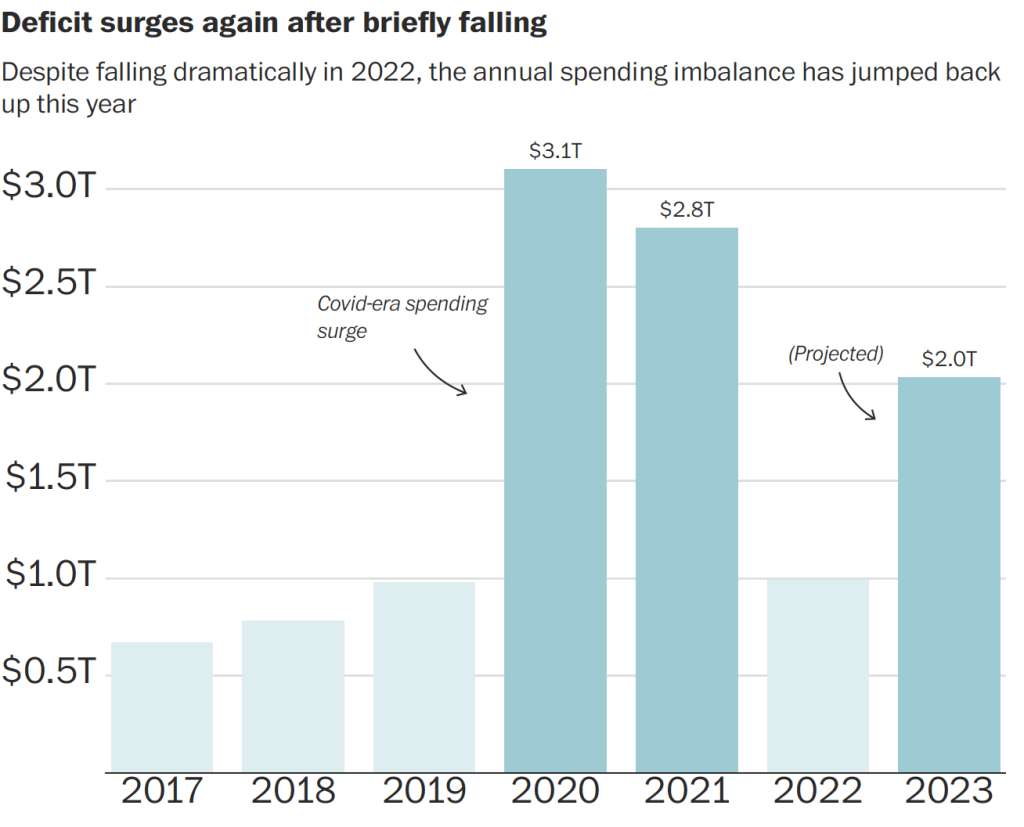
We would expect that with an expanding economy, federal tax revenues would rise and federal expenditures on unemployment insurance and other transfer programs would decline, reducing the federal budget deficit. (We discuss the effects of the business cycle on the federal budget deficit in Macroeconomics, Chapter 16, Section 16.6, Economics, Chapter 26, Section 26.6, and Essentials of Economics, Chapter 18, Section 18.6.) In fact, though, as the figure from the Congressional Budget Office (CBO) at the top of this post shows, the federal budget deficit actually increased substantially during 2023 in comparison with 2022. The federal budget deficit from the beginning of government’s fiscal year on October 1, 2022 through July 2023 was $1,617 billion, more than double the $726 billion deficit during the same period in fiscal 2022.
The following figure from an article in the Washington Post uses data from the Committee for a Responsible Federal Budget to illustrate changes in the federal budget deficit in recent years. The figure shows the sharp decline in the federal budget deficit in 2022 as the economic recovery from the Covid–19 pandemic increased federal tax receipts and reduced federal expenditures as emergency spending programs ended. Given the continuing economic recovery, the surge in the deficit during 2023 was unexpected.
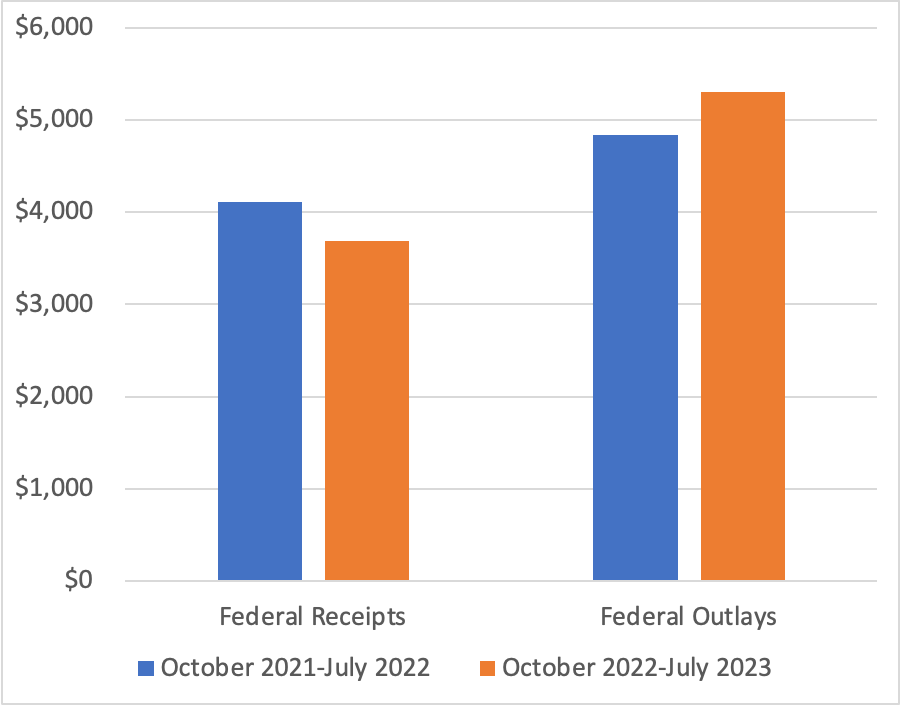
As the following figure shows, using CBO data, federal receipts—mainly taxes—are 10 percent lower this year than last year, and federal outlays—including transfer payments—are 11 percent higher. For receipts to fall and outlays to increase during an economic expansion is very unusual. As an article in the Wall Street Journal put it: “Something strange is happening with the federal budget this year.”
Note: The values on the vertical axis are in billions of dollars.
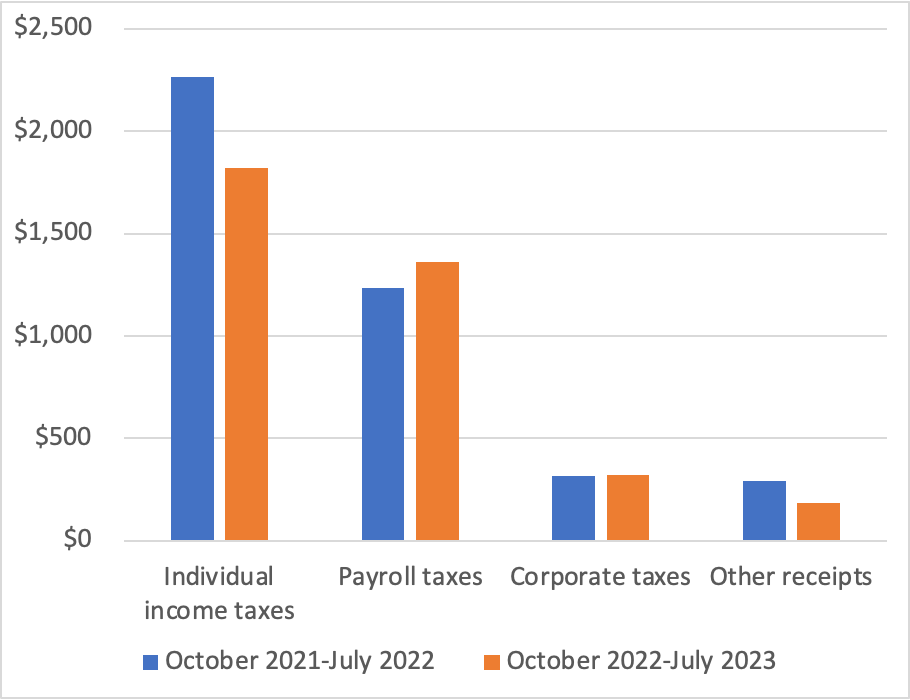
The following figure shows a breakdown of the decline in federal receipts. While corporate taxes and payroll taxes (primarily used to fund the Social Security and Medicare systems) increased, personal income tax receipts fell by 20 percent, and “other receipts” fell by 37 percent. The decline in other receipts is largely the result of a decline in payments from the Federal Reserve to the U.S. Treasury from $99 billion in 2022 to $1 billion in 2023. As we discuss in Macroeconomics, Chapter 17, Section 17.4 (Economics, Chapter 27, Section 27.4), Congress intended the Federal Reserve to be independent of the rest of the government. Unlike other federal agencies and departments, the Fed is self-financing rather than being financed by Congressional appropriations. Typically, the Fed makes a profit because the interest it earns on its holdings of Treasury securities is more than the interest it pays banks on their reserve deposits. After paying its operating costs, the Fed pays the rest of its profit to the Treasury. But as the Fed increased its target for the federal funds rate beginning in March 2022, it also increased the interest rate it pays banks on their reserve deposits. Because most of the securities it holds pay low interest rates, the Fed has begun running a deficit, reducing the payments it makes to the Treasury.
Note: The values on the vertical axis are in billions of dollars.
The reasons for the sharp decline in individual income taxes are less clear. The decline was in the “nonwithheld category” of individual income taxes; federal income taxes withheld from worker paychecks increased. People who are self-employed or who receive substantial income from sources such as capital gains from selling stocks, make quarterly estimated income tax payments. It’s these types of personal income taxes that have been unexpectedly low. Accordingly, smaller capital gains may be one explanation for the shortfall in federal revenues, but a more complete explanation won’t be possible until more data become available later in the year.
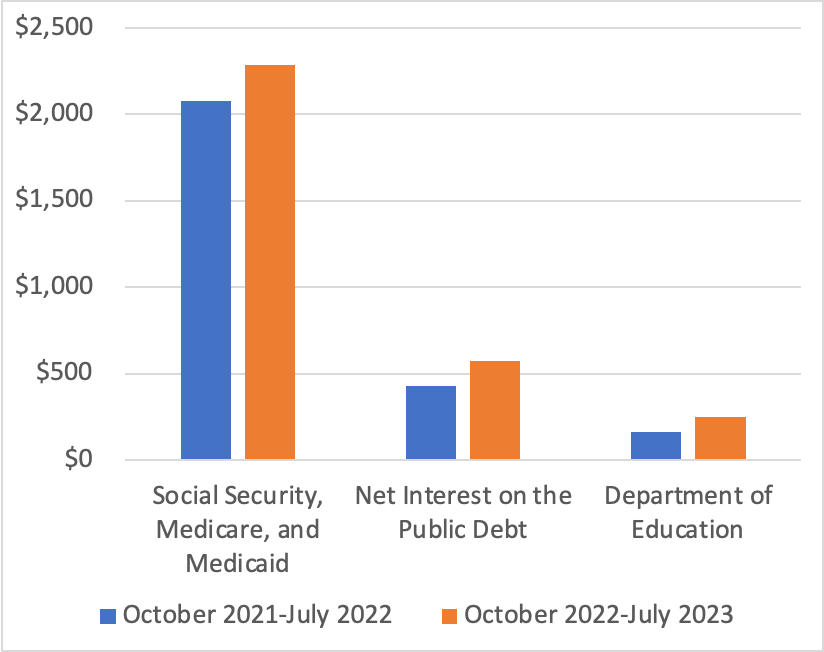
The following figure shows the categories of federal outlays that have increased the most from 2022 to 2023. The largest increase is in spending on Social Security, Medicare, and Medicaid, with spending on Social Security alone increasing by $111 billion. This increase is due partly to an increase in the number of retired workers receiving benefits and partly to the sharp rise in inflation, because Social Security is indexed to changes in the consumer price index (CPI). Spending on Medicare increased by $66 billion or a surprisingly large 18 percent. Interest payments on the public debt (also called the federal government debt or the national debt) increased by $146 billion or 34 percent because interest rates on newly issued Treasury securities rose as nominal interest rates adjusted to the increase in inflation and because the public debt had increased significantly as a result of the large budget deficits of 2020 and 2021. The increase in spending by the Department of Education reflects the effects of the changes the Biden administration made to student loans eligible for the income-driven repayment plan. (We discuss the income-driven repayment plan for student loans in this blog post.)
Note: The values on the vertical axis are in billions of dollars.
The surge in federal government outlays occurred despite a $120 billion decline in refundable tax credits, largely due to the expiration of the expansion of the child tax credit Congress enacted during the pandemic, a $98 billion decline in Treasury payments to state and local governments to help offset the financial effects of the pandemic, and $59 billion decline in federal payments to hospitals and other medical facilities to offset increased costs due to the pandemic.
In this blog post from February, we discussed the challenges posed to Congress and the president by the CBO’s forecasts of rising federal budget deficits and corresponding increases in the federal government’s debt. The unexpected expansion in the size of the federal budget deficit for the current fiscal year significantly adds to the task of putting the federal government’s finances on a sound basis.
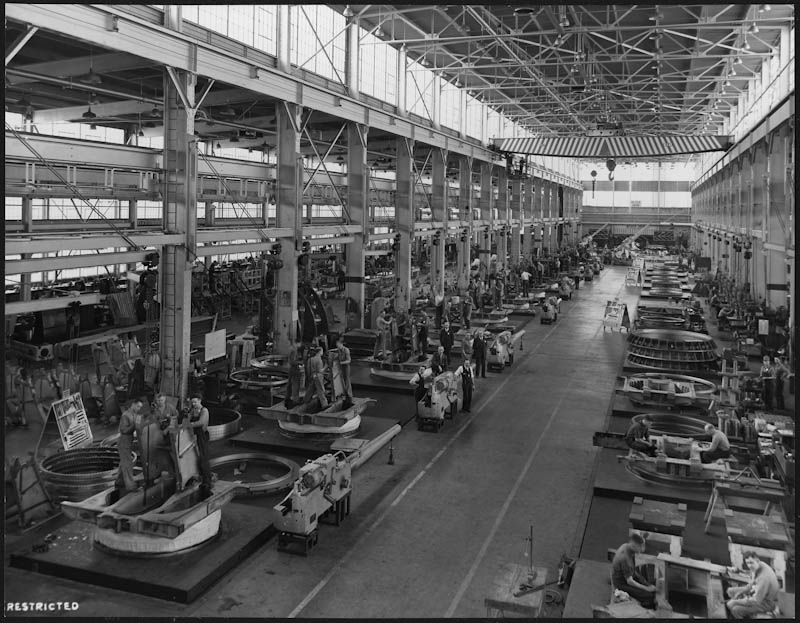
Main Gun Mount Assembly Plant, Northern Pump Co. Plant, Fridley, Minnesota, 1942. (Photo from the Franklin D. Roosevelt Presidential Library & Museum.)
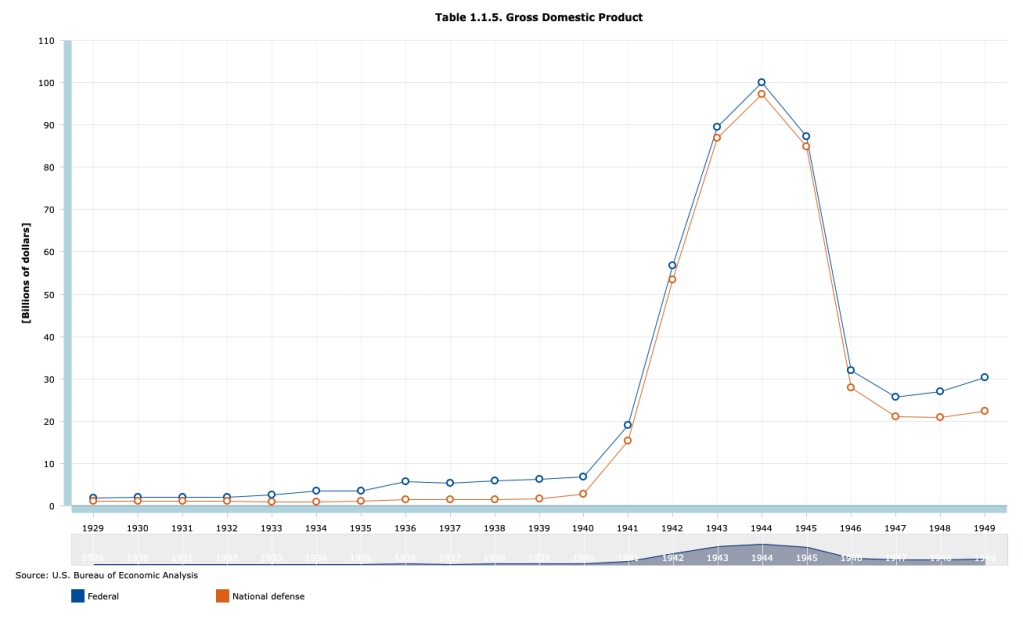
To fight World War II, the federal government had to dramatically increase spending. As the following figure shows, total federal spending rose from $6.8 billion in 1940 to a peak of $100.1 billion in 1944. National defense spending made up most of the increase, rising from $2.8 billion in 1940 to $97.3 billion in 1944.
Part of the increased spending was paid for by increases in taxes. Total federal tax receipts rose from $6.2 billion in 1940 to $35.8 billion in 1945. Individual income taxes rose from $1.0 billion in 1940 to 18.6 billion in 1945. Tax rates were raised and the minimum income at which people had to pay tax on their income was reduced. From the introduction of the federal individual income tax in 1913 until 1940, only people who had at least upper middle class incomes paid any federal income taxes. Following the passage by Congress of the Revenue Act of 1942, most workers had to pay federal income taxes. In 1940, 7.4 million people had to pay federal individual income taxes. In 1945, 42.7 million people had to. For the first time, the federal government withheld taxes from workers paychecks. Previously, all taxes were due on March 15th of the year following the year being taxed. Milton Friedman, who in the 1970s won the Nobel Prize in Economics, was part of the team at the U.S. Treasury that designed and implemented the system of withholding income taxes. Withholding of individual income taxes has continued to the present day.
Although large, the increases in federal taxes were insufficient to fund the massive military spending required to win the war. As a result, the U.S. Treasury had to greatly increase its sales of Treasury bonds. Recall from Macroeconomics, Chapter 16, Section 16.6 (Economics, Chapter 26, Section 26.6 and Essentials of Economics, Chapter 18, Section 18.6) that the total value of outstanding Treasury bonds is called the federal government debt, sometimes called the national debt. The part of federal government debt held by the public rather than by government agencies, such as the Social Security Trust Funds, is call the public debt. In order to gauge the effects of the debt on the economy, economists typically look at the size of the public debt relative to GDP. The following figure shows the public debt as a percentage of GDP for the years from 1929 to 2022.
The figure shows that the ratio of debt to GDP increased sharply from 1929 to the mid-1930s, reflecting the federal budget deficits resulting from the Great Depression, and then soared beginning in 1940. Debt peaked at 113 percent of GDP in 1945 and then began a long decline that lasted until 1974, when debt had fallen to 23 percent of GDP. The ratio of debt to GDP then fluctuated until the Great Recession of 2007-2009 when it began a steady increase that turned into a surge during and after the Covid-19 pandemic. (We discuss the causes of the recent surge in debt in this blog post.)
What caused the long decline in the ratio of debt to GDP that began in 1946 and continued until 1974? The usual explanation is that the decline was not primarily due to the federal government paying off a signficiant portion of the debt. The public debt did decline from a peak of $241.9 billion in 1946 to $214.3 billion in 1949 but there were no significant declines in the level of the public debt after 1949. Instead the ratio of debt to GDP declined because GDP grew faster than did the debt.
Recently in a National Bureau of Economic Research Working Paper, “Did the U.S. Really Grow Out of Its World War II Debt?” Julien Acalin and Laurence M. Ball of Johns Hopkins University have analyzed the issue more closely. They conclude that economic growth played a smaller role in reducing the debt-to-GDP ratio than has previously been thought. In particular, they highlight the fact that for significant periods through the 1970s, the Treasury was able to pay a real interest rate on the debt that was lower than market rates. Lower real interest rates reduced the amount by which the debt might otherwise have grown.
As we discuss in Money, Banking, and the Financial System, Chapter 13, Section 13.2, in April 1942, to support the war effort, the Federal Reserve announced that it would fix interest rates on Treasury securities at low levels: 0.375 percent on Treasury bills and 2.5 percent on Tresaury bonds. This policy continued after the end of the war in 1945 until the Fed was allowed to abandon the policy of pegging the interest rates on Treasury securities following the March 1951 Treasury-Federal Reserve Accord. Acalin and Ball also note that even after the Accord, there were periods in which actual inflation was well above expected inflation, causing the real interest rate the Treasury was paying on debt to be below the expected real interest rate. In other words, part of the falling debt-to-GDP ratio was financed by investors receiving lower returns on their purchases of Treasury securities than they had expected to.
Acalin and Ball conclude that if the Treasury had not done the relatively small amount of debt repayment mentioned earlier and if it had had to pay market real interest rates on the debt, debt would have declined to only 74 percent of GDP in 1974, rather than to 23 percent.
Sources: The debt and GDP data are from the Congressional Budget Office, which can be found here, and from the Office of Management and the Budget, which can be found here.