Image created by ChatGPT
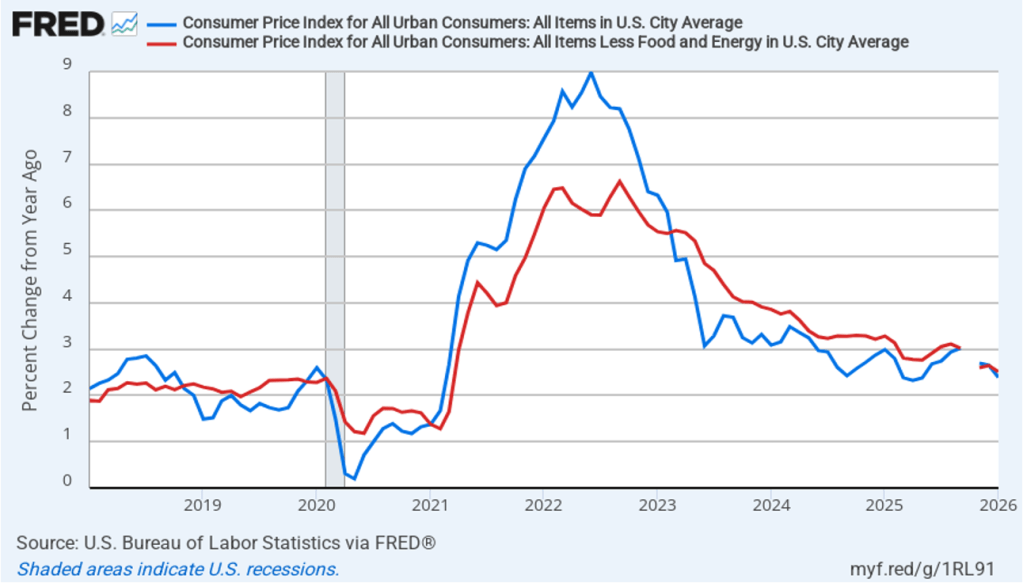
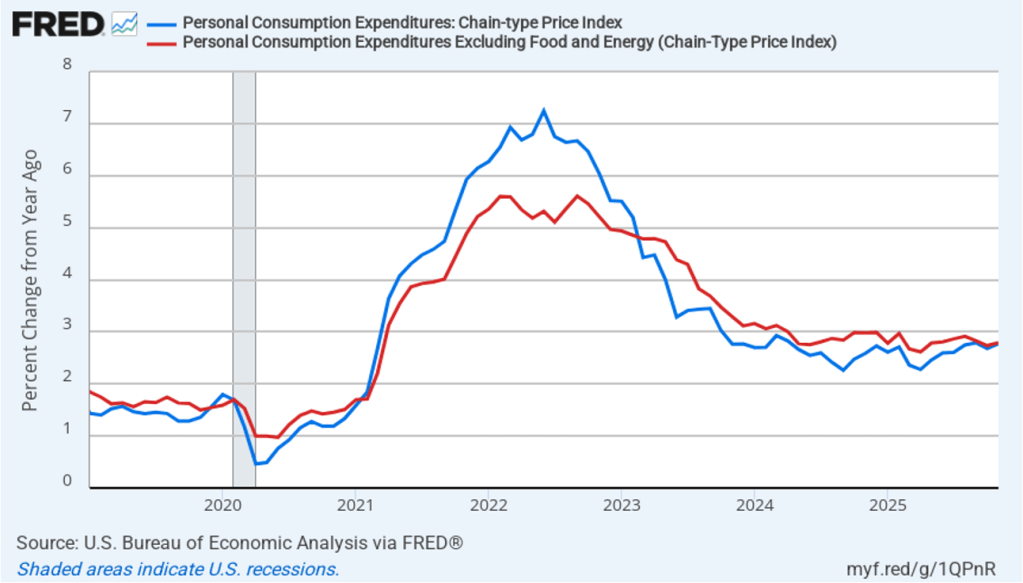
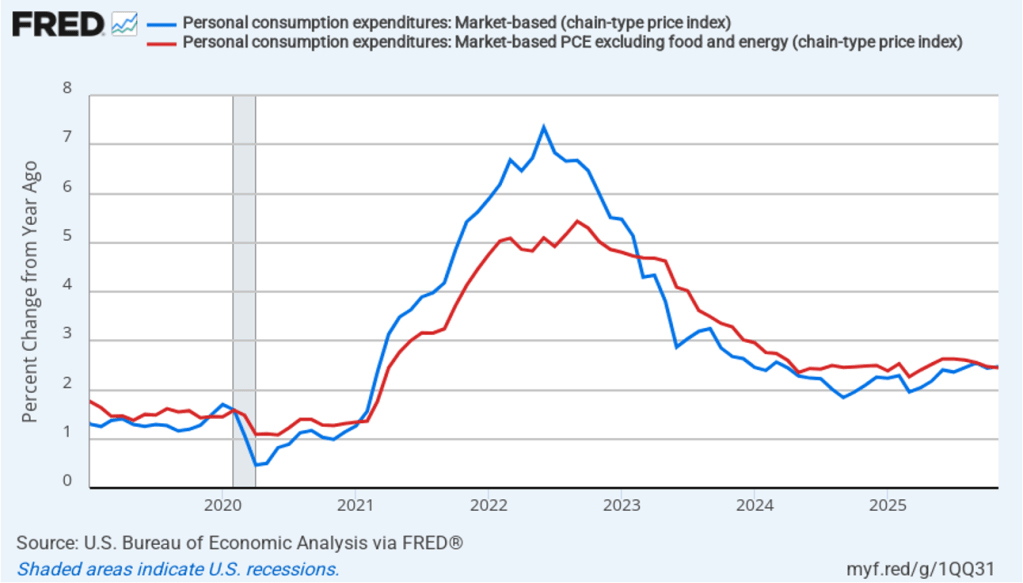
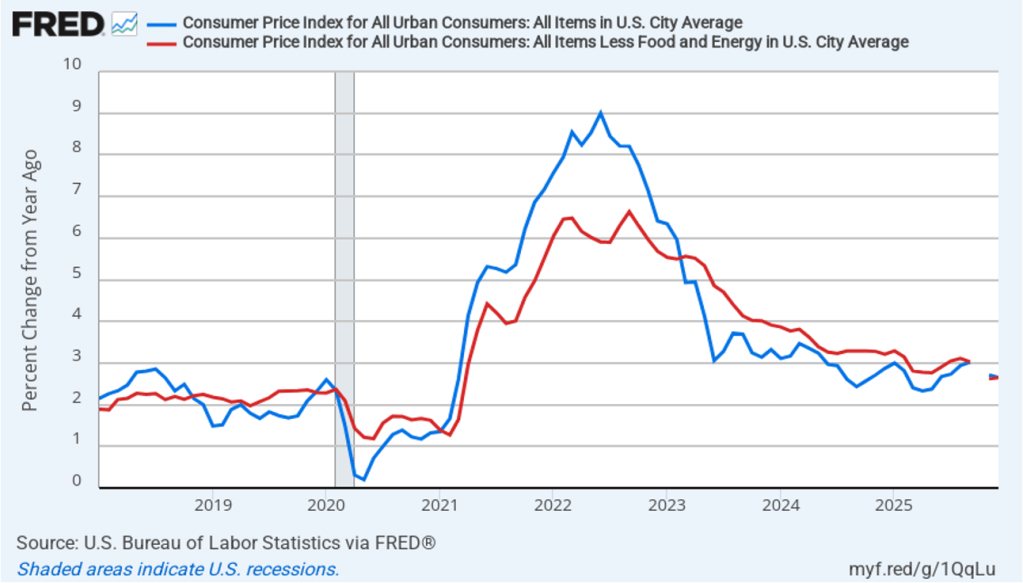
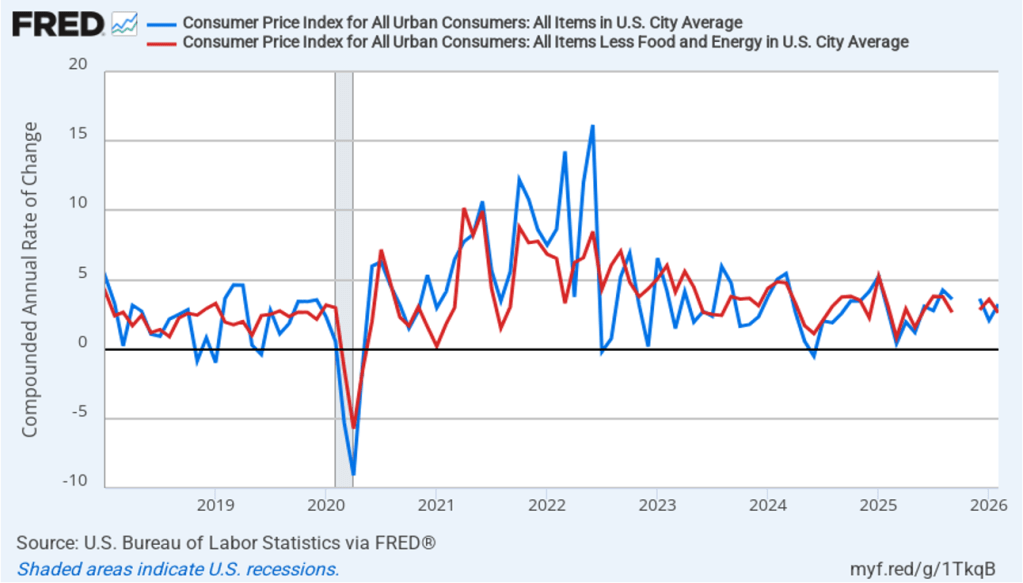
The news this morning on inflation was ho-hum. The Bureau of Labor Statistics (BLS) released its report on the consumer price index (CPI) for February. Inflation was about as expected and remained moderately above the Federal Reserve’s 2 percent annual inflation target. The following figure compares headline CPI inflation (the blue line) and core CPI inflation (the red line). Because of the effects of the federal government shutdown, the BLS didn’t report inflation rates for October or November, so both lines show gaps for those months.
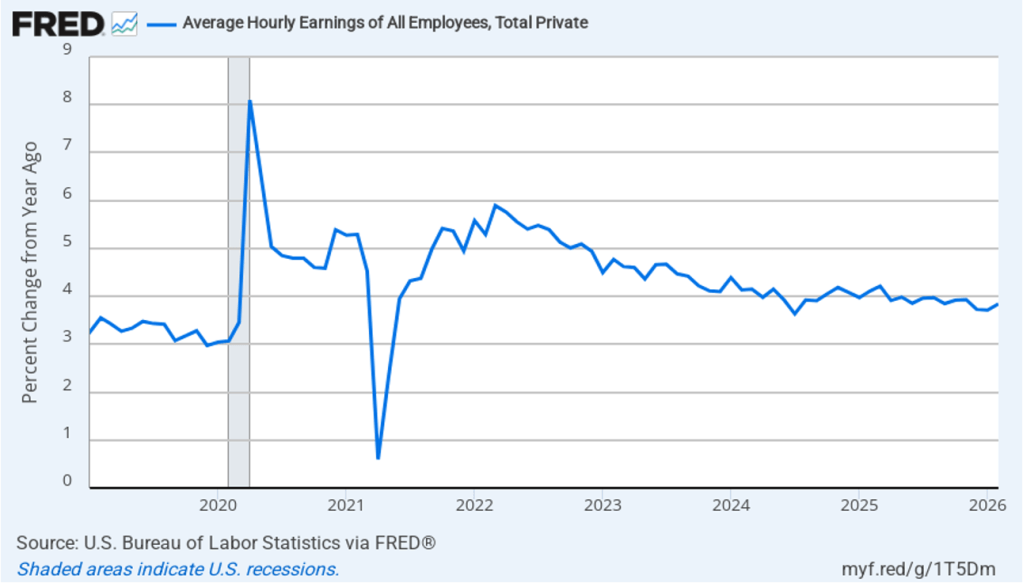
- The headline inflation rate, which is measured by the percentage change in the CPI from the same month in the previous year, was 2.4 percent in February, unchanged from January.
- The core inflation rate, which excludes the prices of food and energy, was 2.5 percent in February, also unchanged from January.
Headline and core inflation were both equal to the forecasts of economists surveyed by the Wall Street Journal.

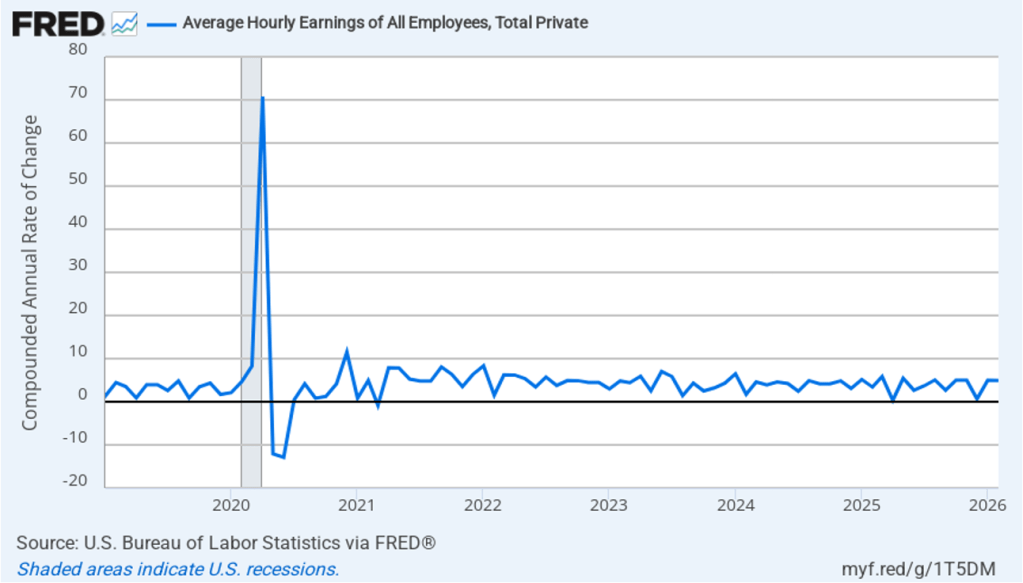
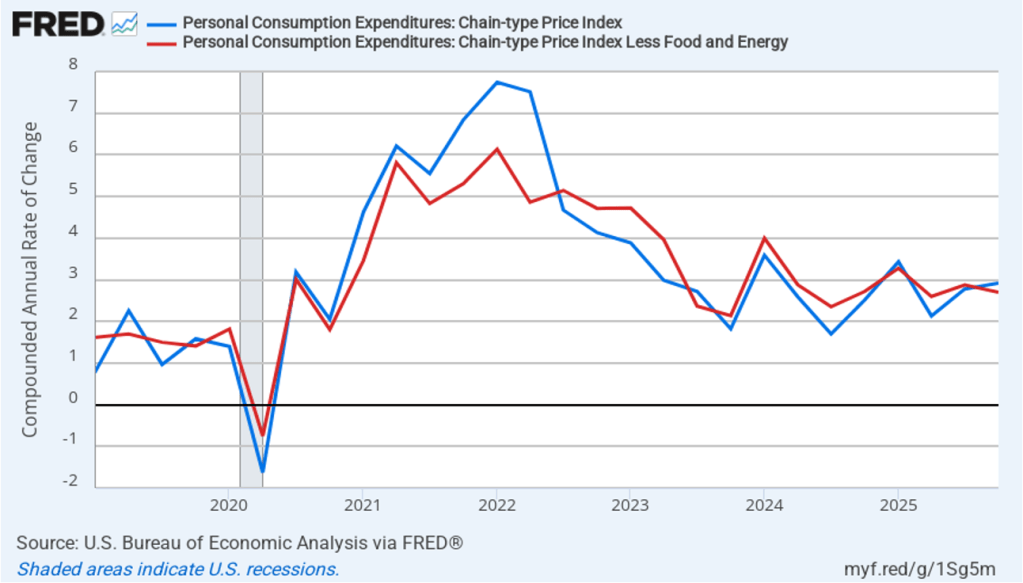
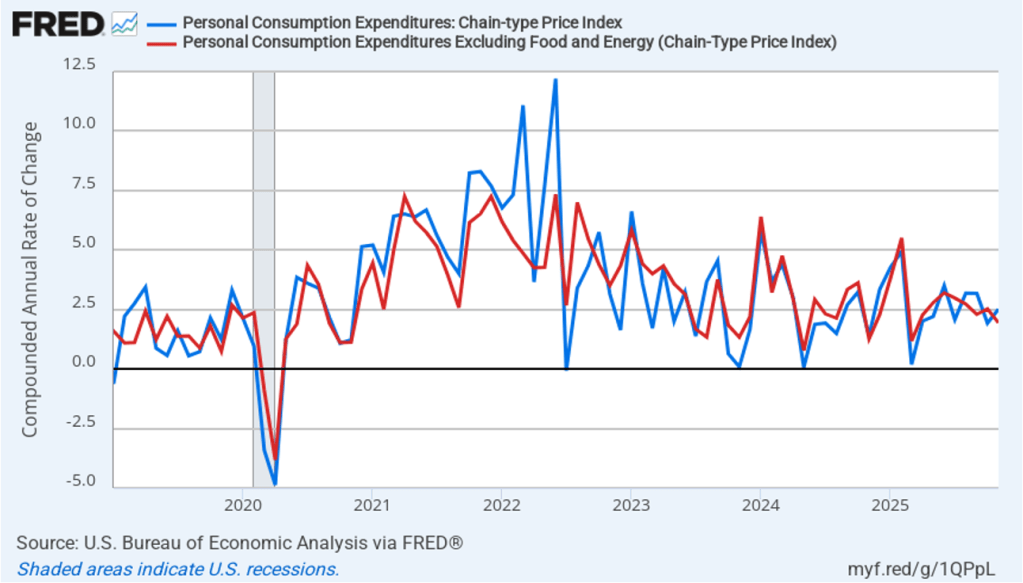
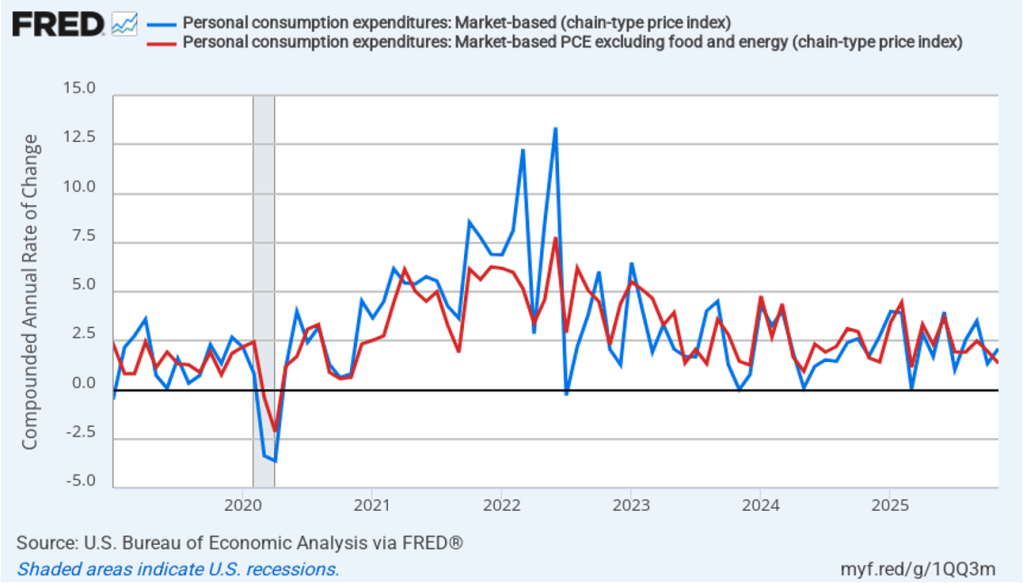
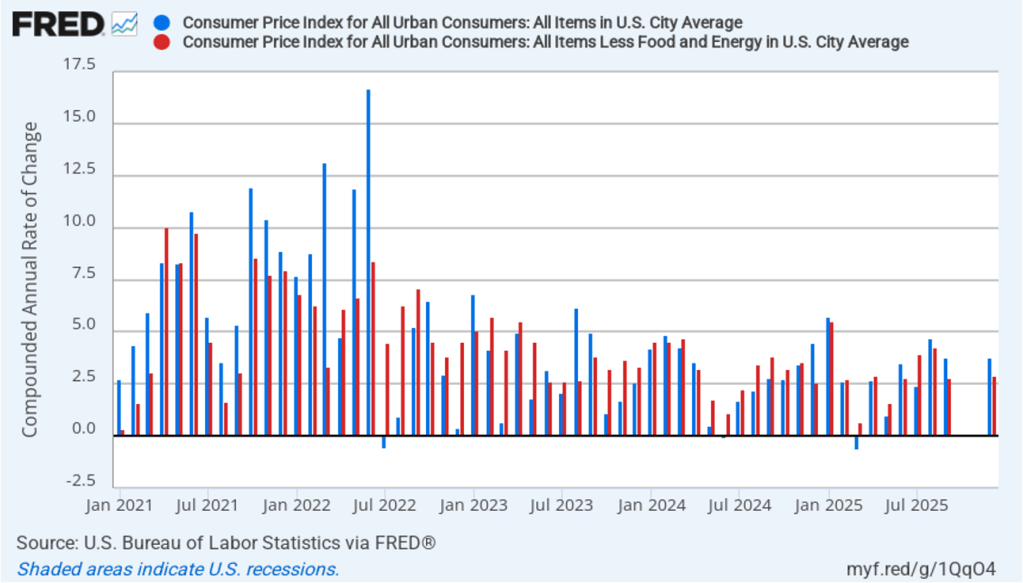
In the following figure, we look at the 1-month inflation rate for headline and core inflation—that is the annual inflation rate calculated by compounding the current month’s rate over an entire year. Calculated as the 1-month inflation rate, headline inflation (the blue line) was 3.2 percent in February, up from 2.1 percent in January. Core inflation (the red line) decreased to 2.6 percent in February from 3.6 percent in January.
The 1-month and 12-month headline and core inflation rates are telling similar stories, with both measures indicating that the rate of price increase is running somewhat above the Fed’s 2 percent inflation target.
Of course, it’s important not to overinterpret the data from a single month. The figure shows that the 1-month inflation rate is particularly volatile. Also note that the Fed uses the personal consumption expenditures (PCE) price index, rather than the CPI, to evaluate whether it is hitting its 2 percent annual inflation target. February data on the PCE will be released on Friday.
In recent months, there have been many media reports on how consumers are concerned about declining affordability. Affordability has no exact interpretation but typically means concern about inflation in goods and services that consumers buy frequently.
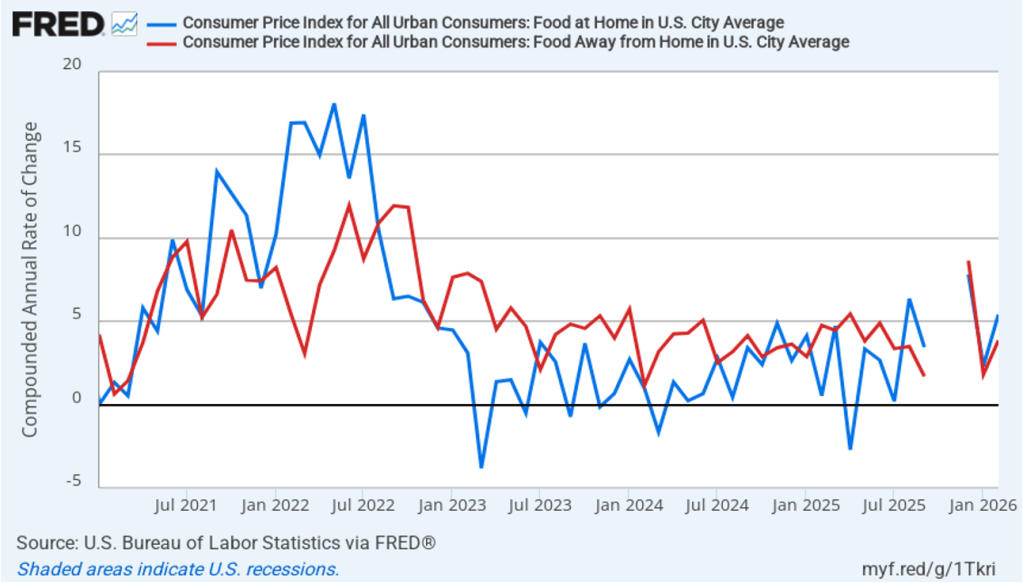
Many consumers seem worried about inflation in food prices. The following figure shows 1-month inflation in the CPI category “food at home” (the blue bar)—primarily food purchased at groceries stores—and the category “food away from home” (the red bar)—primarily food purchased at restaurants. Inflation in both measures rose in February. Food at home increased 5.4 percent in February, up from 2.3 percent in January. Food away from home increased 3.9 percent in February, up from 1.8 percent in January. Again, 1-month inflation rates can be volatile.
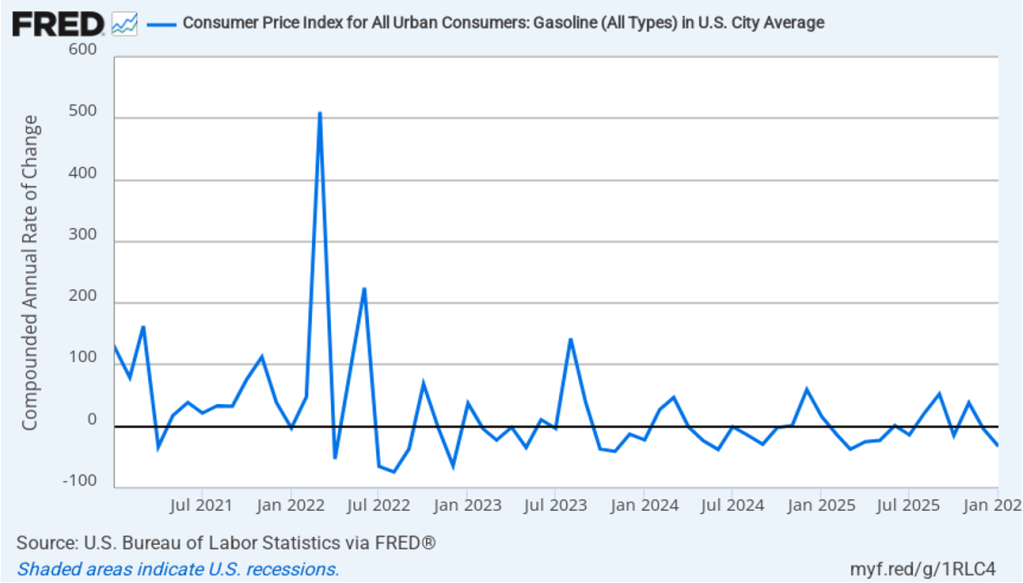
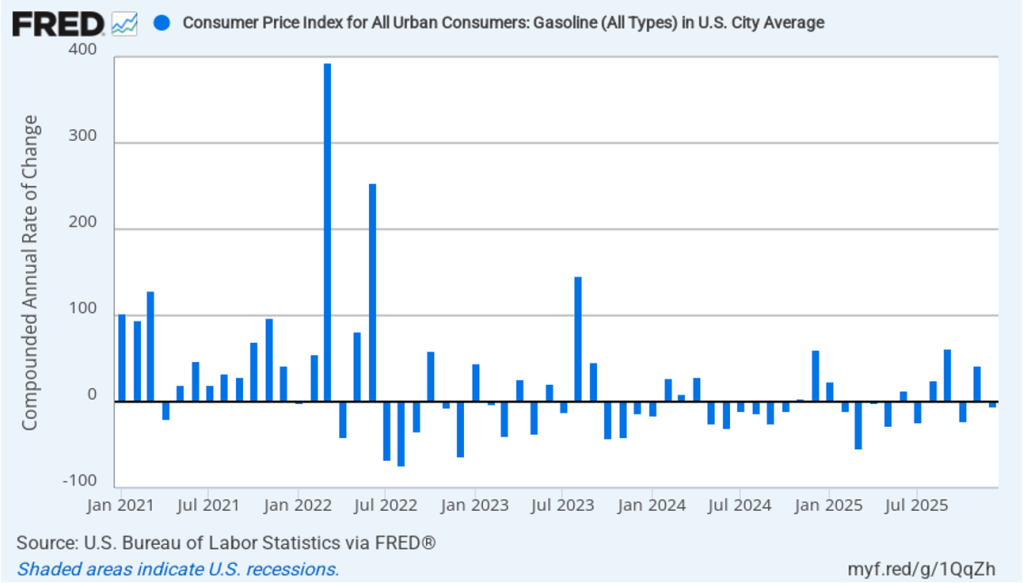
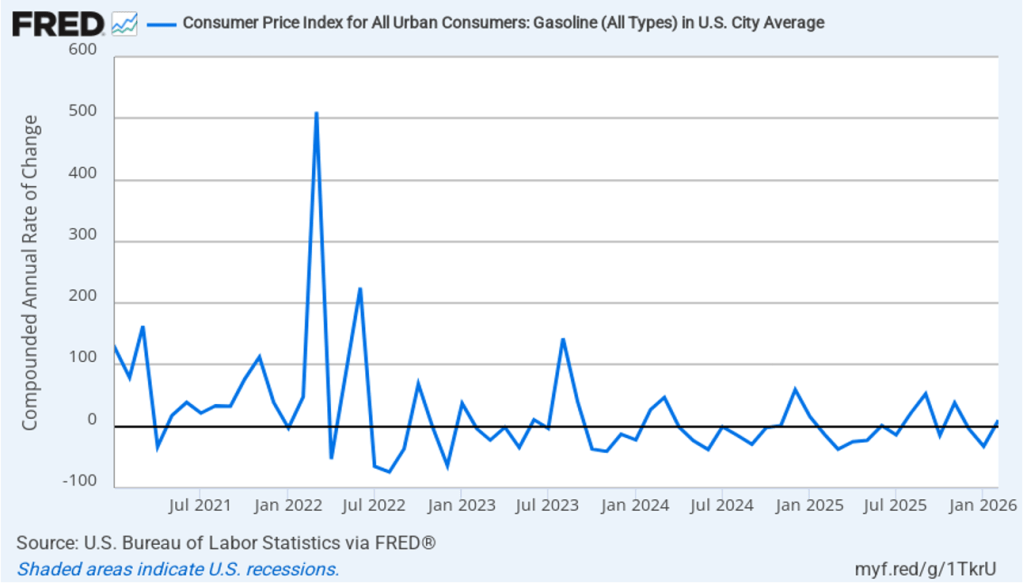
Gasoline prices, which bounce around a lot from month to month, were up in February. The following figure shows 1-month inflation in gasoline prices. In February the price of gasoline increase at an annual rate of 10.1 percent, after having fallen at an annual rate of 32.2 percent in January. These data were gathered before the increase in gasoline prices caused by the conflict in Iran. The increase in food and gasoline prices helped push headline inflation above core inflation in February.
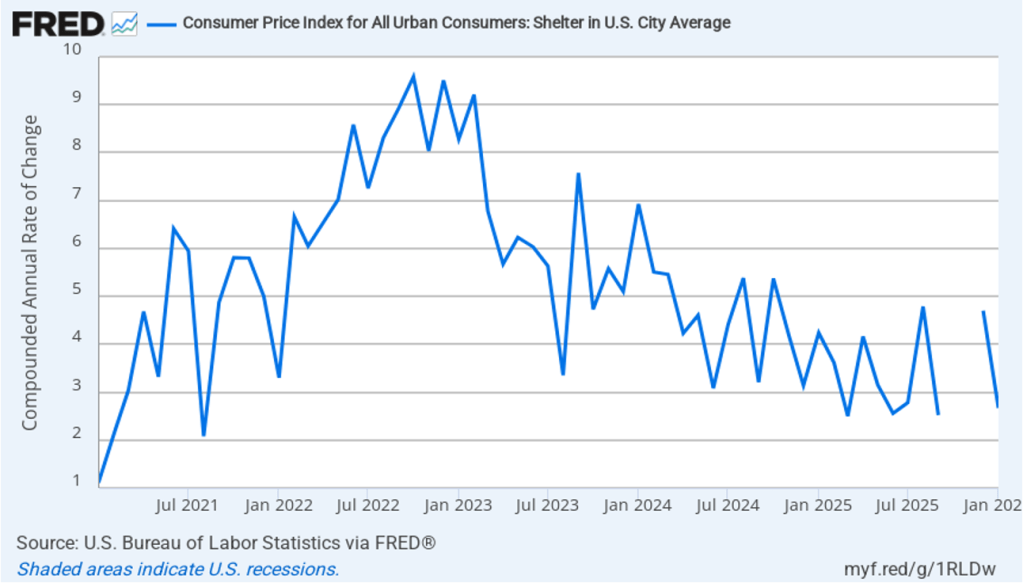
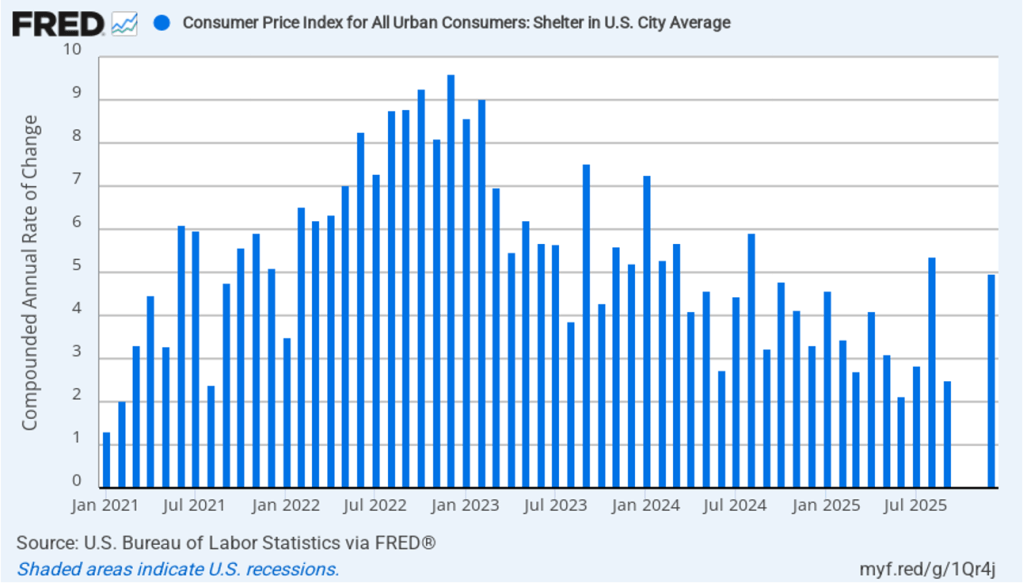
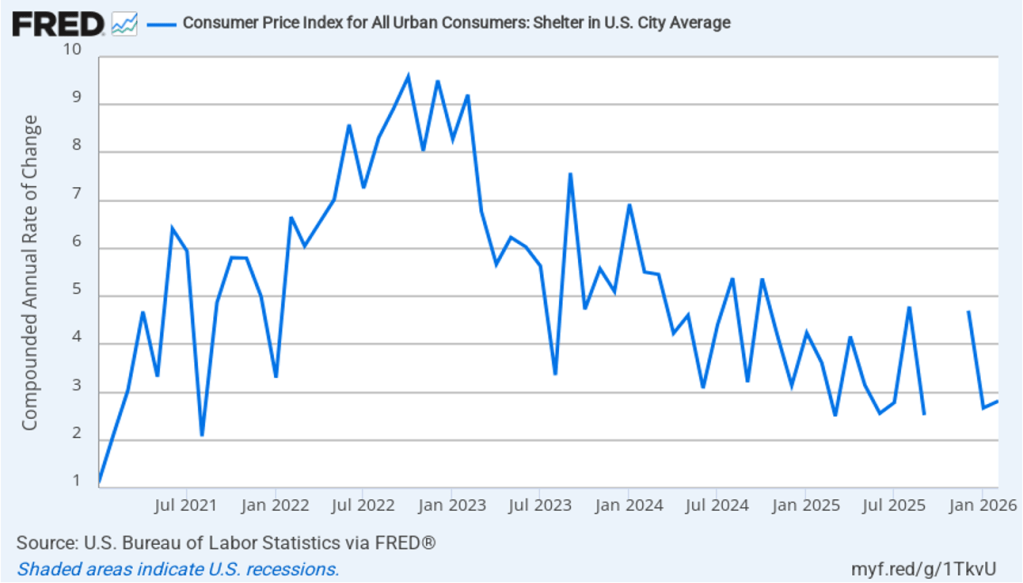
The affordability discussion has also focused on the cost of housing. The price of shelter in the CPI, as explained here, includes both rent paid for an apartment or a house and “owners’ equivalent rent of residences (OER),” which is an estimate of what a house (or apartment) would rent for if the owner were renting it out. OER is included in the CPI to account for the value of the services an owner receives from living in an apartment or house. The following figure shows 1-month inflation in shelter.
One-month inflation in shelter, which has been trending down since early 2023, increased slightly to 2.8 percent in February from 2.7 in January.
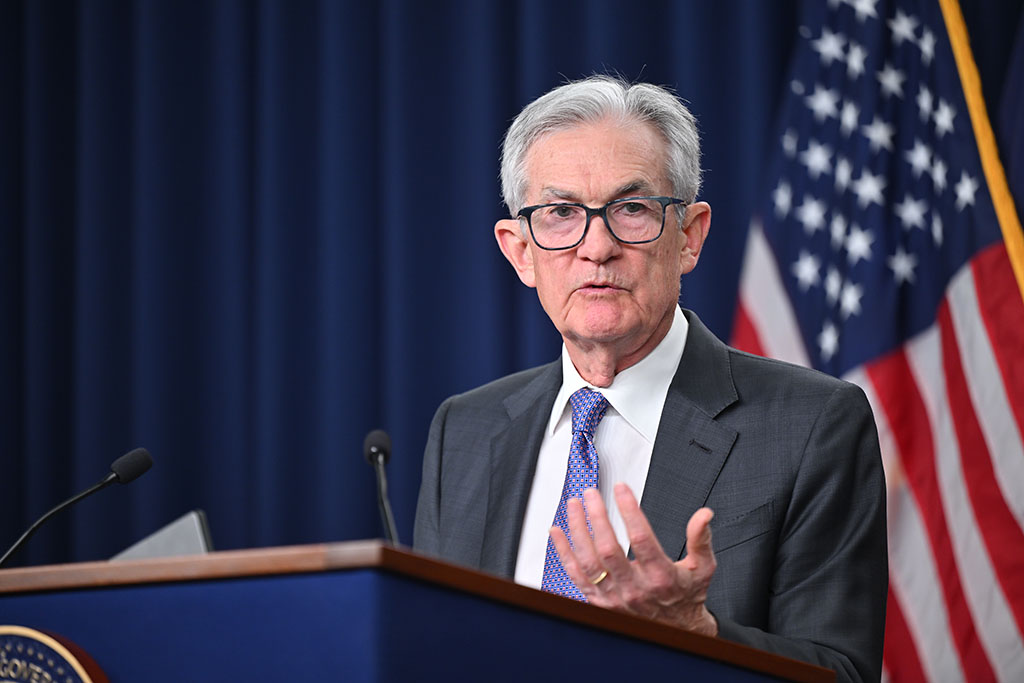
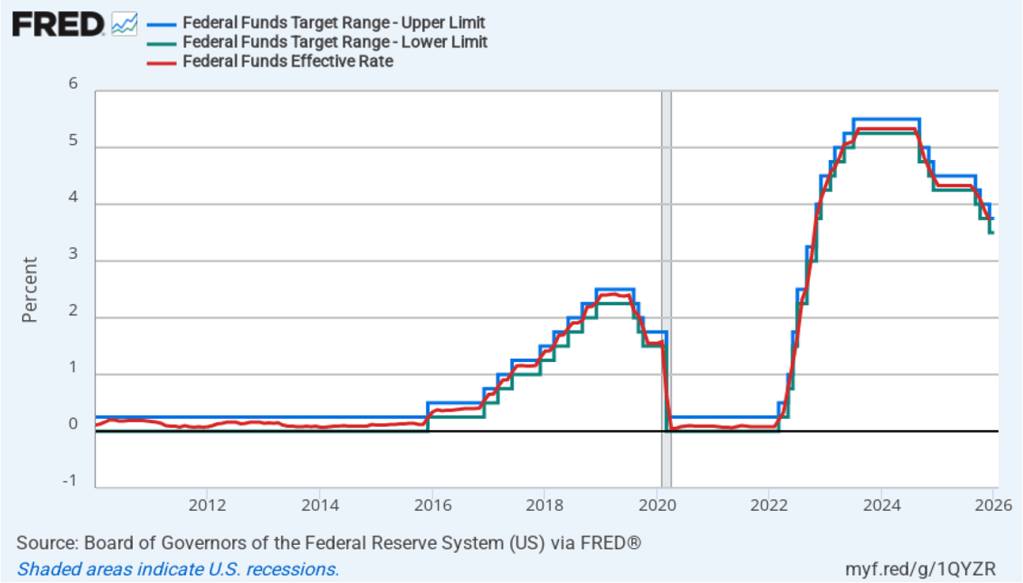
It’s unlikely that this inflation report will have much effect on the views of the members of the Federal Reserve’s policymaking Federal Open Market Committee (FOMC). The FOMC is unlikely to lower its target for the federal funds rate at its next meeting on March 17–18. The probability that investors in the federal funds futures market assign to the FOMC keeping its target rate unchanged at that meeting increased only slightly from 98.4 percent yesterday to 99.4 percent this afternoon.