Supports: Macroeconomics, Chapter 15, Economics, Chapter 25, Essentials of Economics, Chapter 17, and Money, Banking, and the Financial System, Chapter 15.

Image generated by ChatGTP-4o.
In a book review in the Wall Street Journal, the financial writer James Grant referred to “the Federal Reserve’s goal to cheapen the dollar by 2% a year.”
- Briefly explain what “cheapen the dollar” means.
- Briefly explain what Grant means by writing that the Fed has a “goal to cheapen the dollar by 2% a year.”
- Do you agree with Grant that the Fed has this goal? Briefly explain.
Solving the Problem
Step 1: Review the chapter material. This problem is about the economic effects of the Federal Reserve’s policy goal of a 2 percent annual inflation rate, so you may want to review Chapter 15, Section 15.5, “A Closer Look at the Fed’s Setting Monetary Policy Targets.”
Step 2: Answer part a. by explaining what “cheapen the dollar” means. Judging from the context, “cheapen the dollar” means to reduce the purchasing power of a dollar. Whenever inflation occurs, the amount of goods and services a dollar can purchase declines. If the inflation rate in a year is 10 percent, than at the end of the year $1,000 can buy 10 percent fewer goods and services than it could at the beginning of the year.
Step 3: Answer part b. by expalining what Grant means by the Fed having a goal of cheapening the dollar by 2 percent a year. Congress has given a dual mandate of high employment and price stability. Since 2012, the Fed has interpreted a 2 percent annual inflation rate as meeting its mandate for price stability. So, Grant means that the Fed’s 2 percent annual inflation goal in effect is also a goal to cheapen—or reduce the purchasing power of the dollar—by 2 percent a year.
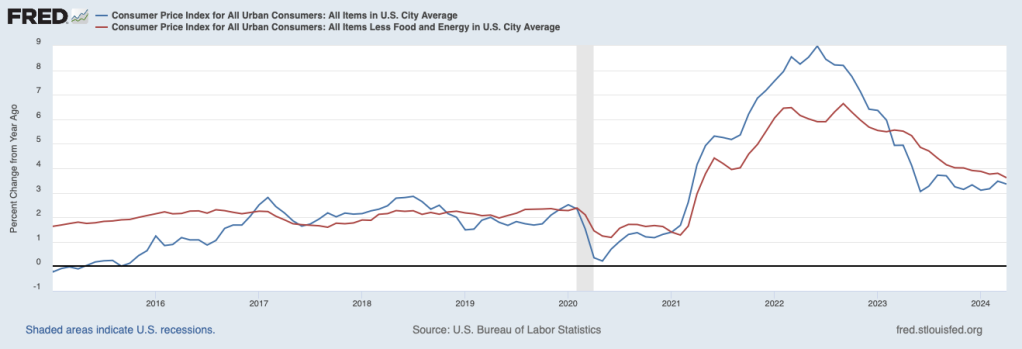
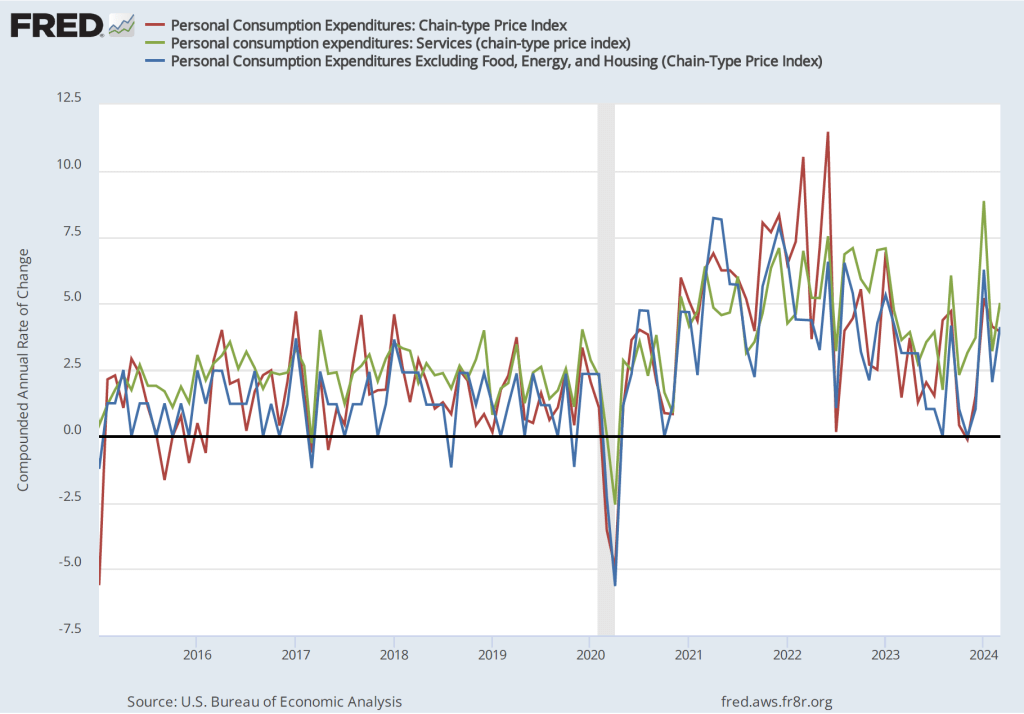
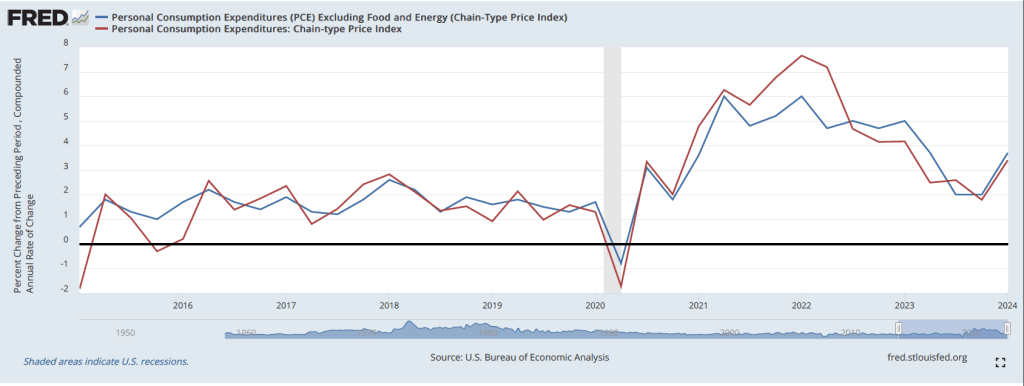
Step 4: Answer part c. by explaining whether you agree with Grant that the Fed has a goal of cheapening the dollar by 2 percent a year. As explained in the answer to part b., there is a sense in which Grant is correct; the Fed’s goal of a 2 percent inflation rate is a goal of allowing the purchasing power of the dollar to decline by 2 percent a year. One complication, however, is that most economists believe that changes in price indexes such as the consumer price index (CPI) and the personal consumption expenditures (PCE) price index overstate the actual amount of inflation occurring in the economy. As we discuss in Macroeconomics, Chapter 9, Section 9.4 (Economics, Chapter 19, Section 19.4, and Essentials of Economics, Chapter 13, Section 13.4), there are several biases that cause price indexes to overstate the true inflation rate; the most important of the biases is the failure of price indexes to take fully into account improvements over time in the quality of many goods and services. If increases in price indexes are overstating the inflation rate by one percentage point, then the Fed’s goal of a 2 percent inflation rate results in the dollar losing 1 percent—rather than 2 percent—of its purchasing power over time, corrected for changes in quality.